The article is the ultimate guide to Zerodha Kite 3.0, a trading and charting platform of Zerodha (India’s No 1 Discount Broker). Here, you can do trading and charting analysis simultaneously. First, we will describe the tools and features in detail. After that, we provide a brief charting description here.
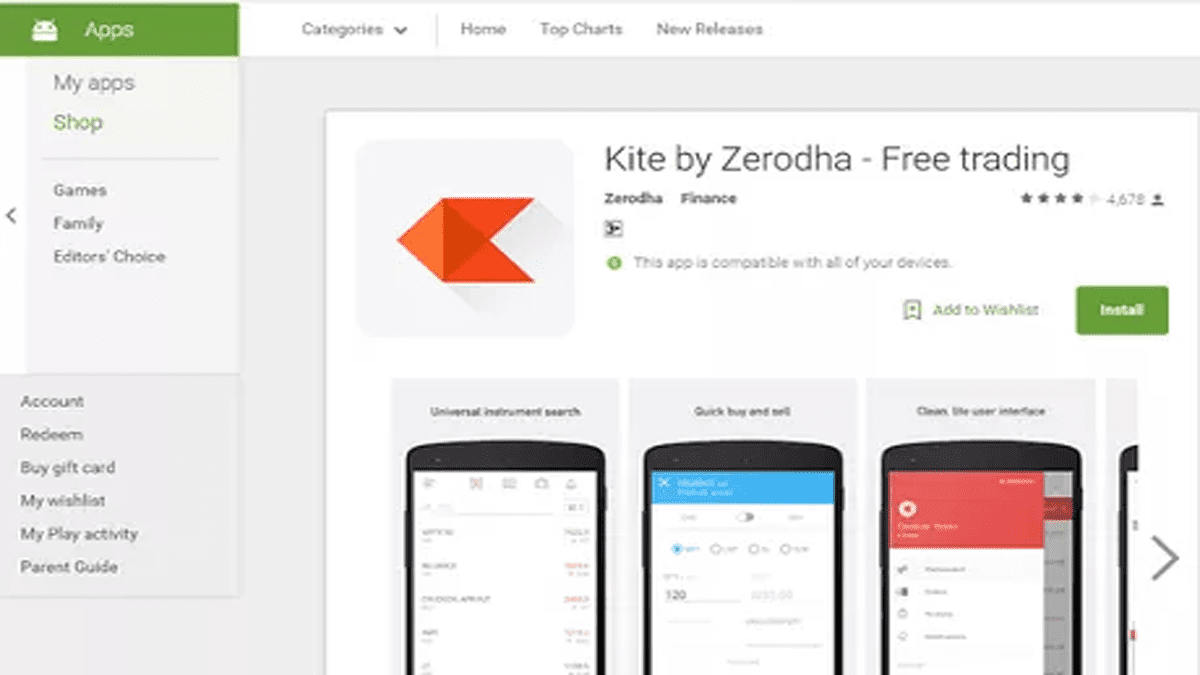
How to get Zerodha Kite 3.0 Platform?
Making a Profit is just one step away from you. If you still don’t have an account in Zerodha, open now and Start making a profit. Here is the LINK TO OPEN AN ACCOUNT WITH ZERODHA and get FREE access to ZERODHA KITE.
Many traders ask me for the Zerodha Kite 3.0 download link for Windows. There is a serious misconception among traders. Let’s begin with the features of the kite.
Zerodha Kite User Manual
Many traders who are trading in Zerodha and using the Zerodha Kite platform have hardly any idea about the Zerodha Kite user manual. You must read the user manual before you start using Kite as the user manual has covered the usage of Kite very extensively.
Where to Locate the Zerodha Kite User Manual?
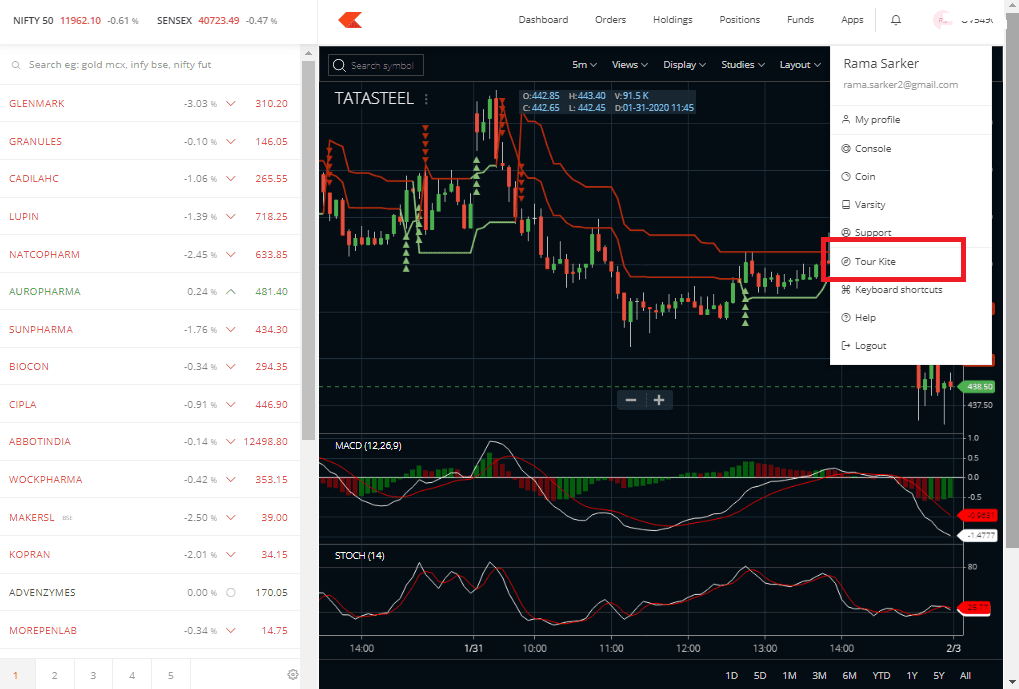
See the image below. Open Kite, log in and then click on your client id on the extreme right top corner of the Kite screen. Once you click there you can see the option “Tour kite”. Click on it and the user manual will open in a new tab or window. The next window detail is given below.
Topics Covered in the Manual
It extensively covered the following topics of Zerodha Kite.
- Getting started
- Marketwatch
- Funds
- Orders
- Portfolio
- Charting
- Kite Android
- Utilities
- Videos
- Support
All the tutorials in the Manual are divided into short sub-tutorials and have enough images, write-ups, and videos to explain the usage of Zerodha Kite in a very neat manner.
Even if you are not a Zerodha customer, still you can get their user manual facility. The process to check their manual even if you are not a customer, is given below.
If you are not a Zerodha customer you can also read the Zerodha Kite user manual by clicking here.
Zerodha Kite 3.0 – Charting and Trading Combined
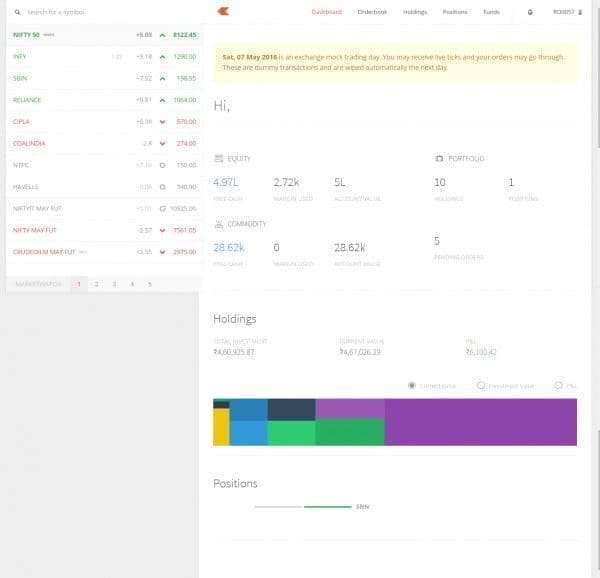
New Dashboard
Zerodha’s new Kite offers you a brand new dashboard. Here you can see your account summary and scrips at a glance. Also, you can see your favourite scrip here and place a buy-sell order without adding it to the market watch.
Market Depth Window
First of all, I am going to cover the definition or function of the market depth window. We also know this window as the snap quote window. On Zerodha Kite one can get the market depth option with each selected script. Multiple MD windows can be opened in Zerodha Kite. Just move your cursor on the script you select, you can get the market depth besides buying and selling an option. It is an updated reflection of real-time stock market activity or an overall presentation of market movements. This window not only displays the overview of current market strength but also helps traders to evaluate the market activity.
In Zerodha Kite, the information one can get through the Market Depth window is the bid price and offer price with orders and quantity. Along with this, open, high, low, close, the average price, volume, LTQ (last traded quantity), and LTT (last traded time). In order to clarify the subject more easily, I am giving an image of the Market Depth window option from Zerodha Kite.
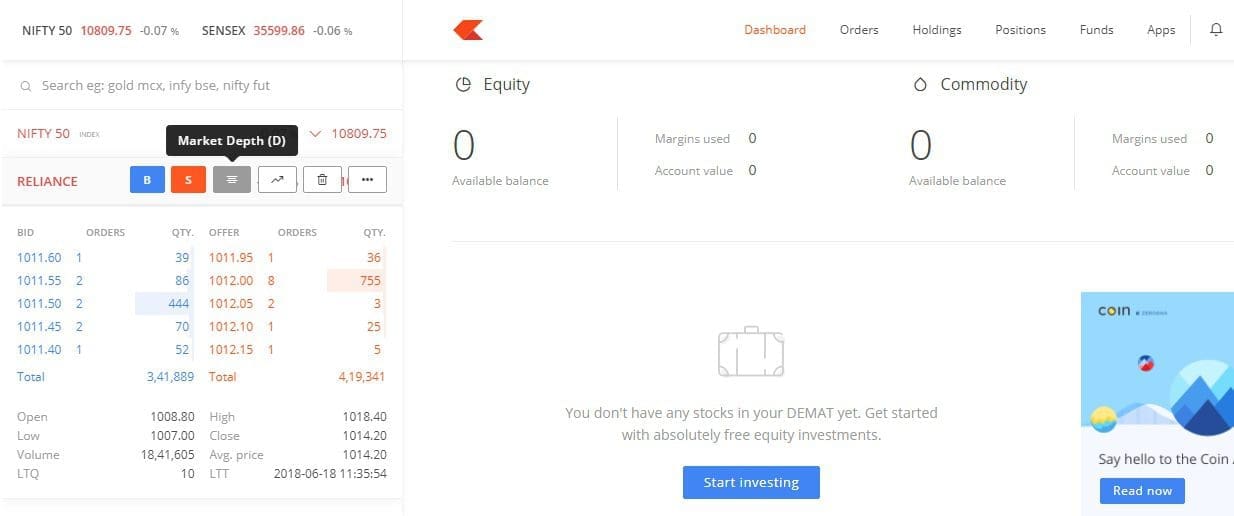
We have given the above image as an example. As you can see that besides B (buy) and S (sell) options, you can find market-depth windows. Step by step I am going to describe the available information in the Market Depth window.
Bid Price
This refers to the price a buyer is willing to pay for a security at the bid price. The window shows the best five bid prices with orders and quantity.
Offer Price
The price at which sellers are willing to sell securities. Market Depth displays the best five offer prices as well as orders and quantities.
Therefore, the bid price is highlighted in blue and the offer price is highlighted in red. As we can see in the above statement that the offer price is more than the bid price. I have already mentioned that the bid price refers to the buy price and the offer price is the selling price. Hence, when the offer price is more than the bid price that indicates the market is going down and when the bid price is up, the market is in a bullish trend.
Other Information
From the other information like open, high, low, close, volume, LTT, LTQ traders can evaluate any security and analyze the price. It shows not only where the price is now, but where it is likely to be in the near future.
So, the Market depth window plays a significant role in the online trading account. Traders can fully utilize the option to monitor current market price movements.
Orders
Kite has an advanced order section. Here you will get different types of orders like MIS (intraday), CNC (Cash and carry), Market, Limit, SL, SL-M (Stop Loss Market), etc. Under the advance section, traders can get BO, and CO which we have described below. Apart from this, there are AMO (aftermarket order), IOC (immediate or cancel order), etc.
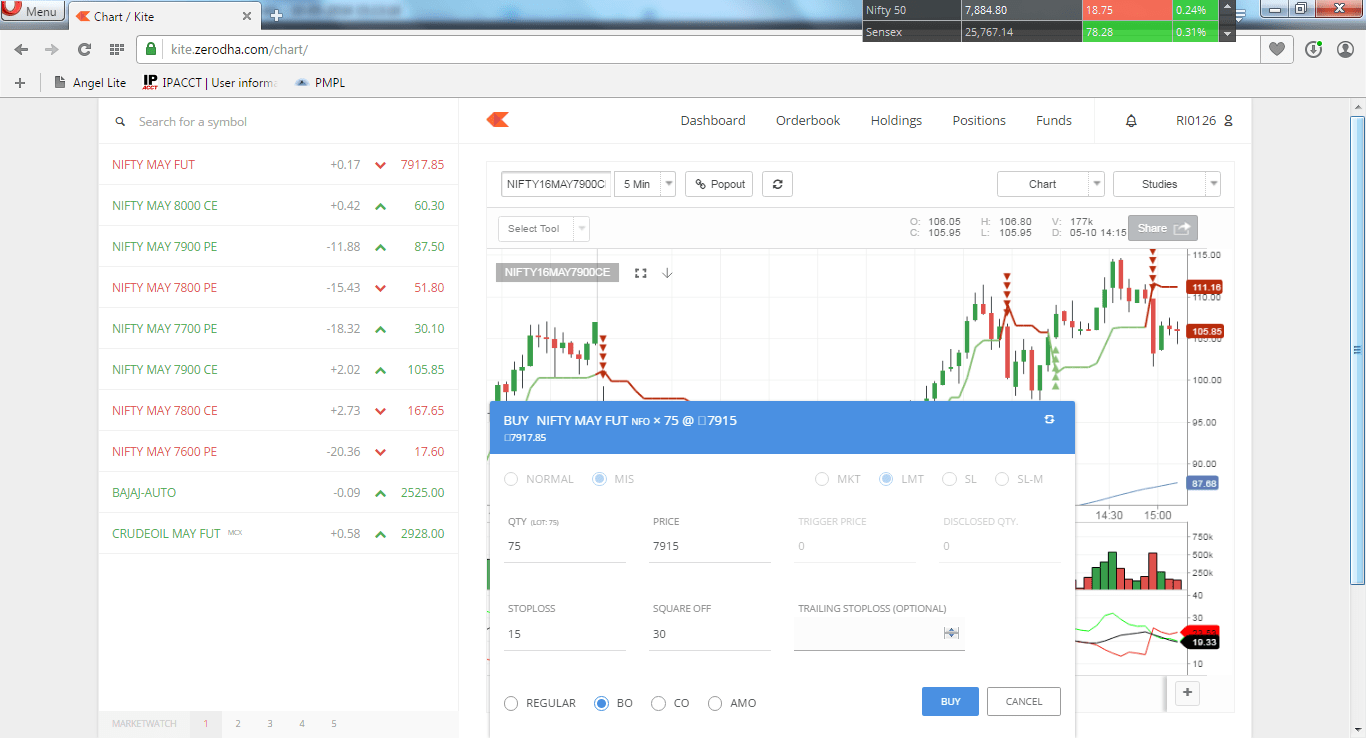
Bracket And Cover Orders
We are really happy to finally see Bracket Order (BO) and Cover Order (CO) in the kite. Just open a normal order window and click on More Options to open the BO and CO features. For example, if you want to buy Nifty at 7915 with a stop loss at 7900 (15 points) and a target at 7945 (30 points), then in price write 7915, in stop-loss write 15 and in square off write 30. Check the image below:
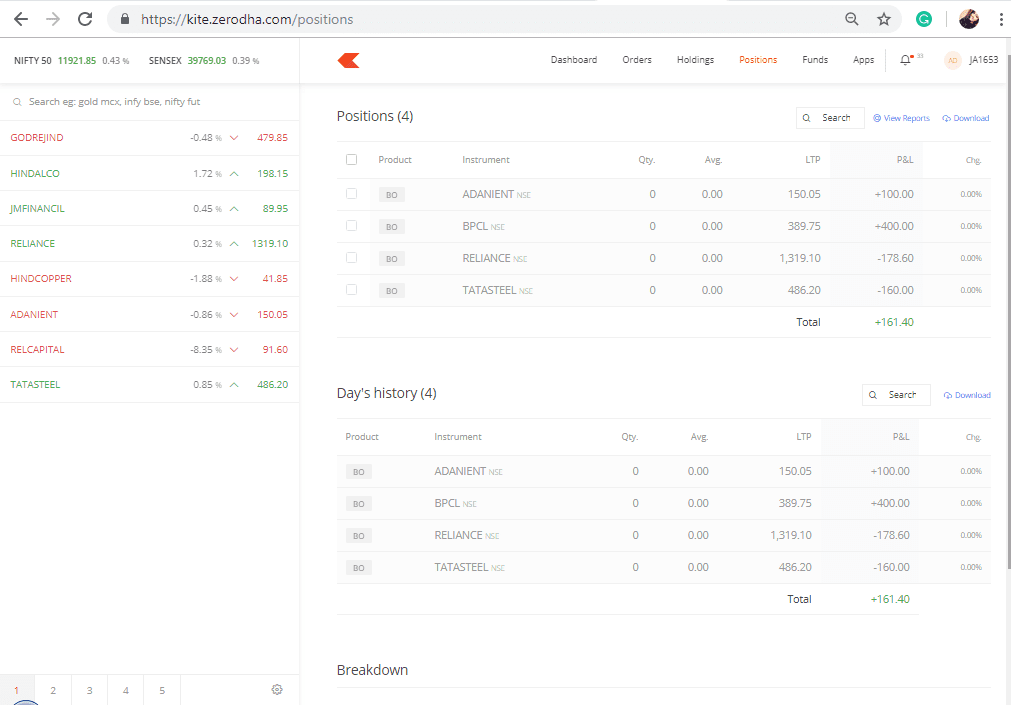
Holding & Positions Section:
Check your positions and holdings with a single mouse click. Export to Excel with ease. New Zerodha Kite 3.0 contains many useful features.
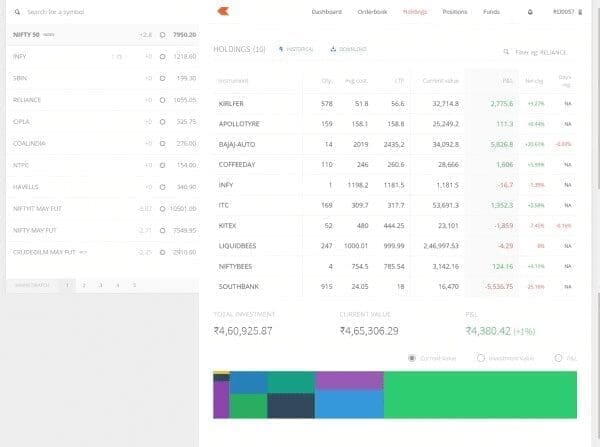
The position shows the current profit-loss statement of daily trading. If you work with CNC (Cash and carry), your script will be shown in the holding section after 24 hours.
Fund Transfer
Fund Transfer From the Terminal
Time needed: 5 minutes
How to Transfer Funds in Zerodha Kite 3.0?
- Login to Kite and click on the FUNDS menu
First, you need to log in to your trading account. On the top right click on FUNDS among the menus. This will take you to the Funds page.
- Adding or withdrawing funds
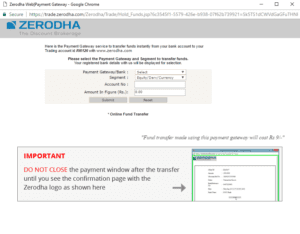
You will be able to see two big buttons – ADD FUNDS u0026 WITHDRAW. Clicking on ADD FUNDS will open another window where you will get options to add funds. In the ADD FUNDS page, you can put Payment Gateway/Bank, Segment (Equity OR Commodity), Account No and Amount In Figure (Rs.).
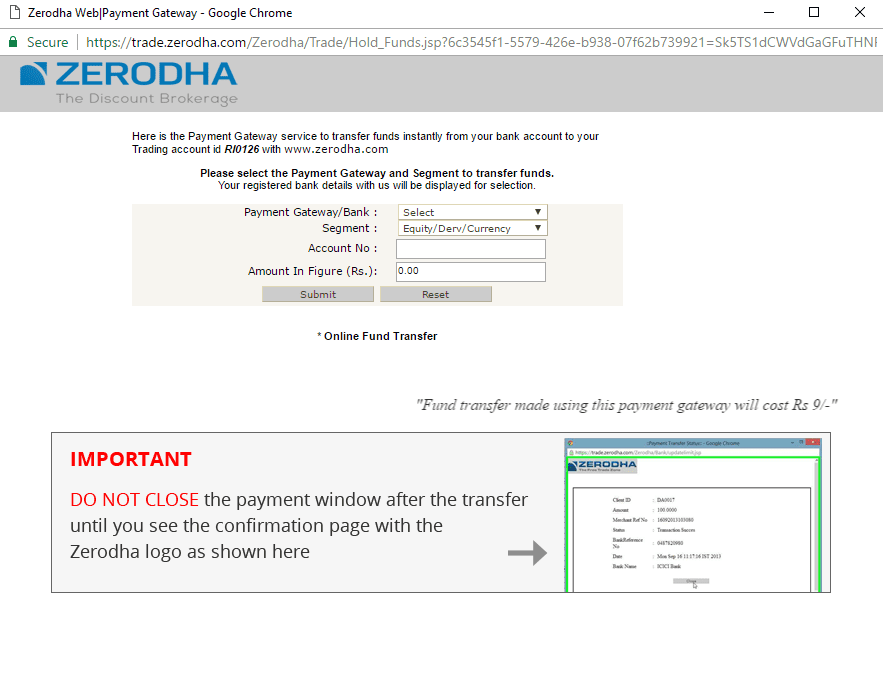
- Net Banking
If your bank account is linked to your trading account then the payment gateway and account number will be auto-filled once you select the mapped bank from the drop-down. Fill up the amount you want to transfer and click submit and it will take you to your net banking page where you can complete the transaction. Similarly clicking on WITHDRAW will take you to the page where you can choose how much money to withdraw from which segment (Equity OR Commodity).
Fund Transfer From the Mobile App
If you want to transfer funds from Zerodha Kite mobile app you can access the Funds option by clicking on the top left menu option. Check the image below:


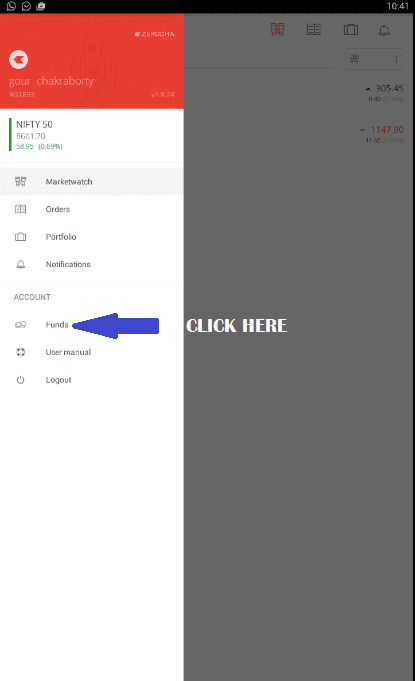
However from the mobile app, you can deposit funds to your trading account, but you will not be able to withdraw funds as of now.
Chart
Once you open the home screen, it opens with MarketWatch on the left and centre of the screen is occupied with information on your balance in Equity and Commodity, how much has been used in trading, total account values in both the sections, margin used, realized a profit and so on. Above the centre of the screen, there are buttons like Dashboard, Orderbook, Holdings, Position, Funds, Apps and your account besides buttons for adding funds and withdrawing.
To open a Zerodha Kite chart, one has to select security from Marketwatch. On selecting the security, a drop-down menu appears and there is a chart button there. Select the chart button and there appear a few buttons to customize the chart. First is the time button to which you can adjust your preference for the time frame. The time frame appears in 1min (minute), 3min, 5min, 10min, 15min, 30min, hour, 1d (day), 1w (week), 1mo (month).
Features of Zerodha Kite 3.0 Charts
Web-based charts so can be accessed from PC, mobile and tabs. Out of any office firewall, so log in and see free real-time charts of your favourite scrip right from your office. Trade full-time from your office. One single search box to right away hunt countless instruments and contracts over all fragments and trades. Stay informed regarding different instruments with spilling quotes and market profundity data conveyed with HTML5 WebSockets.
Moment warnings for order execution, cancellation, and modifications. Submit a request and sit tight for the orange dot! An undeniable RESTful API that uncovered every one of the platform’s functionalities. Put in, adjust, drop requests, force positions, property, and exchange data, and oversee reserves, all with the straightforward HTTP API. Kite web adjust to mobile screens while as yet empowering full access to every one of the platform’s elements.
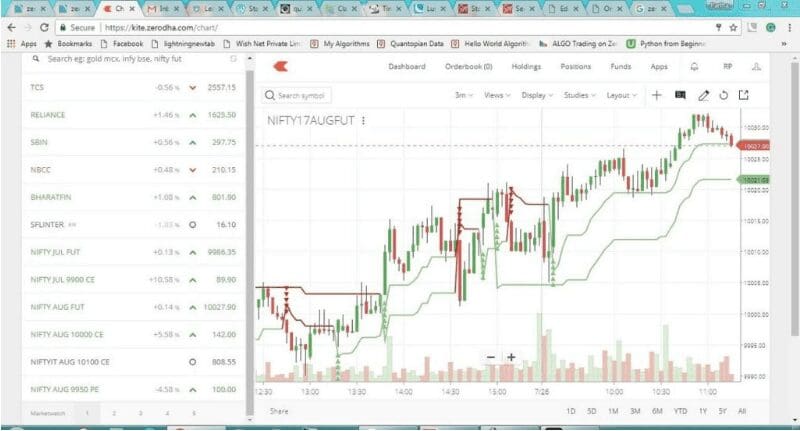
Now we can get tick-by-tick, free real-time charts of NSE, and MCX in Kite. Check the screenshot below for the Live Nifty futures chart.
Studies and Indicators
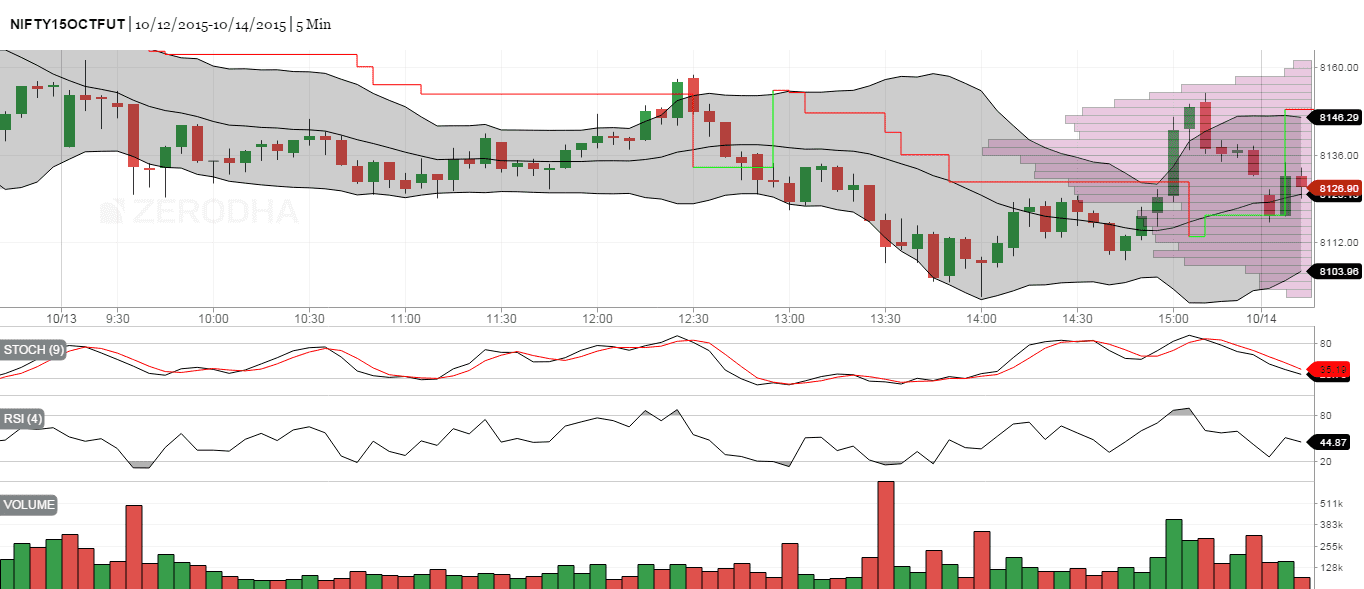
Many studies to choose from. Get all major indicators, all candle types, Renko Charts, range bar charts, SuperTrend, Pivot Points, Volume Profile and many more. Check the screenshot below:
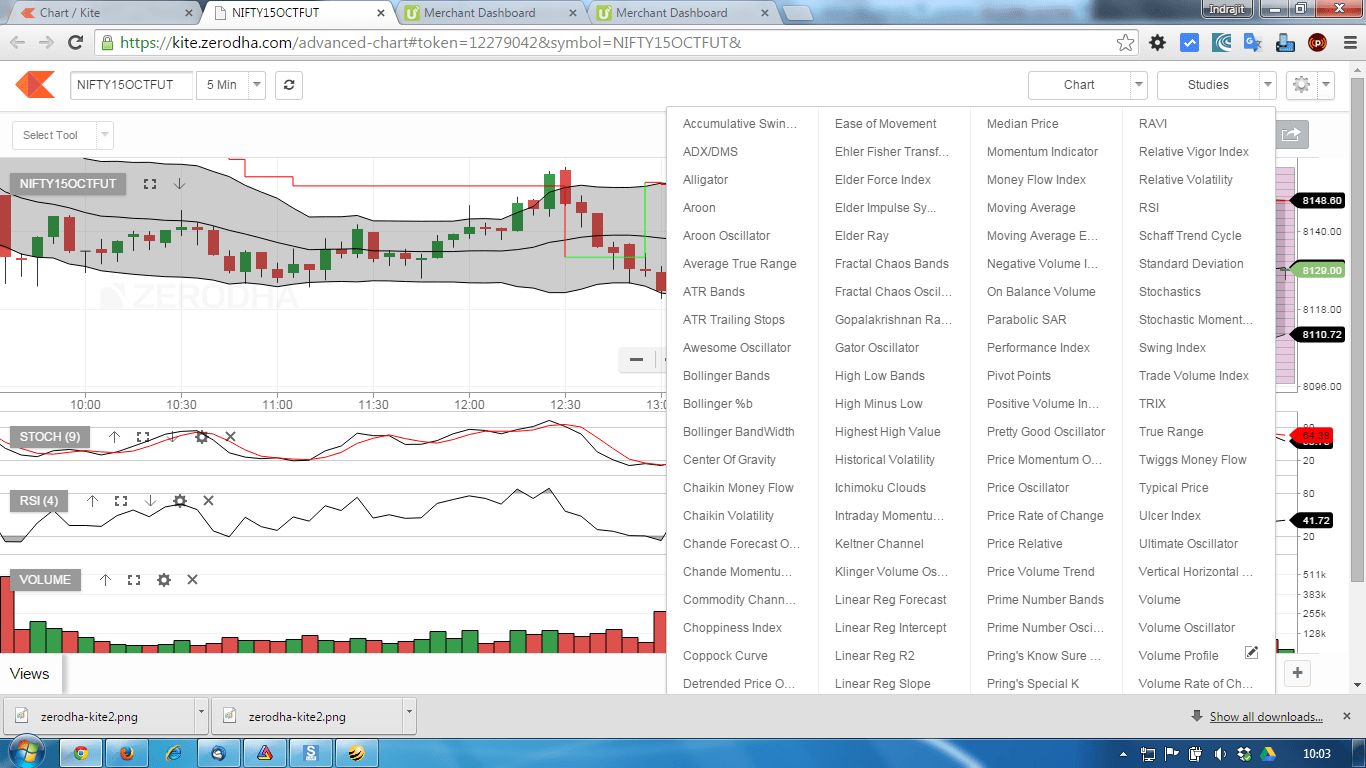
Zerodha Kite 3.0 chart also offers the Studies button which allows the user to choose from a big array of technical charts. Though we have shown two Supertrend Charts and imposed one on another, you can choose anything you wish and make a trading system from that, like DMA/EMa crossover, Bollinger Bands, Keltner Channel, a combination of MACD and Williams %R, Relative Strength Index – all at your own wish. One can also save chart preferences or clear preferences through the View / Layout button.
Different Types of Price Charts in Zerodha Kite 3.0
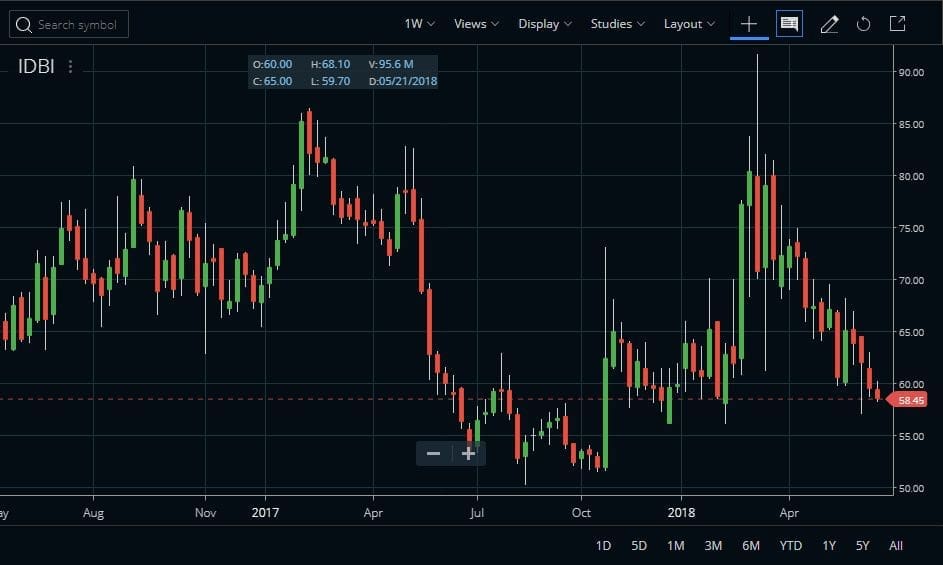
After you select the time frame goes to the display button to select the chart style and choose from Candlestick / Bar/ Line/ Coloured Bar/ Hollow Candle/ Mountain/ baseline/ Volume Candle. In addition, there is a preference button for Chart Preferences like Log Scale/ Continuous Scale. In the same menu, one can also customize the chart types from Heiken Ashi / Renko / Point & Figure / Kagi / Range Bars / Line Break with the settings button beside these. Say one wants to set the range of Renko bars and wants to see the Renko Chart, whenever the setting button is clicked, a menu appears asking to put your preferred range or choose Auto Select to view it in default mode.
Candlestick Chart Pattern
The pattern forms with different types of candlesticks. Each candlestick provides important information. It has a main body that indicates the opening and closing price, used in two different colours to distinguish bearish candles from bullish ones. Shadows indicate the high and low prices for a specific period of time. There are lots of candlesticks patterns, you can find full descriptions regarding candlestick chart patterns on our site.
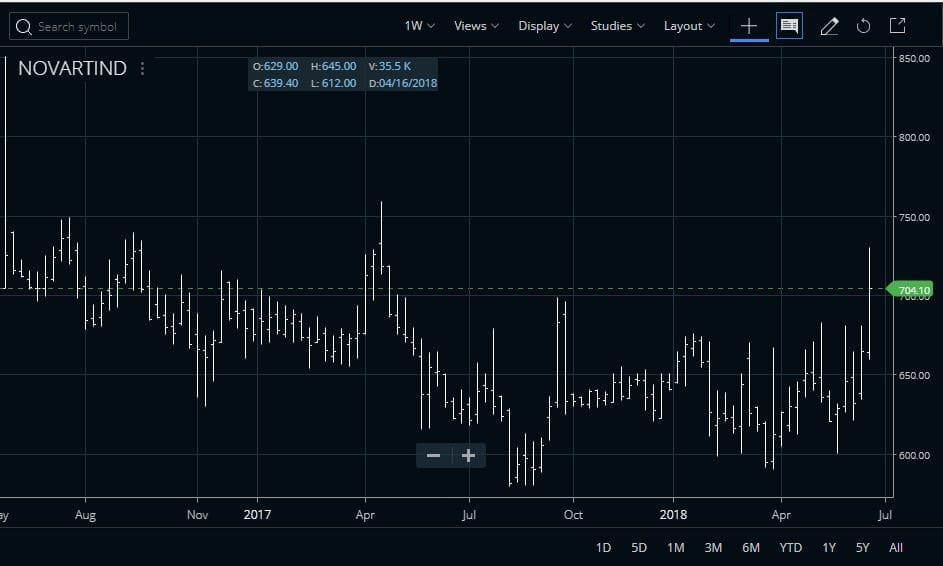
Bar Chart
Before the introduction of the candlestick, the bar chart was the most popular chart pattern. It is a versatile and basic pattern. In this type, each bar represents a single unit in time, a min, an hour, a day, etc. Each bar consists of three parts such as the central line, the left mark or tick, and the right mark/tick. It also refers to as OHLC charts (open-high-low-close). In this type, some charting application uses colour to indicate a bullish or bearish trend. To clarify the chart pattern in an easy way I am going to describe the three components of a bar.
- The central line- The top of the vertical line represents the highest price of a security and the bottom indicates the lowest price trading.
- The left mark- We can see the opening price on the left side.’
- The right mark- The right side represents the closing price.
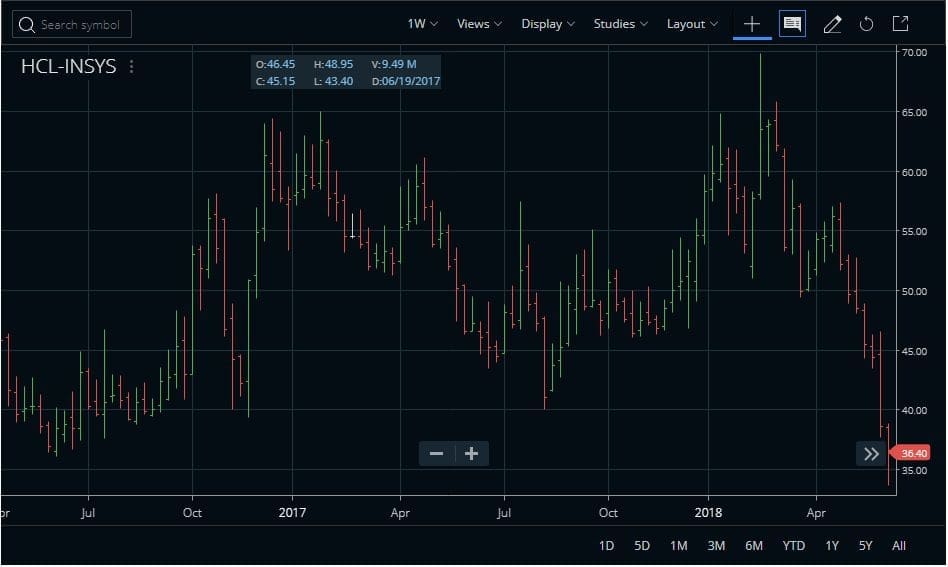
Coloured Bar
As I have stated above certain charting application uses colour to indicate a bullish or bearish trend. A coloured bar has almost the same characteristics as a normal bar pattern. The only difference is the bar represents a bullish and bearish trend by application of two different colours. You can identify the trend more easily by following the pattern.
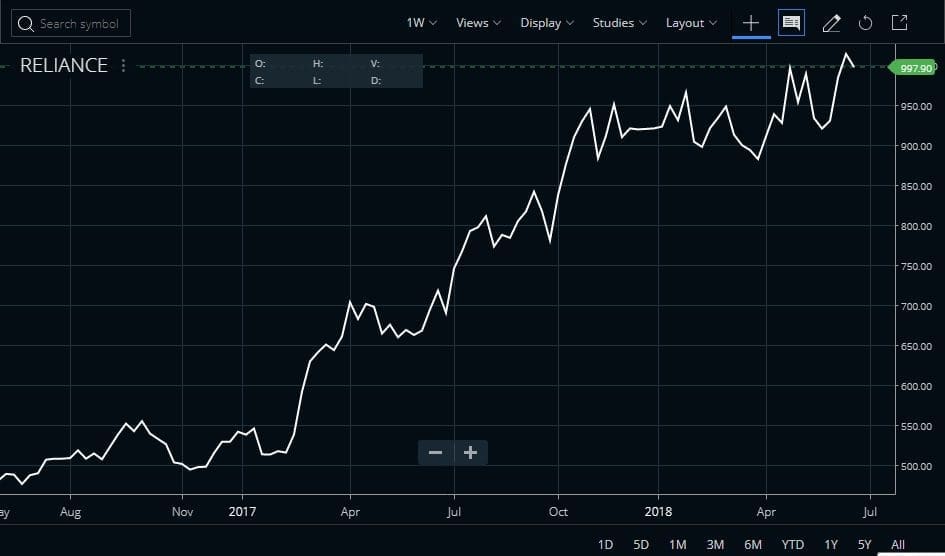
Line Chart Style
The line chart style is slightly different from the bar and candlestick pattern. In the above two patterns, we can identify opening, closing, high and low prices separately but in the line chart style, we connect a series of data together to form a line. Unlike the other pattern, it only represents the closing price over a set period of time, and doesn’t represent the visual information of the trading range. The advantage of the pattern is its simplicity, with a glance traders can get an overall view of the trend.
Hollow Candle
In normal candlestick when the candle is green or bullish, the close is higher than the previous close. A red candle defines a bearish trend where the close is lower than the prior close. Though colour is not a factor, you can change the colours according to your wish. Now come to the hollow candle, a candlestick is hollow (white) when the close is above the open, bullish trend and filled when the close is below the open, indicating a bearish trend.
Mountain Pattern
This chart appears like a mountain. It is a similar line pattern in that the area under the graph is shaded in colour. It doesn’t serve any additional purpose for the technical analysis. Like the line graph, it represents the closing price of a security. Mountain chart also refers to as area charts. The application of the style is useful for understanding fluctuation in prices more easily and prominent way. Financial newspapers also often use this specific pattern in their analytical report.
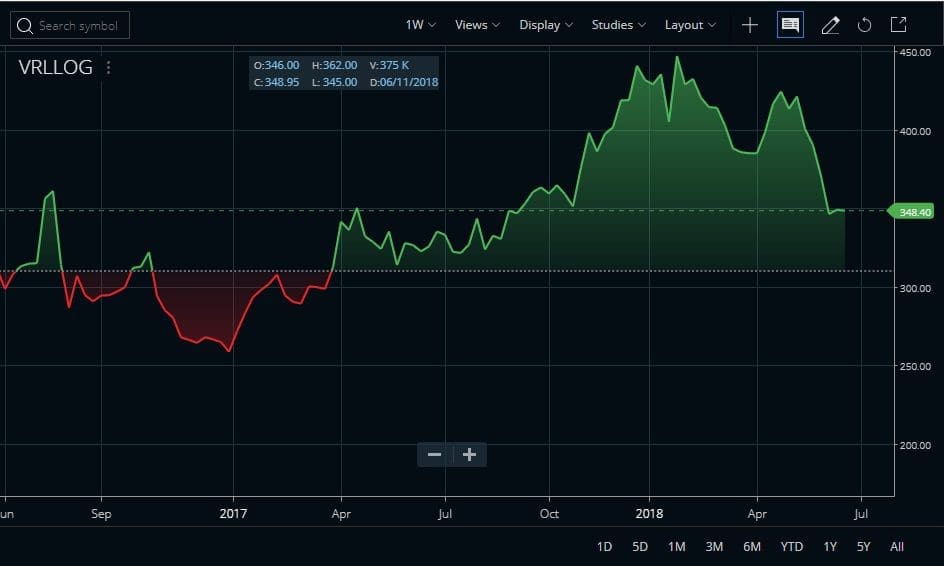
Baseline
This is one of the most useful chart styles to read price fluctuation properly. You can change the baseline according to your demand. Just drag the baseline level according to you to get an accurate view of price movements. It appears like a line chart with a baseline. Due to the addition of the baseline, the chart becomes more prominent.
Volume Candle
This candle is extremely useful in determining the strength of a trend. Increased volume defines the sustaining of the trend. Just like a normal candlestick chart it also has a filled or unfilled body with tails along with volume. This specific combination helps to study candlestick patterns in combination with their volume. Short candlestick indicates uncertainty while high volume indicates increased interest of the traders to exit or enter the position of any security. The trend might reverse.
These are some of the widely used different types of chart styles. By using these traders can analyze market movements and compare current price fluctuation with past data. The primary objective before technical analysis is familiar with all the above charts to understand the market properly.
How to Open Multiple Charts in Zerodha Kite 3.0 in a Single Window?
First of all, let’s get one thing clear only Kite users can access the multiple charts option and get the benefits. Only after login into Zerodha Kite by id and password, the account will be activated. After activation of the account users can get facilities, provided by Zerodha.
How to Find the Multiple Charts Option?
- First, you have to decide on which stocks or securities you need to work on.
- Select the securities and add them to the market watch window.
- After adding them, also open the Chart option
- On the up-right side of the Chart window, you will find Display.
- In the Display section, there are Multiple Charts.
For the understanding purpose, we are attaching an image below:

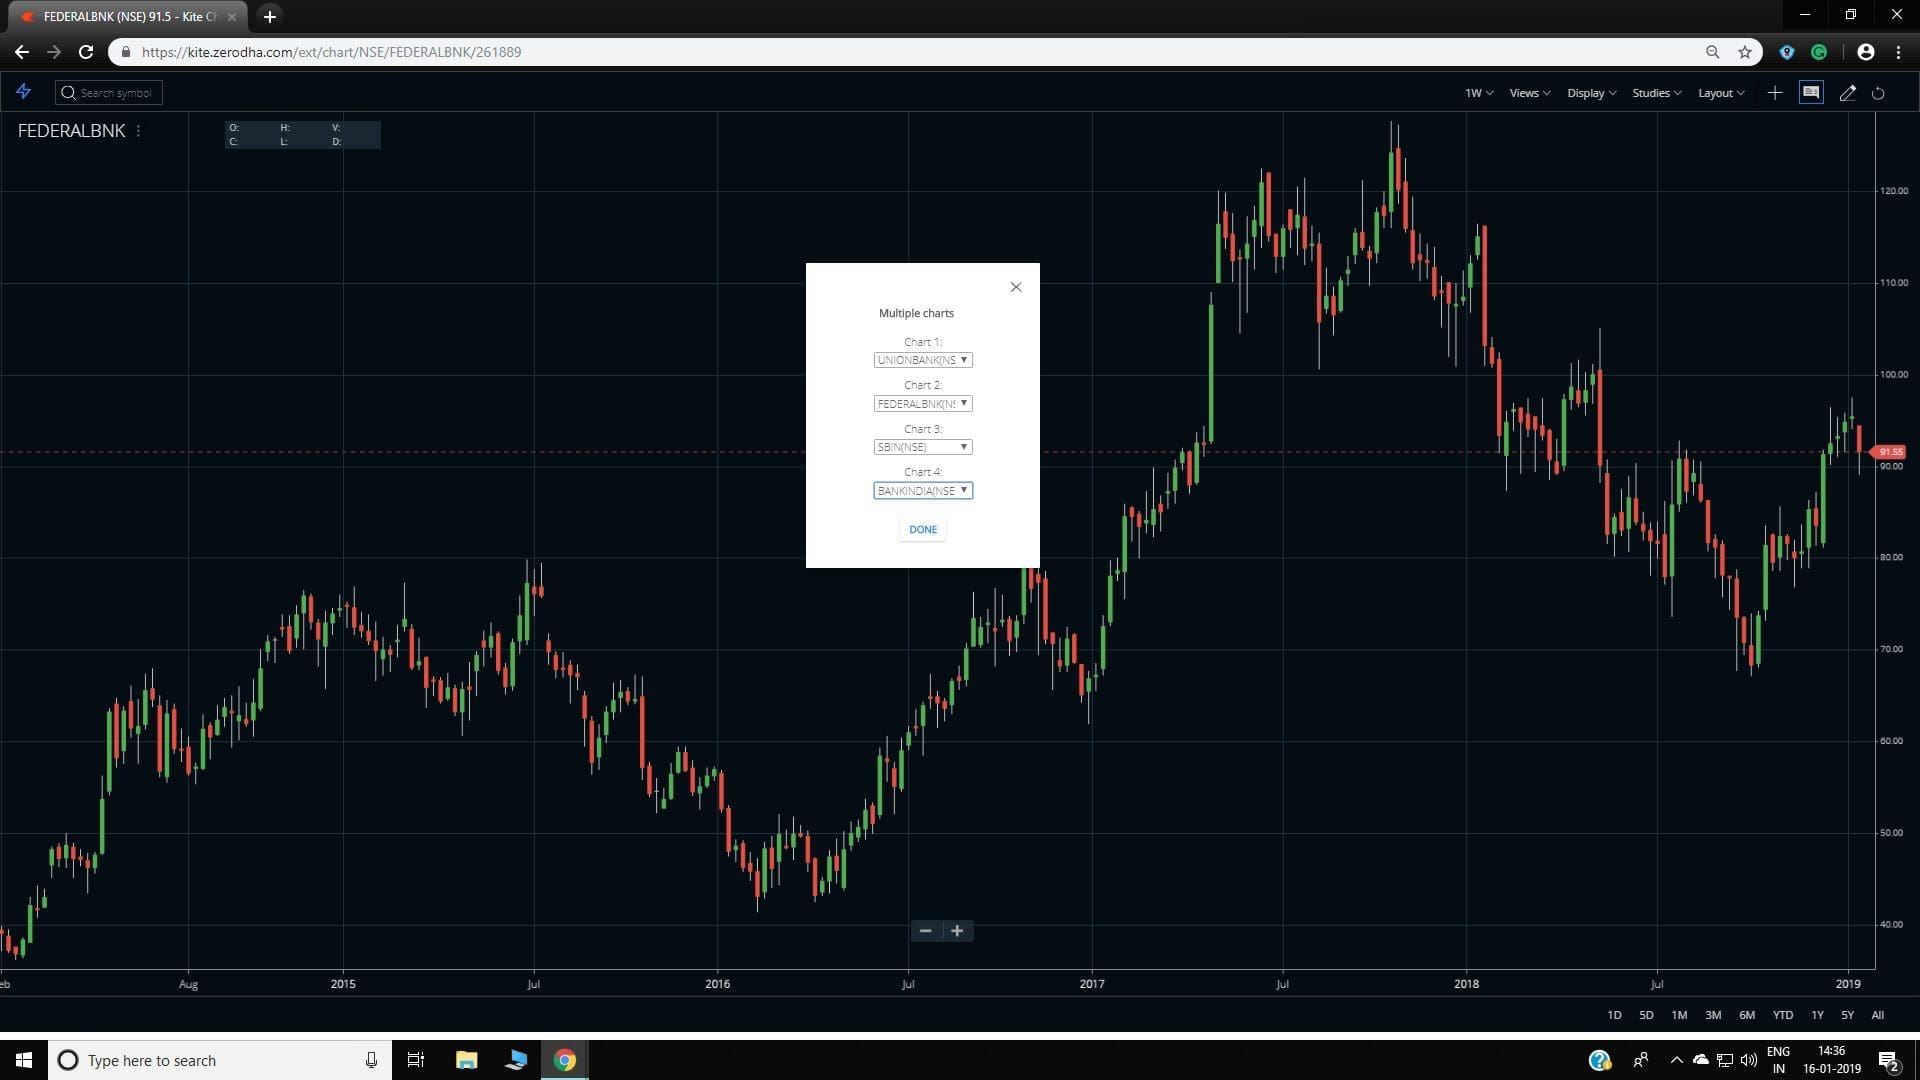
As you can see in the above attachment that there are two options under multiple charts, 2 Charts, and 4 Charts.
- When you click on the 2 charts options, it will open a small window.
- There you can get the chance to select two stocks on which you want to work on.
- Make sure you have already added the stocks to the market watch.

For example, here I added in Chart 1 Union Bank and in Chart 2 Federal Bank. After adding click on the Done button, and a new window will be opened with 2 charts.
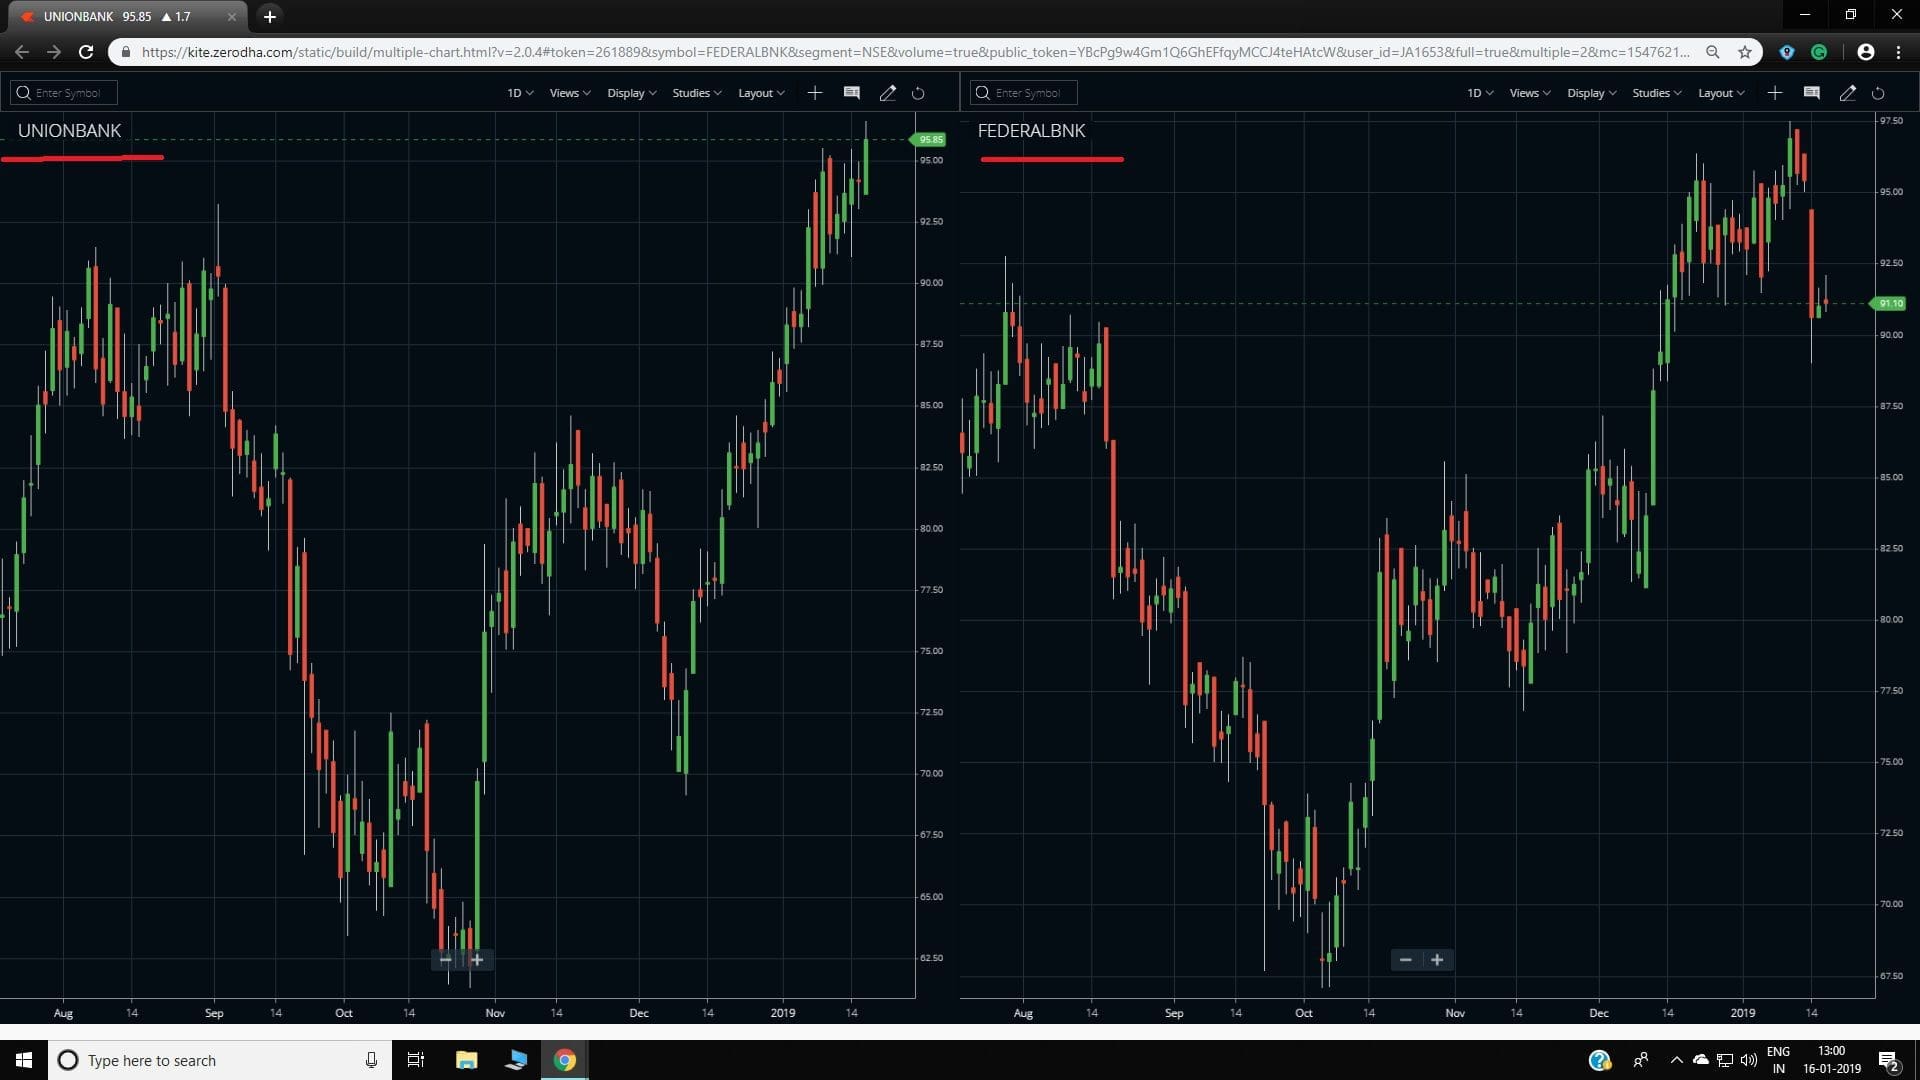
From the same window, users can change each chart’s settings separately.
In order to set 4 charts in a single window, users need to follow the same steps as 2 charts.

The process of setting the Multiple Charts in Zerodha Kite is quite easy. The facility is totally a useful concept.
Benefits of Using Multiple Charts in Zerodha Kite
- Traders can analyse a maximum of 4 securities in a single window.
- Less time consuming for monitoring the market.
- Intraday traders can get maximum benefits by using it.
- Users can easily compare 4 charts at a glance.
Recent Updates in Zerodha Kite on 2020
Zerodha has recently added some new features to its kite trading and charting platform. Among them, the best is now you need not open and close the charting platform for placing orders. Now you can place orders from the chart also. Moreover, you also need not place any price on it, just drop the order box on the chart and your price will be taken. Here, I will show how with live market examples, how you can do it so easily.
But before explaining the whole thing, let’s have a quick look at what new features Zerodha:
- Trading from the chart
- Candlestick patterns on the chart
- RSI divergence
- MACD divergence
- Stochastics divergence
- Stochastics RSI
- CPR or central pivot range
- Anchored VWAP
- Adding indicators over other indicators.
- New drawing tools and more.
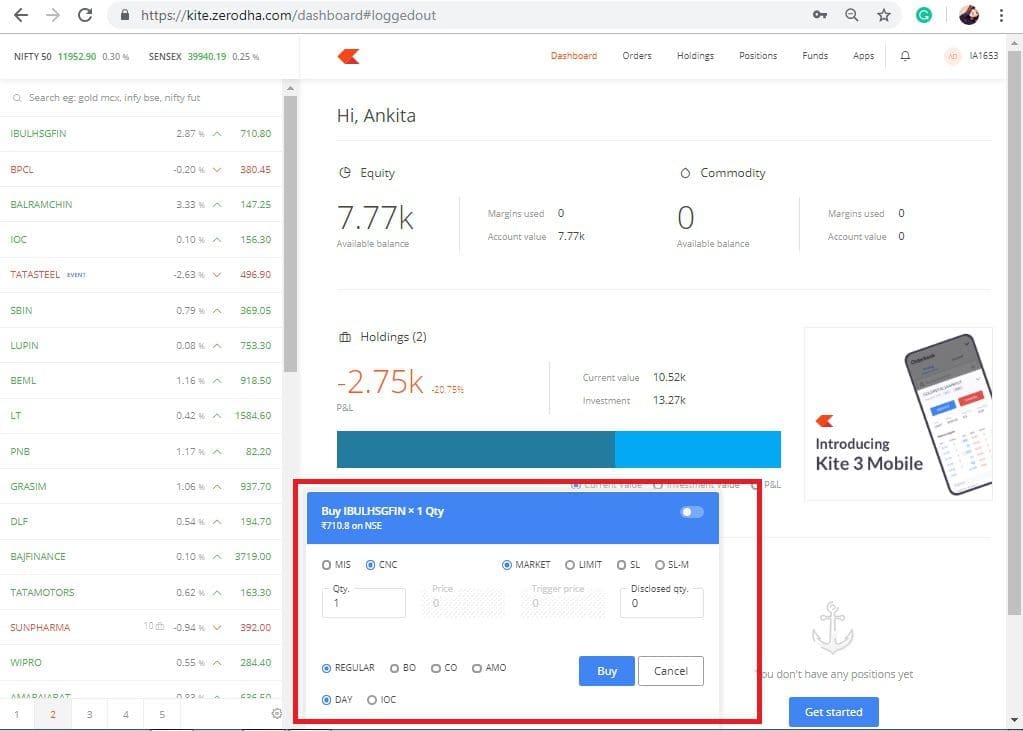
How to Trade Directly from the Chart?
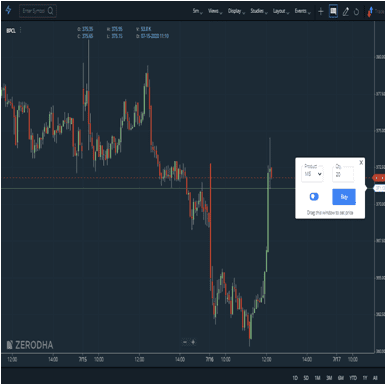
At the top-right corner of your chart, you can find a trade option. By clicking on the trade options, a buy-sell window will be opened. You can directly place a trade order from your chart.
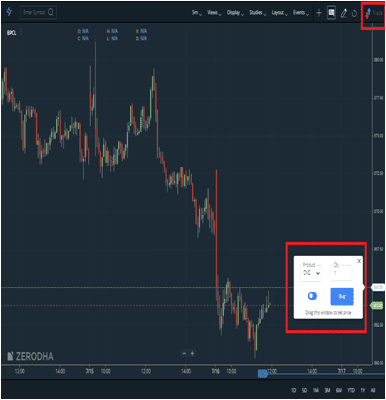
You can change the buy-sell order with just one click. Both CNC and MIS orders can be placed from the chart. You do not need to place the price of the stock. Just drag the box from where you want to buy or sell, and your price will be taken.
For example, I want to buy BPCL stock at a limit price of Rs.371.10. Now, the stock price is 371.80. So I drag the order box to Rs.371.10 and change the order type to MIS, put 20 quantities, and click on buy. Once the stock price reaches the level of Rs.371.10, the stock will be bought.
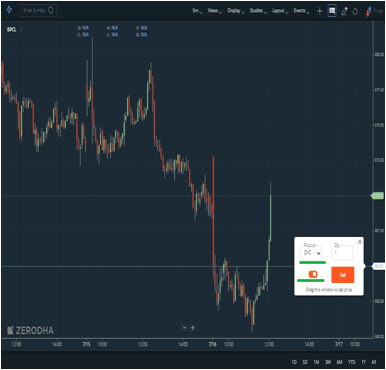
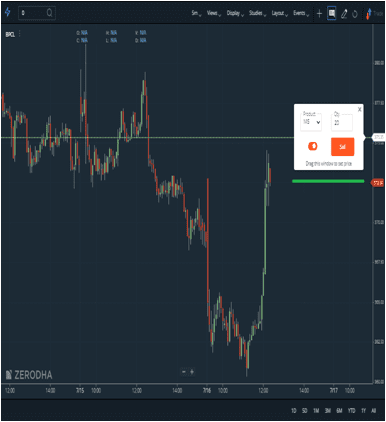
Now, after buying the stock, suppose you set a target at Rs. 375.35. On that level, you want to close your buy position. So drag the order window and set it there. Lastly, change your order type and quantity and click on sell. Your sell limit order will be set.
Benefits of Zerodha Updates
- During trading each second is important, you can save time by trading from the chart.
- The order-placing process becomes less complicated with Zerodha Kite. Smart trading access from the chart.
- No need to write down the price, just drag the order window and it will be automatically taken.
- Direct buy-sell order placement from the chart, can minimize the error-making probability.
- You can plot all open and executed orders on the chart.
More Features in Zerodha Kite 3.0
- Introduction of many new indicators
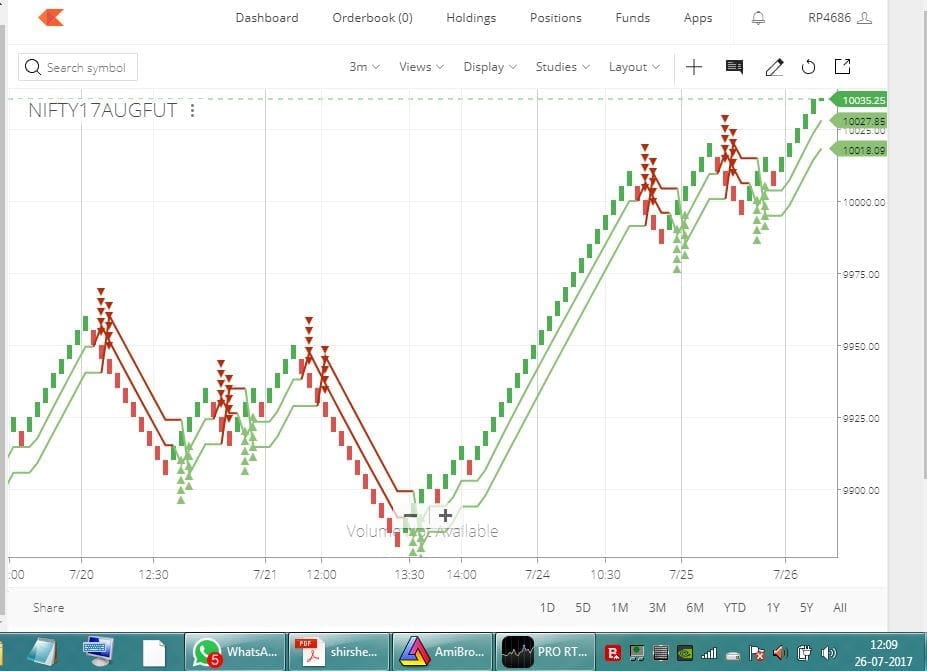
- Advanced SuperTrend indicator
- Ichimoku indicator
- Volume profile
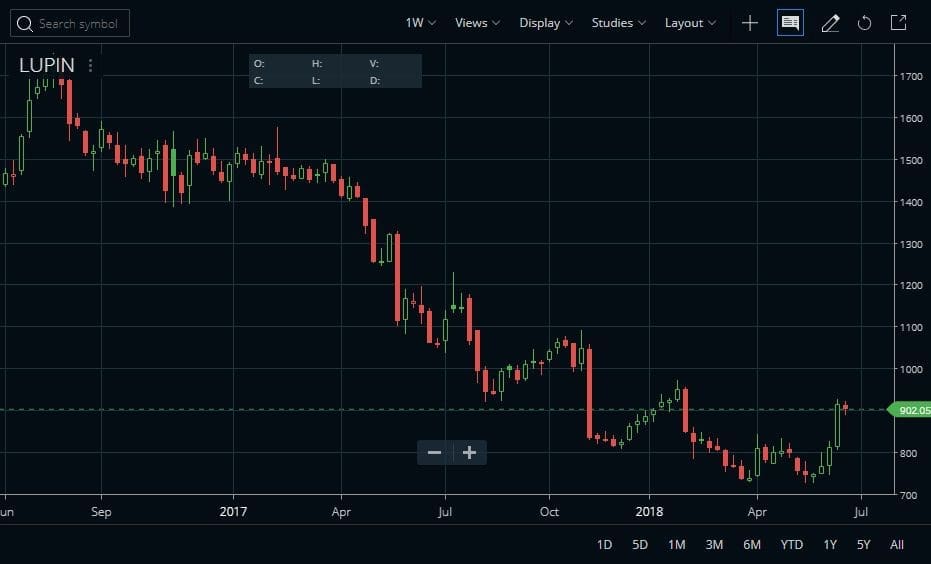
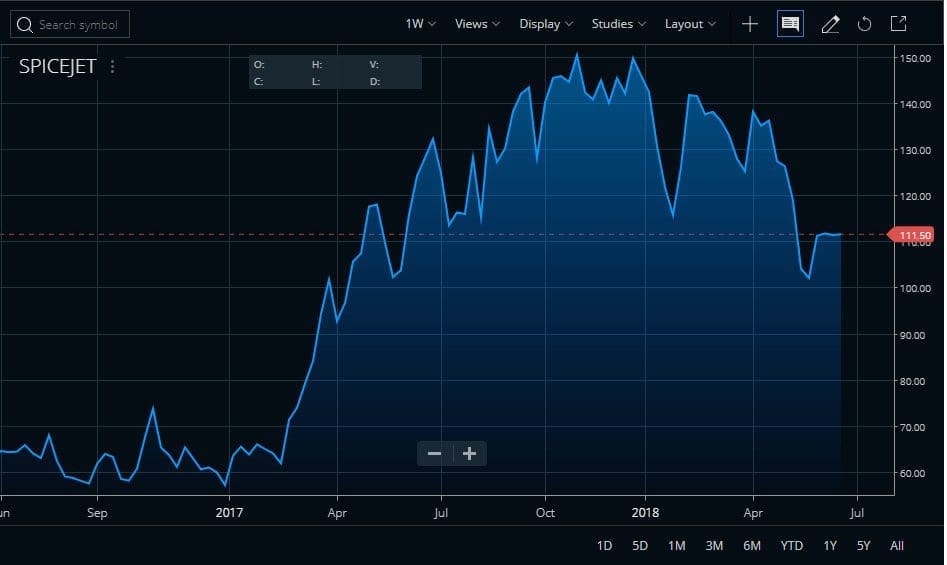
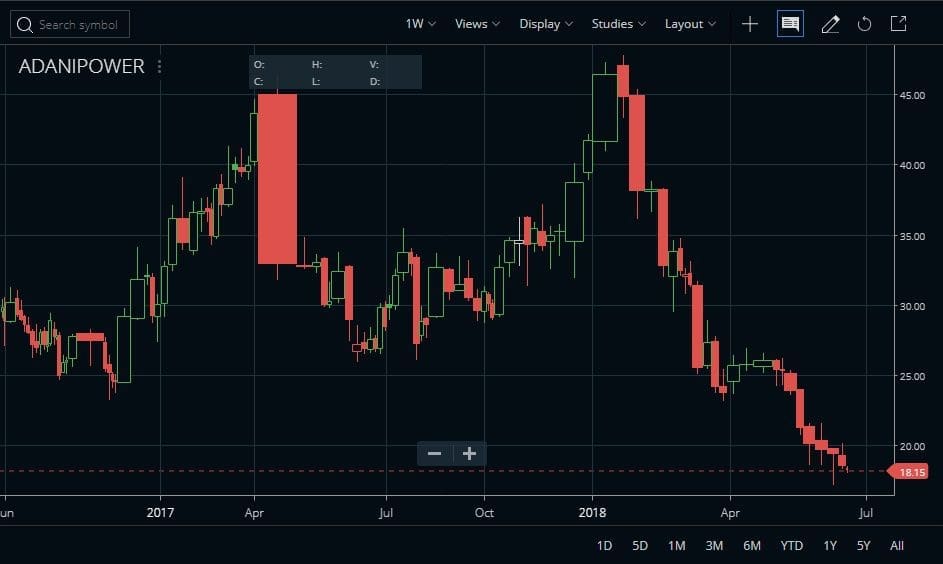
- Compare options between 2 stocks
- Kite connect option available for automated trading with Amibroker, Excel or Python
- Chart pop-up option available for using multiple charts at a time
How to Start Auto Trading with Zerodha Kite API?
Let us now discuss how one can start automated trading with the Kite platform of Zerodha.
- Zerodha Kite API: You can use Zerodha Kite API also known as Kite Connect (programmatic access to trading). Kite Connect is India’s first market API for retail clients. Kite Connect can be used by individuals, kite publishers (webmasters) and start-ups.
- Technical Knowhow: You can trade with your favourite programming language Python, Java, PHP, NodeJS, C#, .Net, etc using Zerodha’s exchange-approved HTTP/JSON APIs.
- Exchange approval: Clients do not need to take any approval from the exchange as Zerodha has already obtained all necessary permissions from the exchange.
- The cost involved: There can be some pre-fixed monthly expenses for using Zerodha Kite API.
API Documentation and Resources
Zerodha has published documentation for the Zerodha Kite API. You can access the documentation here There is also a forum for the users of the Zerodha Kite API. Visit the forum by clicking here.
There are few resources in Github for developers who want to use Zerodha Kite API. You can access the official Python client library for the Kite Connect trading APIs by clicking here. You can access the official Java client for communicating with Kite Connect API by clicking here.
Apart from the auto-trading usage of market data is also available using the Kite Connect API is possible for the developers. Still, the process is in a developmental stage. Zerodha is coming up with new features almost every day. We hope very soon the auto-trading and another programmatic usage of the Zerodha Kite API will take a proper shape.
FAQ
Kite is Zerodha’s HTML5-based trading terminal. The kite does not require any installation. You can simply open kite.zerodha.com in your web browser and access Kite.
No, Zerodha Kite does not require any installation. You can access Kite through a web browser.
Yes, Kite can be accessed from mobile phones. Zerodha Kite has an Android app and also an IOS app. In Windows Phone, Kite can be accessed through a web browser visiting kite.zerodha.com.
Zerodha Pi and Kite both are different platforms catering to different sets of people. Pi needs installation and hence requires a desktop or laptop, while Kite is lightweight can be accessed even from a tab or mobile phone and can be used on the go.
Yes, we can execute bracket and cover orders in the Kite platform. Yes, Zerodha Kite is completely free for Zerodha users. To access this platform, you need to simply open a trading and Demat account with Zerodha and once your account is activated you can access it. Yes, we can execute bracket and cover orders in the Kite platform.
Kite 3.0 Tutorial Resources on the Web
Website
First and foremost my main motto of creating this blog is to provide all handy information about Zerodha Kite. So please check back this website often if you are looking for the Zerodha Kite tutorial. You can also add this website to your favourites if you wish. You can also ask me any queries on Zerodha Kite by commenting below this post. I will try to help as much as possible.
YouTube
Next, you can also see my youtube channel as there also I upload videos frequently and many of my videos are on Zerodha Kite indicators and resources. To subscribe to my youtube channel please click here. You can also comment below the videos on my Youtube channel. I try to connect with my viewers there too.
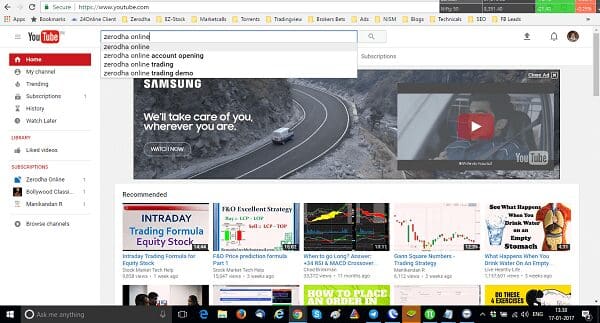
Zerodha Online
The next resource on the Zerodha Kite tutorial is the official ZERODHA ONLINE youtube channel. To visit the Zerodha Online youtube channel and search for “zerodha online” in the youtube search bar.
If you are interested to know more about Kite Connect then you should read the Kite Connect documentation first. It is the Zerodha Kite API for developers to trade on the kite from their favourite programs.
Zerodha Kite Login Issue
In order to run any software properly and in a genuine way, maintenance is required. Without maintenance, no software can go in a proper way. For Up-gradation purposes also client faces log-in issues sometimes. First of all, in order to use the best tools and technology, clients must consider these small things. Secondly, whether it is a machine or software, each and every mechanism needs a break for better service. In spite of the services, connectivity problems occur sometimes.
Major Technical Glitches
In Zerodha also, clients sometimes face login issues for the above reasons. At that moment, clients can’t log in to their Zerodha Demat account. Sometimes, trades also get cancelled. For example, on 7th Jan 2019, the Zerodha Kite was closed for a few hours in the morning. After putting the password, the page displays “request failed”. A screenshot of the Kite log-in interruption is given below:

How to Overcome the Zerodha Kite Login Issue?
Though the users get each and every update through messages and mail from Zerodha, every client must be acquainted with the solutions to these problems. Generally, there are two solutions to it.
- First of all, if the kite is not working out, you may access the Zerodha Pi. The users must be familiar with the Pi platform. It’s similar to the kite along with equipped and strong charting software, buy-sell signals, tools, etc. Users of Zerodha Kite may get FREE access to Zerodha Pi.
- Secondly, users can directly trade through the Zerodha broker over the call. For the execution of the trade, they must provide their ZPIN which they can get from the Zerodha back office.
Various other Trading Platforms of Zerodha
Zerodha Pi is a Windows-based software that needs installation. The download link of Zerodha Pi will be available in the trader’s back office only after his or her trading account is active. So for Zerodha Pi, a trader needs a Windows desktop/ laptop/tab.
On the other hand, Zerodha Kite does not require any installation. You can access Zerodha Kite from any web browser. Simply write kite.zerodha.com and you are on the Kite start page. So you can use Kite on any desktop, laptop, or tab where a web browser is available. We can use Zerodha Kite without any difficulty in Windows, Mac, IOS, Android, etc. Hence it is quite popular among traders who are on the go. You can use Zerodha Kite from your office too. Kite works well even on 2G data.
Conclusion
Overall Zerodha Kite 3.0 has a clear edge over other broker’s platforms in the point that it can be opened from any web browser and Android app OR IOS app. The charting and trading are possible even on 2G data, so even traders living in tier 2 cities can also start trading using this terminal.


usebale zeroda kite bracket order
What is that? CO is back in Zerodha already.
how can i save drawings on kite for next day
Let me check and reply you back.
Hello Indrajit, Can you name that volume profile indicator you are using with Zerodha charts?
It is a normal Volume Profile available in Zerodha Kite. You can also use