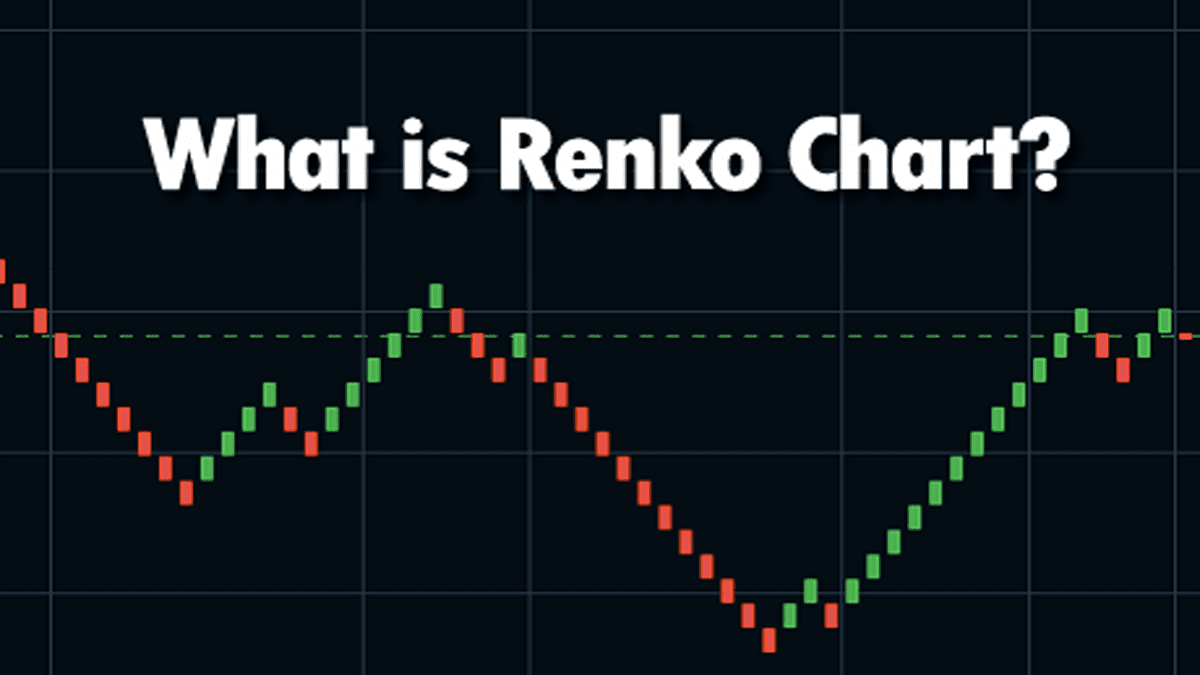
First, let us quote an excerpt from the book Sentiment Indicators by Abe Cofnas. Renko charts are a tool that represents price movements by using bricks. Renko is the Japanese word for brick. If a price moves higher by a certain amount, a new brick is added. We can select the colour; it is usually green or white. Similarly, if the price moves lower by a certain amount, a new block, whose colour is usually black or red, appears in the exact opposite direction.
What is Renko Charts?
The Renko charting concept has come from Japanese rice traders. It works on the concept of blocks. These rice traders whenever sold a bag of rice they used to keep a block or a brick on one side. And if they purchased a bag of rice they used to keep a block or brick on the other side. In this way, they used to maintain their profit or loss and inventory.
Features of Renko Charts
- Renko is a much noiseless charting system.
- Traders can also use this to analyze the price up move and down move.
- This charting technique works only on a single parameter – price blocks.
- Each and every candle is represented by a brick.
- Bricks are of equal size and we call them price blocks.
How to Identify Bullish or Bearish Sentiments?
As per the Abe Cofnas book, if the bullish sentiment is prevailing, the trader will be able to detect a bullish pattern even at the micro-level. Depending on the trading instrument, we will see that the micro-level of trading can be one minute or less. When using Renko charts, bullish sentiment is easily recognizable as a sequence of bullish (green or white) bricks. If bearish sentiment is prevailing, a descending series of bearish bricks, easily recognized by a black or red colour, will appear. Detecting a change in the persistence of sentiment is the key to getting out before profits disappear. Now, we have understood what is Renko Chart. Let us check it for an image example as shown below:
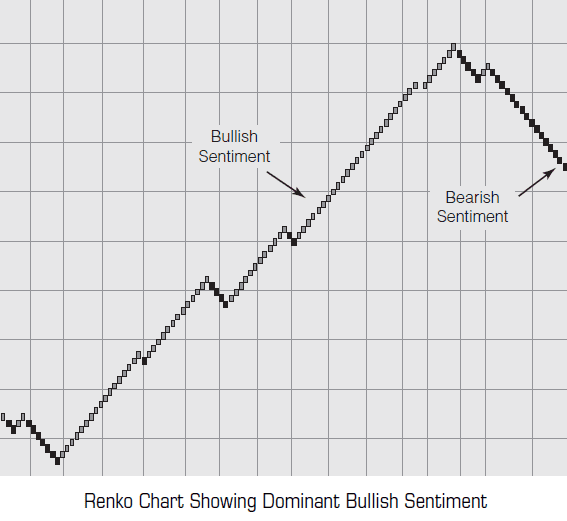
We can see in the image above, we have seen what is Renko Chart and the dominance of bullish sentiment. The bricks move upwards nearly uninterruptedly in an obvious bullish pattern. Now, let’s take a closer look. We can see that the bullish run-up has intermittent interruptions with bricks reversing down. The first reversal was a one-brick reversal, followed by a four-brick reversal, a two-brick reversal, and a one-brick reversal. Finally, we see a five-brick reversal.
How to Attach Renko Charts to your Stock or Index?
Traders can use the computational logic for constructing the bricks to create the Renko charts in most programs like Zerodha Kite. It follows the rules set forth in the book Beyond Candlesticks. To attach Renko to your favourite stock or index or commodity simply open the symbol in your Zerodha Kite and open its chart.


Now select Display and in the menu select Renko. See the image below:

This will attach the Renko to the symbol. There is also a settings option. Selecting this you can change the Range or Brick Size. By default, Kite will take a range as per the average true range (ATR) of the symbol, but using the settings option you can also select your desired brick size or range.

What is Whipsaw?
Whipsaw is a term that traders are always familiar with. What is a whipsaw? It is a volatile situation in the market when you are trapped on the wrong front. You sold and the market moved up and you bought and the market moved down. So, worldwide traders are trying to minimize whipsaws and create a nearly foolproof system. Do you know you can minimize whipsaws in Nifty trading using Renko Charts?
How to minimise Whipsaw with Renko Charts?
Renko candles are not normal-price candles. In fact, in Renko charts new candles are not formed with time. They form a specific movement of price. So as in normal candlestick, we see 1-minute charts, 5 minutes charts, hourly charts, etc we can set a price movement, suppose 10 points in Renko charts. That price movement is called the box size. So a 10-box size in Nifty Renko Charts means every 10 points of Nifty index movement we will get a new Renko candle. So Renko bars are not dependant on the time, rather they are dependant on the price movement.
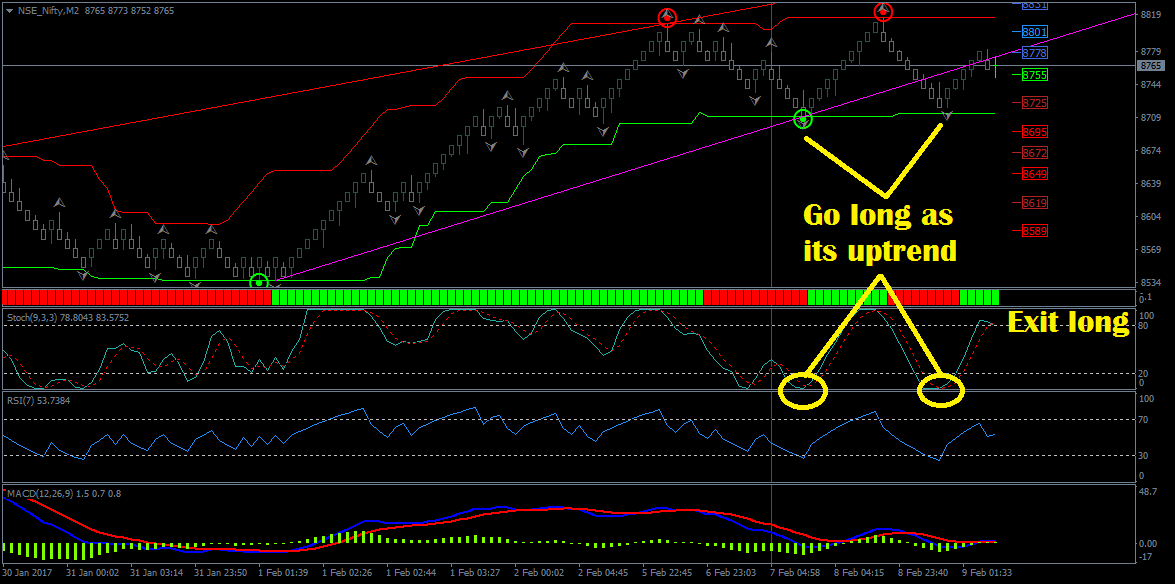
I use Nifty Renko Charts on the MetaTrader or MT4 platform, but you can use the Renko charts on Zerodha Pi or Kite platform also. I choose a box size of 10 on Nifty and attach a Donchian Channel indicator on the chart. Now you can see that Donchian Channel starts creating upside or downside steps with the price movement. Till we are getting upside steps, it is an uptrend, and I look for a long opportunity in the dip of secondary indicators like Stochastics. On the other hand, once we start getting downward steps it means that the uptrend is over and you can look forward to shorting opportunity on the rallies of Stochastics.
Video Tutorial
Check the video above where I explained this strategy on the Zerodha Kite platform. Do not use Renko candles for entry exit, rather use overbought-oversold indicators for entry-exit. Definitely, keep some protective stops and exit on the basis of stochastics moving to the other extent OR use a trailing stop loss method. I will love to hear your comments in this regard.
FAQ
Yes, Renko charts are a reliable form of charting that can be used to effectively identify trends and support and resistance levels. It is especially useful for traders who look for price patterns with technical analysis.
Yes, when correctly applied, trading based on Renko signals has the potential to generate profits in the Indian stock market. Make sure you understand all related risk factors before committing to using this charting method as your primary trading strategy.
Both chart types have advantages and are popular among traders in the Indian stock market. Some argue that candlesticks provide more detailed information but on the other hand, using a simpler visual approach may help keep emotions out of decisions so it depends on what suits you better as a trader when deciding which one to use from either or both methods.
Yes, many professional traders incorporate the renko charting system into their strategies due to its ability to quickly recognize uptrends and downtrends in prices providing them with clear indications of entry points for maximizing returns.
Conclusion
Renko charts provide a unique, simple way to analyze financial markets. They are especially helpful for trading without being affected by time frames and noise, as well as recognizing changes in market trends with greater clarity. Renko charts can help traders make more educated decisions about when to enter and exit trades. With the key benefits of simplicity and clarity, it is no wonder why so many experienced traders turn to renko charts when analyzing price movements in the financial markets.


Sir zirodha pi default D.channel 14 not 20,
Manju, if you watch my video, I have shown it on Kite.
yes thanks
Hi sir
Can I get trend blaster for free trail a week
Mannu you can contact us for trial HERE.
Good demo.Will it be the same settings in Pi charts?
Avinash, in Kite you cant use 2 minutes bars. Fo try 3 minutes bars here.
One advice pls refrain from making videos on trading, you dont even know what you are doing !!!
Next time before giving this kind advice please use a real name and a real email. 🙂