What is a Forex Dashboard?
A forex dashboard is a centralised trading interface that brings together live currency prices, technical indicators, market trends, and actionable signals in one place. Instead of switching between multiple tools, traders can monitor the entire forex market from a single screen and make faster, more informed decisions.
This Forex Dashboard on StockManiacs is designed specifically for traders who want clarity, speed, and precision. Whether you are tracking USD pairs, INR currency movements, or global forex trends, this page acts as your daily command centre.
It combines real-time forex rates, currency strength analysis, pivot levels, and trading signals into one streamlined view.
Live Forex Market Overview
The global forex market is the largest financial market in the world, with trillions of dollars traded every day. Currency prices change rapidly based on economic data, central bank policies, geopolitical events, and market sentiment.
A reliable forex dashboard helps you stay updated with:
- Live exchange rates for major currency pairs
- INR-based forex pairs for Indian traders
- Price movements and short-term trends
- Market volatility and momentum
Below is the live forex market section where you can track real-time prices.
| Pair | Price | Trend |
|---|
This section will display major pairs like EUR/USD, GBP/USD, and USD/JPY, along with INR pairs such as USD/INR and EUR/INR.
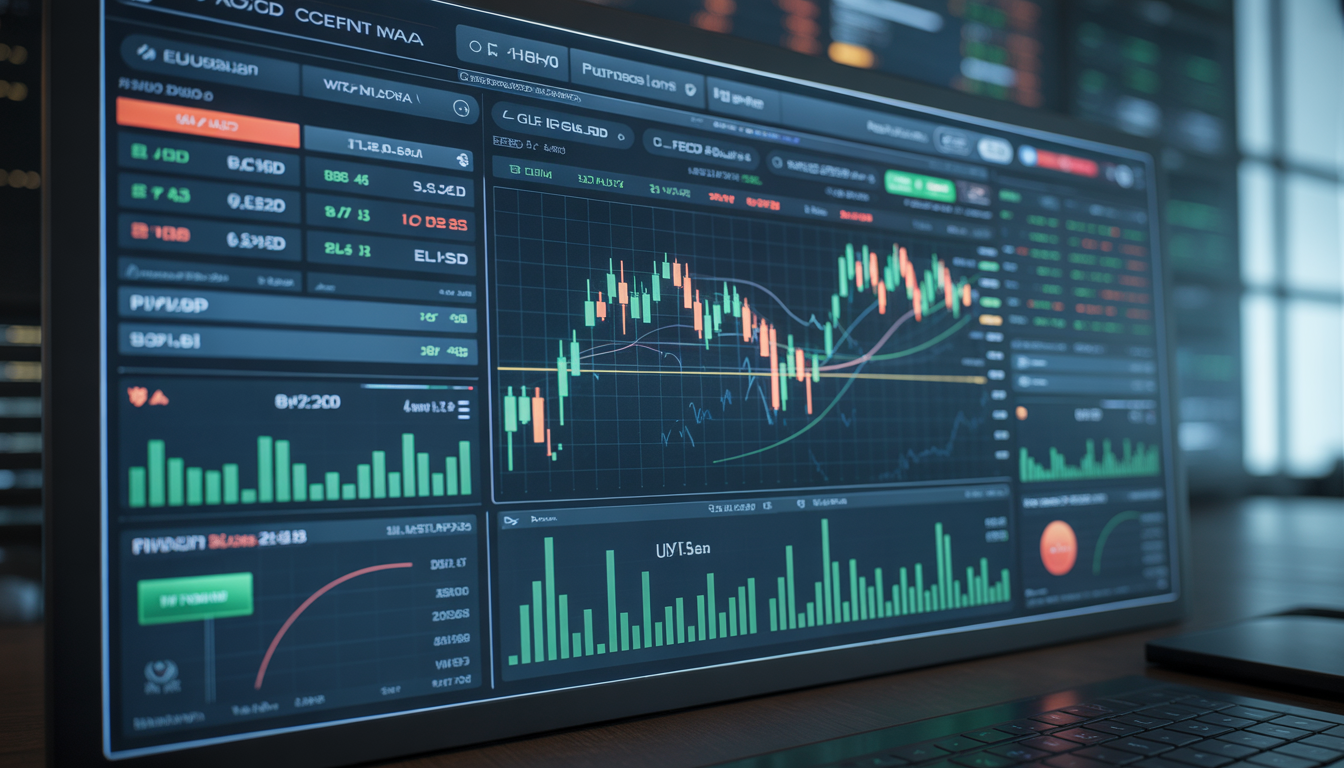
Live Forex Chart (Auto-Updating Price Action)
This interactive chart streams real-time price data directly from our market engine and updates automatically, helping you track momentum across major currency pairs without refreshing the page. Select any pair from the dropdown to visualise recent price movement and identify short-term trends, reversals, and consolidation zones.
Unlike static charts, this tool continuously processes fresh ticks and plots the latest closing prices on a smooth, responsive canvas. It is designed for traders who want a quick, distraction-free view of market direction before making decisions.
How to Use This Chart Effectively
Use the chart to understand short-term momentum. If the price is consistently making higher highs and higher lows, the market is trending upward. Conversely, a series of lower highs signals bearish pressure. Flat or sideways movement typically indicates a range-bound market.
Combine this chart with:
- Pivot levels for support and resistance
- RSI for overbought/oversold conditions
- Trend signals from the dashboard
This multi-layer approach gives you a clearer edge rather than relying on a single indicator.
Key Features of This Live Chart
- Real-time updates without manual refresh
- Lightweight and fast-loading for mobile and desktop
- Clean visual structure for quick analysis
- Supports multiple forex pairs from a single interface
This chart is ideal for quick intraday checks, confirmation of trade setups, and monitoring live price behaviour alongside your broader forex dashboard.
Forex Signals for Trading Decisions
Forex signals are one of the most important components of any dashboard. They help traders identify potential buying or selling opportunities based on technical analysis and market conditions.
This forex dashboard generates signals using a combination of:
- RSI (Relative Strength Index)
- EMA trends (short-term vs long-term)
- Price position relative to pivot levels
- Currency strength data
Instead of guessing the market direction, you get structured insights like:
- BUY (Bullish trend confirmed)
- SELL (Bearish trend confirmed)
- NEUTRAL (No clear direction)
Each signal will include reasoning and a strength score, helping traders understand why a trade is suggested.
Currency Strength Meter
Understanding which currency is strong and which is weak is a powerful way to trade forex. Instead of analysing pairs individually, professional traders often look at currency strength to identify the best opportunities.
For example:
- Strong USD + Weak EUR → Bearish EUR/USD
- Strong INR + Weak USD → Bearish USD/INR
This dashboard includes a dynamic currency strength model that ranks currencies based on their performance across multiple pairs.
The strength meter allows you to:
- Identify trending currencies
- Avoid weak setups
- Trade high-probability pairs
Forex Heatmap for Market Visualisation
A forex heatmap provides a visual representation of currency performance. It helps traders quickly understand which currencies are gaining or losing value.
Instead of reading numbers, you see:
- Green zones → strong currencies
- Red zones → weak currencies
- Neutral zones → sideways movement
This is especially useful for:


- Intraday traders
- Momentum traders
- Trend-following strategies
Daily Pivot Levels
Pivot levels are widely used by professional traders to identify key support and resistance zones. These levels are calculated using the previous day’s high, low, and close.
They help answer critical questions like:
- Where is the market likely to reverse?
- Where can the price break out?
- What are the key support and resistance levels today?
This forex dashboard calculates accurate daily pivot levels based on proper OHLC data.
You will see:
- Pivot Point
- Resistance levels (R1, R2, R3)
- Support levels (S1, S2, S3)
These levels remain constant throughout the trading day and are essential for intraday strategies.
Technical Indicators Overview
Technical analysis plays a crucial role in forex trading. This dashboard integrates key indicators to help you evaluate market conditions quickly.
Included indicators:
- RSI for overbought/oversold conditions
- EMA20 and EMA50 for trend direction
- Trend classification (UP / DOWN)
These indicators help you:
- Confirm trends
- Avoid false signals
- Improve entry and exit timing
INR Forex Trading Focus
For Indian traders, INR-based currency pairs are extremely important. Movements in USD/INR and EUR/INR are influenced by:
- RBI policy decisions
- Crude oil prices
- Inflation and interest rates
- Global dollar strength
This forex dashboard gives special attention to INR pairs so you can track:
- USD/INR trends
- INR strength vs global currencies
- Key levels for trading decisions
Why Use This Forex Dashboard?
This dashboard is built with traders in mind. Instead of cluttered charts and disconnected tools, it provides a clean and actionable interface.
Key advantages:
- Real-time forex data
- Structured trading signals
- Accurate pivot levels
- Currency strength insights
- Visual heatmap analysis
- INR-focused tracking
Whether you are a beginner or an experienced trader, this dashboard helps you make better decisions with less noise.
How to Use This Dashboard Effectively
To get the most out of this forex dashboard, follow a simple workflow:
- Check currency strength to identify strong vs weak currencies
- Look at signals to confirm trade direction
- Use pivot levels to find entry and exit zones
- Validate with technical indicators
- Monitor live price movements
This structured approach helps you trade with discipline instead of emotions.
Who Should Use This Forex Dashboard?
This page is designed for:
- Intraday forex traders
- Swing traders
- INR currency traders
- Technical analysts
- Beginners looking for structured insights
If you trade forex regularly, this dashboard can become your daily starting point.
Final Thoughts
The forex market moves fast, and having the right tools makes all the difference. This Forex Dashboard combines multiple layers of analysis into one powerful interface.
Instead of relying on scattered information, you get:
- Live market data
- Trading signals
- Strength analysis
- Key levels
All in one place.
As you continue to use this dashboard, you will start identifying patterns, improving your timing, and making more confident trading decisions.