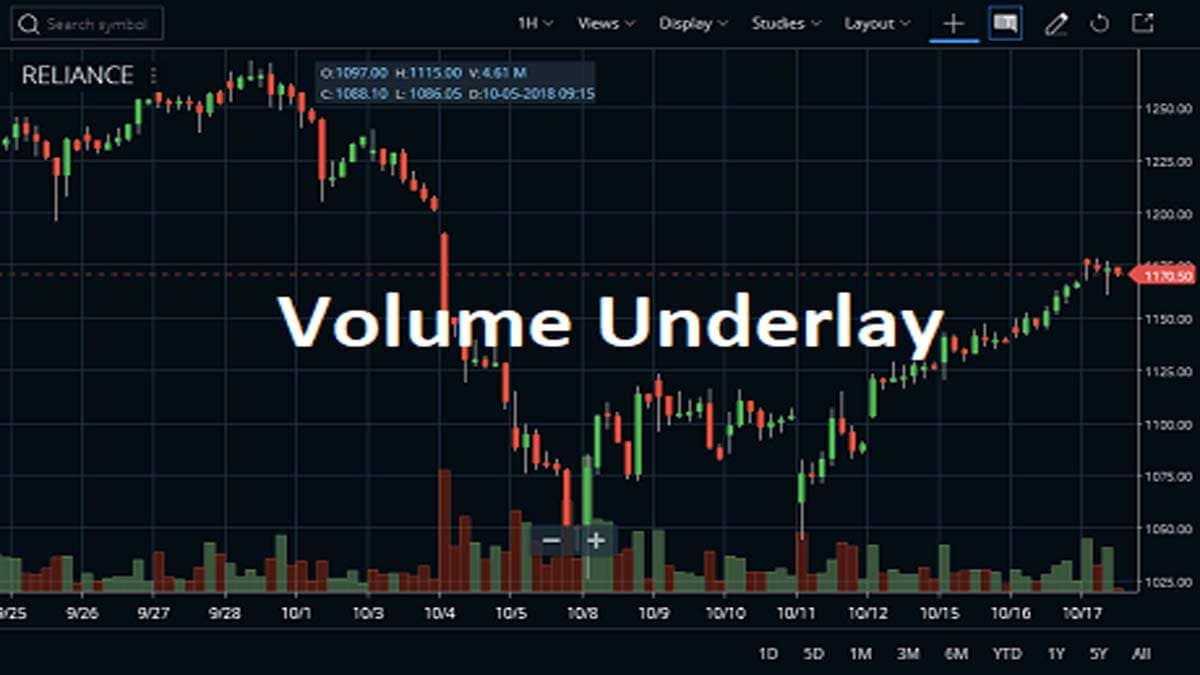
The Volume Underlay indicator mainly shows the total volume as a bar chart beneath each of the chart’s periods. Unlike all other indicators that display in a sub-window, the Volume Underlay indicator displays within the actual chart. Before stepping into the main discussion regarding the specific indicator let’s just have a quick idea about the volume.
What is Volume?
During a particular period of time, the total number of transacted shares is represented by the Volume. Buying and selling of a share are considered as one transaction. For example, if in a day, ten transactions happen, then the volume of the day is ten.
The volume as an Indicator
The volume plays a significant role as an indicator. In technical analysis, the volume helps to find out the relative worth in a market. Generally, the higher the volume, the higher the market movement. Sometimes, divergence may occur between price and volume, in that case, market trend reversal happens.
FAQ
As we know that traders use volume in their charts to quantify trading activity in the market. The volume underlay is basically a volume bar chart. This chart can be placed beneath each asset’s price section. In other words, it displays in a sub-window, within the actual chart. Technical analysts use this to analyze the market buy-sell performance.
We know that volume is the number of contracts, shares, or any other financial assets that change hands over a certain time period. Generally, buying volume is the number of contracts that exchange at the ask or offer price. Oppositely, selling volume is the number of contract exchanges at the bid price.
Volume analysis is an important concept of technical analysis. This is the analysis of the number of traded shares or contracts of security in a specific period of time. By analyzing it, investors can determine the importance of changes in an asset’s price.
There are two types of volume bars in the Volume underlying chart, red and green. These two colors represent two different moods of the market. Basically, a green volume bar represents buyers’ demand while a red bar is the sellers’ demand. There are other analyses of these two bars also. We will describe them later.
By analyzing the volume, we can extract a lot of details. A high volume in any stock is appropriate for short-term or intraday trading. So generally, good tradable stocks have high volume. Oppositely, low volume indicates there is less number of stocks traded in exchange.
How to Attach the Volume Underlay Indicator on Charts?
On Zerodha Kite
If the traders want to attach the Volume Underlay indicator, they need to open the STUDIES section of Zerodha Kite. The traders are also visiting in Kite Mobile App. The Up Volume color is green and the Down Volume color is brown. If you want to change these colors then you can change them. The traders can also check the attaching process of the Volume Underlay indicator to the Reliance Industries share price chart. Traders can use this indicator on daily, weekly, monthly, or intraday charts.







On Upstox Pro
In order to clarify the topic in more detail, we’ve decided to provide examples of the Volume Underlay Indicator from different trading platforms. Here, a chart, derived from Upstox Pro is attached below:
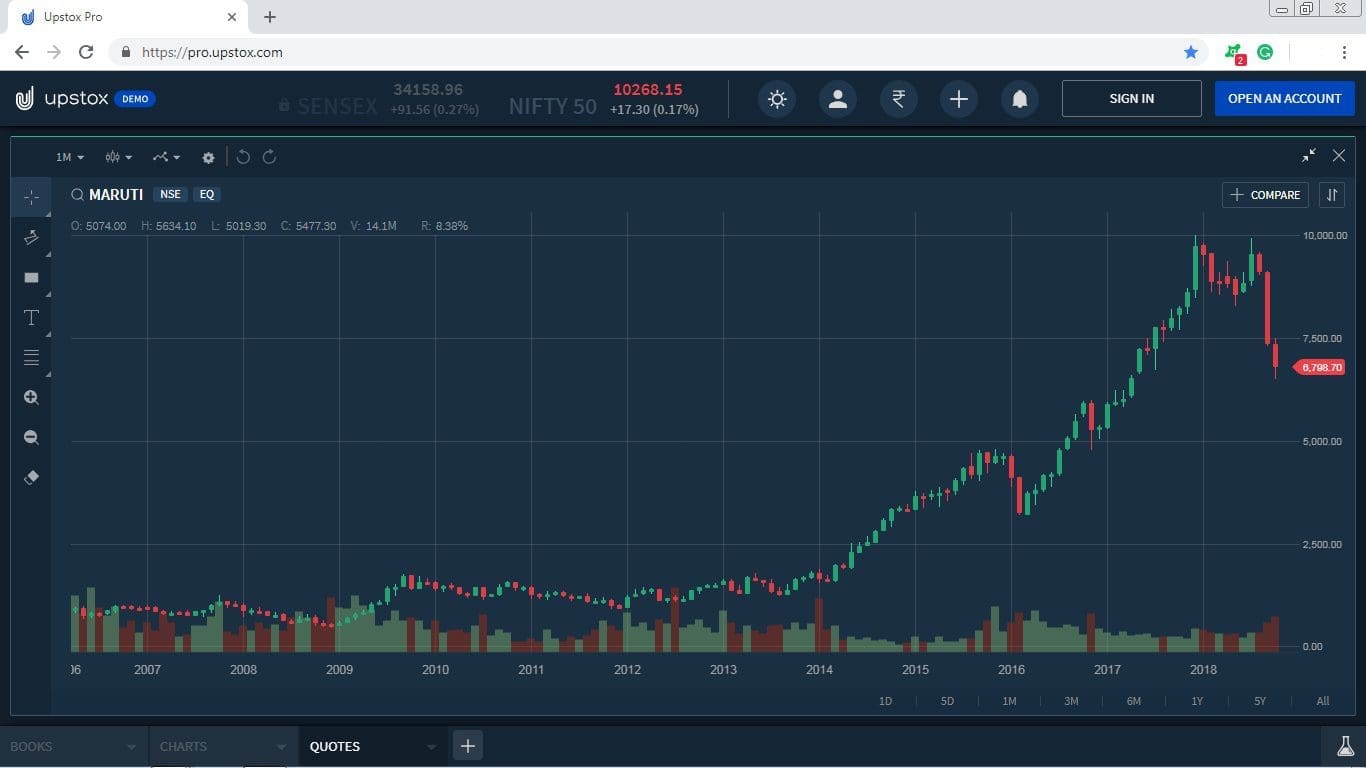
On this chart, have a look at the volume. There the red-colored volume represents the down volume while the green one represents the up volume. The volume underlay indicator is equal to the total volume during trading.
On TradingView
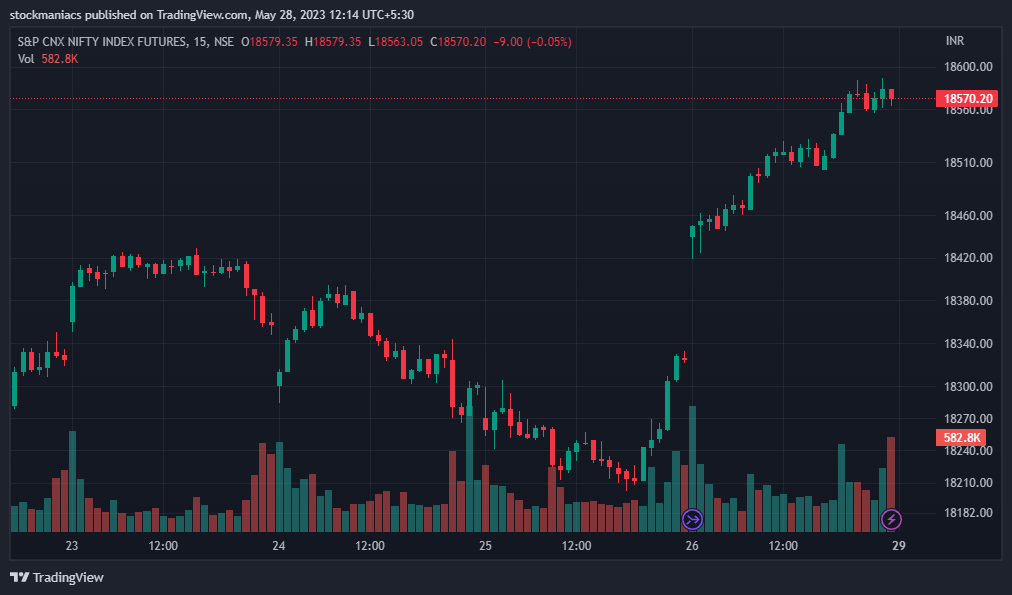
In the TradingView charting platform, volume is a free indicator. That means you can use it for free. In TradingView free plan you can use at most 3 indicators on any chart. But if you use the volume in your chart it will not be counted in this list of three indicators. Therefore, it is a free-to-use indicator.
Features of the Volume Underlay Indicator
- When prices are rising, the volume should also be rising. This indicates that more bulls are entering the market and market momentum is strong.
- When prices are falling, the converse is not exactly true. Volume can be falling or steady. Typically, market participants are less active in bear markets.
- Volume can confirm or deny a reversal or breakout condition. If the market registers a one-day reversal on high volume, a change in market trend is likely.
How to Trade with the Volume Underlay Indicator?
Reversal Pattern
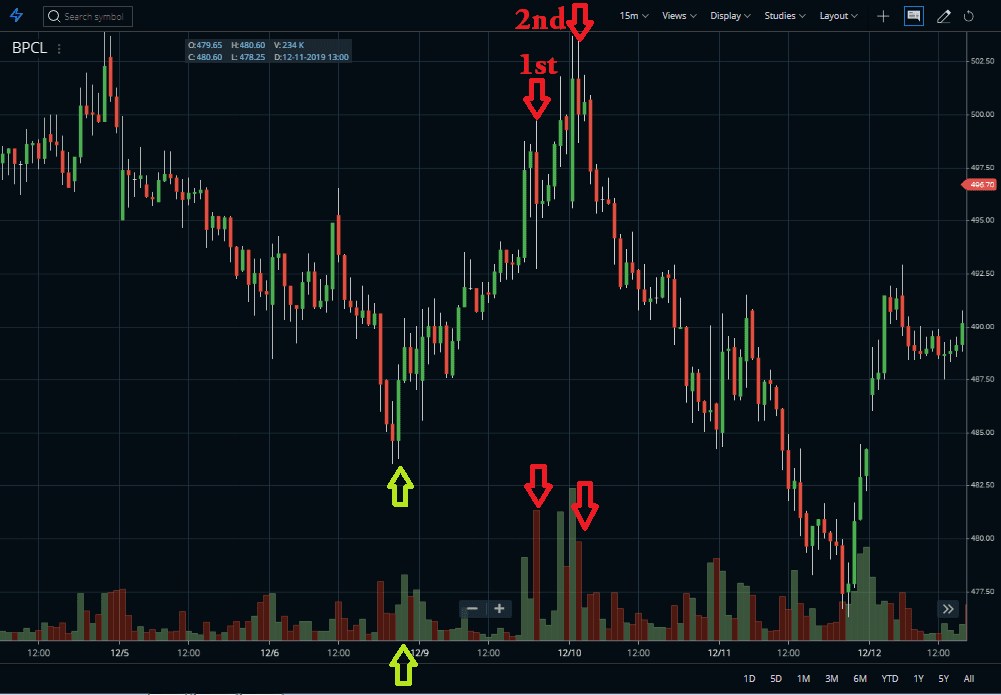
Look at the chart below, thereafter a prolonged downtrend, a long bullish candle along with a breakthrough volume bar appear. I took a buy from that position. Then look, the market gave 2 chances to exit from the trade with long bearish bars. This is a 15 min BPCL chart.
Breakout Pattern
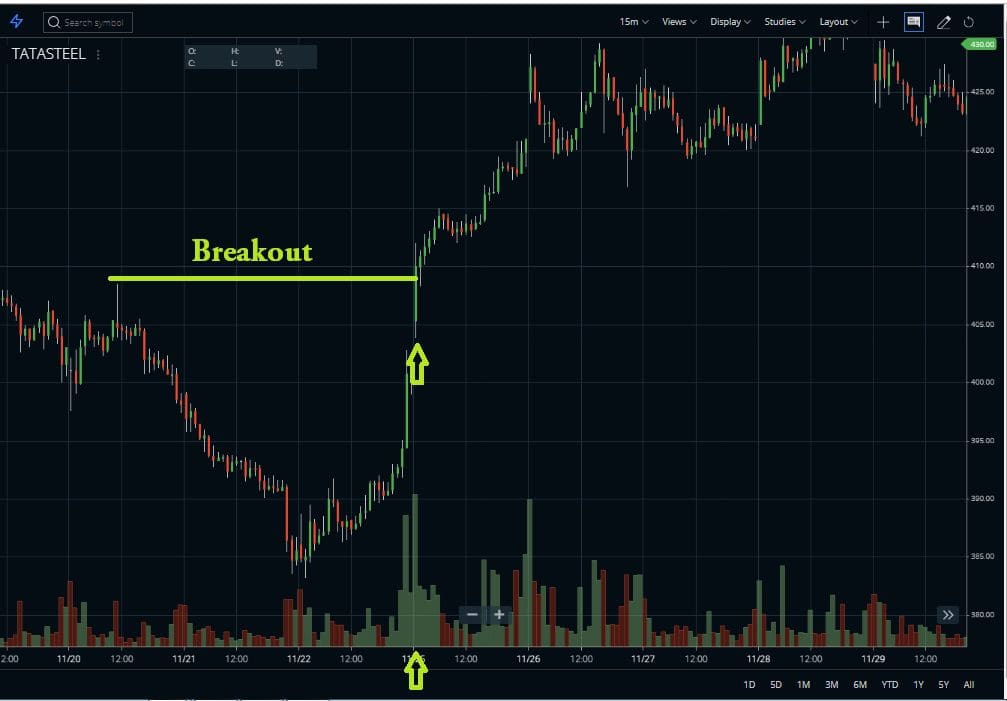
The next strategy I am going to explain is the breakout strategy. Here, I have taken TATASTEEL 15-minute chart. As you can see in the picture below, with a big volume bar, a bullish candle appears and break the previous range. With the breakout, a reverse of past patterns happen and the price moved upwards.
Volume Spike
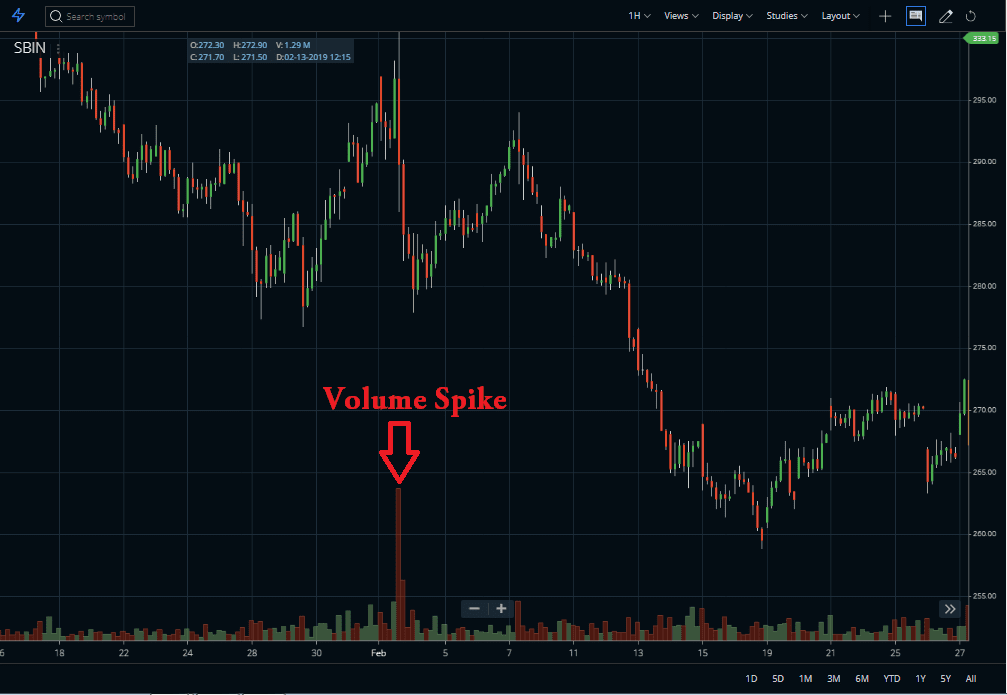
The example below is accurate for showing a spike. An unusually large volume graphed on a bar chart consider a spike. In order to locate volume spikes, one needs to compare a single day’s volume to its average volume. So, suppose one day’s volume is two, three, or more than three times the average volume, it is considered a spike. Unusual large volume often foreshadows a major change in the current price trend. As you can see in the picture below that with the volume spike, the market moved long term downward direction.
Conclusion
In conclusion, volume is simply the number of shares, contracts, or units changing hands in a given period (day, week, hour). It is reported in real-time (or delayed) with each trade. Markets that do not have trade-by-trade reported volume substitute daily summary data or trade count data. Trending markets should be accompanied by rising volume. Similarly, exhausted markets are usually accompanied by falling volume or unusually high volume spikes.