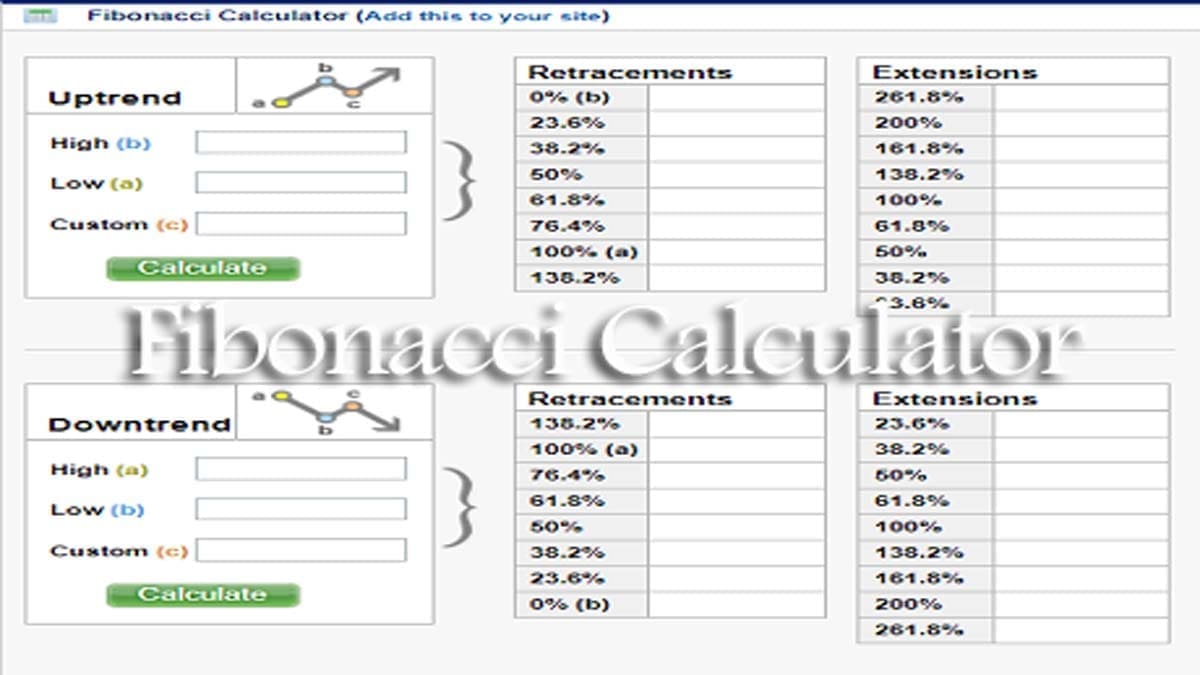
Just input the last swing high, low and close value in the Fibonacci Calculator below to the retracements and extension levels. Mobile users need to scroll horizontally to see the full Fibonacci Calculator below.
What is Fibonacci Retracement?
Fibonacci Retracement is a leading indicator that traders use to predict the future price movement of a stock, index, commodity or currency pair. Traders can use this indicator in different trading markets such as stocks, ETFs, futures, commodities and forex. Well, what is Fibonacci and how does it work?
Fibonacci Retracement was discovered by Leonardo Fibonacci in the 12th century. Leonardo realised a proportion in the building blocks of nature. The Golden Rule, as it’s called, is the proportion of things in the larger picture. Fibonacci Retracement says that out of a larger movement, the price will retrace a certain percentage of that larger move before continuing in the original direction. The mean for those percentages is 61.8%. This number is the Golden Rule.
The proportion Leonardo figured out was that 61.8% of the distance between your head and your feet is your belly button. Your elbow rests at the 61% proportion of your total arm distance. In a beehive, the bees consist of 61% males to females. The list goes on and on. How can we use this to trade? We can use it in trading markets because these same proportions exist there as well.
How to Use the Fibonacci Calculator
This Fibonacci calculator helps traders find potential support, resistance, and profit target levels based on Fibonacci retracement and extension ratios. Follow the steps below.
Example – Uptrend Calculation
Assume a stock moved from a low of 9000 to a high of 10000 and then started pulling back.
Enter:
- High (b): 10000
- Low (a): 9000
- Custom (c): 9500
After clicking Calculate, the retracement levels show possible support zones where the price may bounce:
- 23.6% → 9764
- 38.2% → 9618
- 50% → 9500
- 61.8% → 9382
- 76.4% → 9236
If the price resumes the uptrend, Fibonacci extension levels show potential upside targets:
- 23.6% → 10236
- 38.2% → 10382
- 50% → 10500
- 61.8% → 10618
- 100% → 11000
- 138.2% → 11382
- 161.8% → 11618
- 200% → 12000
- 261.8% → 12618
Example – Downtrend Calculation
If the market falls from 10000 to 9000, traders look for Fibonacci retracement resistance levels where the price may face selling pressure:
- 23.6% → 9236
- 38.2% → 9382
- 50% → 9500
- 61.8% → 9618
- 76.4% → 9764
If the downtrend continues, Fibonacci extensions help identify potential downside targets:
- 23.6% → 8764
- 38.2% → 8618
- 50% → 8500
- 61.8% → 8382
- 100% → 8000
- 138.2% → 7618
- 161.8% → 7382
- 200% → 7000
- 261.8% → 6382
Traders often combine Fibonacci levels with price action, support and resistance, and volume indicators to make better trading decisions.


The Goal of the Fibonacci Calculator
The goal is to find a large movement. Large means a definite high and low point. You can use Fibonacci almost as well on smaller chart time frames. We only say almost because the larger the time frame, the more reliable most signals and strategies are.
So, here we have found our high and low points. Then we will need to high and low values in the calculator. Say our movement is upward, so put the low in the first point and the high in the second point. It will now automatically calculate the points at 50% retracement. This is 50% of the larger movement. 50% retracement means that if the price retraces back to that line, it has retraced 50%. There are other points and proportions calculated automatically as well; 38.2%, 61.8%, 78.6%, and retracements. There are several other retracement percentages, but these are the ones that are predominantly utilised in trading.
Frequently Asked Questions
A Fibonacci calculator is a trading tool that calculates important Fibonacci retracement and extension levels based on a swing high and swing low. Traders use these levels to identify potential support, resistance, and price targets in stocks, forex, and cryptocurrencies.
To use a Fibonacci calculator online, simply enter the swing high and swing low of a price move. The tool will automatically calculate Fibonacci retracement levels such as 23.6%, 38.2%, 50%, and 61.8%, along with extension targets used for profit-taking.
The Fibonacci retracement formula is calculated by taking the difference between the swing high and swing low and multiplying it by Fibonacci ratios like 23.6%, 38.2%, 50%, and 61.8%. These values are then added or subtracted from the price range to determine potential reversal levels.
Yes. A Fibonacci calculator can also be built in Excel using simple formulas that apply Fibonacci ratios to a price range. However, an online Fibonacci calculator like this one automatically performs the calculations instantly, making it easier for traders to use during live market analysis.
Fibonacci levels are widely used in technical analysis because markets often retrace a predictable portion of a previous move before continuing the trend. These levels help traders identify potential entry points, stop-loss zones, and profit targets.
Trader Tips for Using Fibonacci Levels
- Combine Fibonacci with support and resistance: Fibonacci levels become stronger when they align with previous support or resistance zones.
- Watch the 61.8% level carefully: The 61.8% retracement is often called the “Golden Ratio” and is one of the most important levels in trading.
- Use Fibonacci extensions for targets: Levels such as 138.2%, 161.8%, and 200% are commonly used to estimate profit targets during strong trends.
- Confirm with price action: Candlestick patterns and volume confirmation can improve the reliability of Fibonacci signals.
- Use multiple timeframes: Drawing Fibonacci levels on higher timeframes, like daily or weekly charts, can reveal stronger support and resistance areas.
Conclusion
The Fibonacci Calculator is a practical tool for identifying potential support, resistance, and target levels in both uptrends and downtrends. By simply entering the swing high and swing low, traders can quickly generate important Fibonacci retracement and extension levels used by professionals across financial markets.
While Fibonacci levels are powerful for spotting possible reversal or continuation zones, they work best when combined with other technical analysis tools such as trendlines, moving averages, and volume indicators. Using these levels as part of a broader trading strategy can help traders make more informed decisions and manage risk more effectively.
Check Our Other Trading & Investment Tools
- Gann Square of 9 Calculator – Forecast support, resistance, and price targets using the famous Gann methodology.
- Nifty Trend Finder Calculator – Identify the current Nifty market trend using technical indicators and price action.
- Pivot Point Calculator – Calculate pivot levels, support, and resistance for intraday trading.
- Camarilla Calculator – Generate precise intraday support and resistance levels using Camarilla formulas.
- Elliott Wave Calculator – Analyse wave structures and potential market movement patterns.
- Volatility Calculator – Measure market volatility and assess trading risk effectively.
- Mutual Fund Return Calculator – Estimate SIP and lump sum mutual fund investment returns easily.
- LIC Maturity Calculator – Calculate the estimated maturity value for LIC insurance policies.
- LIC Surrender Value Calculator – Estimate the surrender value of your LIC policy quickly.