
A trend signal is formed when a short-term moving average crosses a long-term moving average above or below a chart pattern. We know this as the moving average golden cross and death cross. So the uptrend or bullish pattern formed through a short-term moving average (such as the 50-day moving average) breaking above its long-term moving average (such as the 200-day moving average) is known as the golden cross.
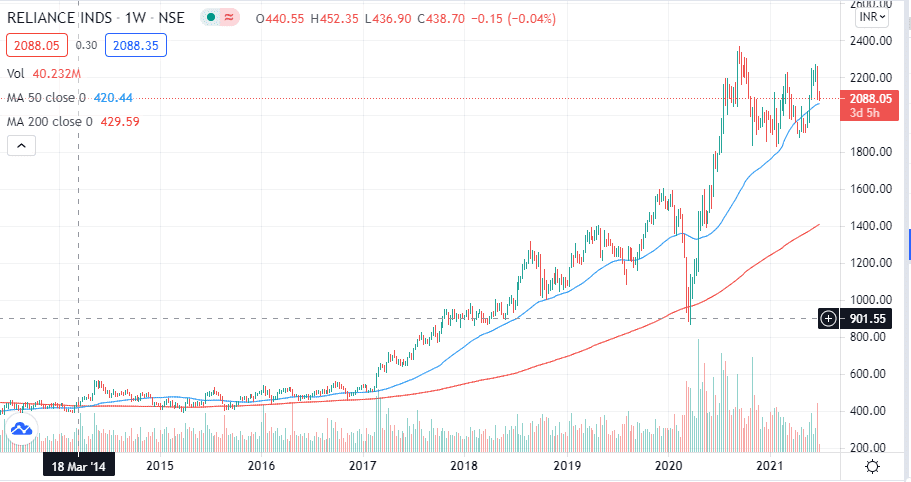
These are basic concepts in the technical analysis terminology. Let us check an example of a golden cross. In March 2014, Reliance weekly charts went through a golden crossover which is quite visible.
Frequently Asked Questions
Moving average crossovers aim in the identification of new trends (as well as putting you in a position near the start of these new trends). These may thus be applied to all time frames with some success. Many long-term traders, on the other hand, pay particular attention to the 50 and 200-period EMA or exponential moving averages because a death cross occurs when the EMA (50) crosses below the EMA (200).
Momentum traders consider the cross of EMA 20 and EMA 50 as well as the cross of EMA 50 and EMA 200 as one of the most reliable and best indicators for intraday as well as swing trading.
When a stock’s 50-day moving average crosses above its 200-day moving average, it is said to have completed a golden cross. In opposition to the cross of death, the golden cross is a strong bullish market signal that signals the beginning of a long-term rise.
When a stock’s 50-day moving average crosses over its 200-day moving average, it is known as a golden cross. In contrast to the cross of death, the golden cross is a strongly positive market indicator, indicating the beginning of a long-term upswing.
When a short-term moving average line crosses below a long-term moving average line, it is referred to as a “death cross” by technical analysts. This indicates a shift in price momentum. The combination of 50 and 200 days is frequently the most popular. Generally death cross triggers a bull phase and it lasts shorter than the bull phase.
What are the Moving Average Golden Cross and Death Cross?
Moving Average Golden Cross (also referred to as “Golden Cross”) is when a short-term moving average (such as the 50-day simple moving average) crosses above a long-term one (like the 200-day SMA). This often signals that an upward trend has formed and serves as a buy signal for many traders.
Conversely, the Moving Average Death Cross (or simply, “Death Cross”) occurs when the shorter-term MA crosses below the longer-term MA. This indicates that bulls have lost strength relative to their bearish counterparts– sending out a sell signal of sorts.
A Golden Cross Usually Occurs in Three Stages
- During a downtrend, the short-term moving average is lower than the long-term moving average.
- The short-term moving average crosses above the long-term moving average, reversing the trend.
- When the short-term moving average holds above the long-term moving average, an uptrend begins.
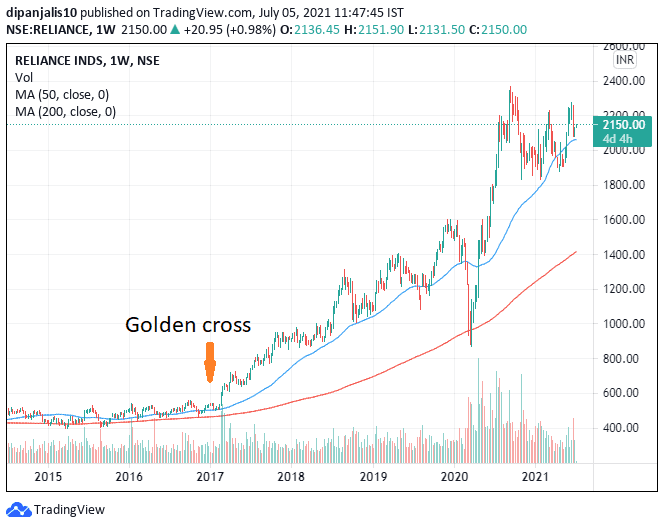
- For example, in 2017, the weekly chart of Reliance company showed a crossover and after that, the Reliance market went through its golden time which is still continuing.
What does the Death Cross indicate?
The death cross is a chart pattern that indicates a major sell-off is taking shape. When a stock’s short-term moving average falls below its long-term moving average, a death cross appears on the chart. The 50-day and 200-day moving averages are often the most common moving averages used in this pattern.
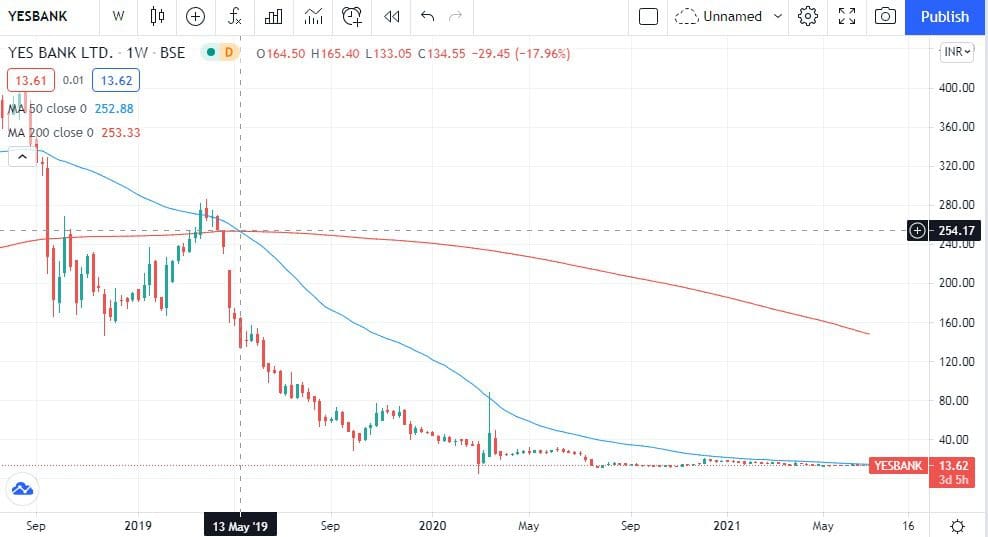
For example, Yes Bank share showed a Death Cross in December 2018, and that trend continued through December 2020 and even till now. In this scenario, the Death Cross was at its peak even during the last bull run.
A Death Cross Also Usually Occurs in Three Stages
- During an uptrend, the short-term moving average is higher than the long-term moving average.
- The short-term moving average crosses below the long-term moving average, inverting the trend.
- When the short-term moving average falls below the long-term moving average, a downtrend begins.
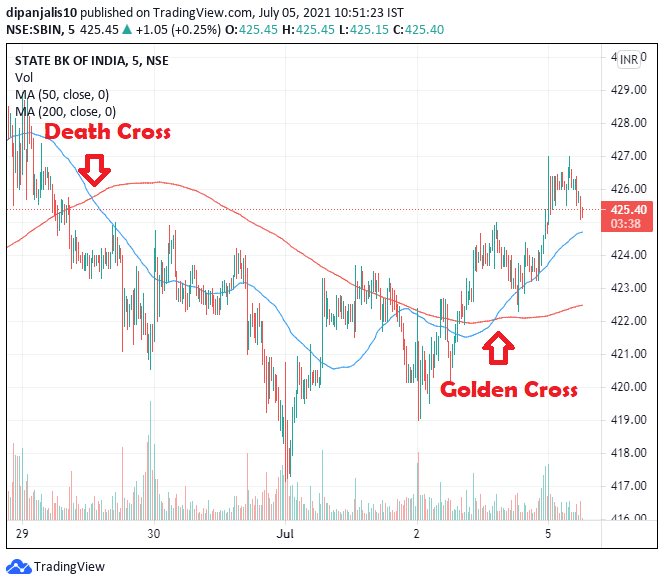
More examples of Death Cross :
What is Golden Cross EMA?
When a stock’s 50-day exponential moving average crosses over its 200-day exponential moving average, we can tell it is a golden cross EMA.
What is Golden Cross SMA?
We can calculate a simple moving average (SMA) by an arithmetic formula. It is calculated by adding current prices and then dividing by the number of time periods in the estimation average. When a stock’s 50-day simple moving average crosses over its 200-day simple moving average, we call it a golden cross SMA.


How to Create a Golden Crossover Screener Using Chartink?
Chartink is a stock screener website through which we can create the moving average of any shareholding company. Here is a demo showing how to create the moving average.
First, go to Google. Then go to the search engine and type Chartink.com.

Then Google will take you directly to the chartink.com website. Here it will look like this.

Go to the Screeners option from which you have to select the Create scan option which is highlighted through the red circle in the below image.

Then click on the +(add symbol) marked by the red underline.

Then after clicking on add a symbol, you will get a search bar. Write SMA on that search bar. Then you will get to see an arithmetic box. Besides that, you have to click on the number option and erase it. Then you need to choose the moving average. Here I have chosen 50, then write crossed above in the options box. Again choose the SMA and choose the moving average. Here, I have chosen 200.

Then click on run scan. You will see the stocks that have gone through a golden crossover today. Here is an example.
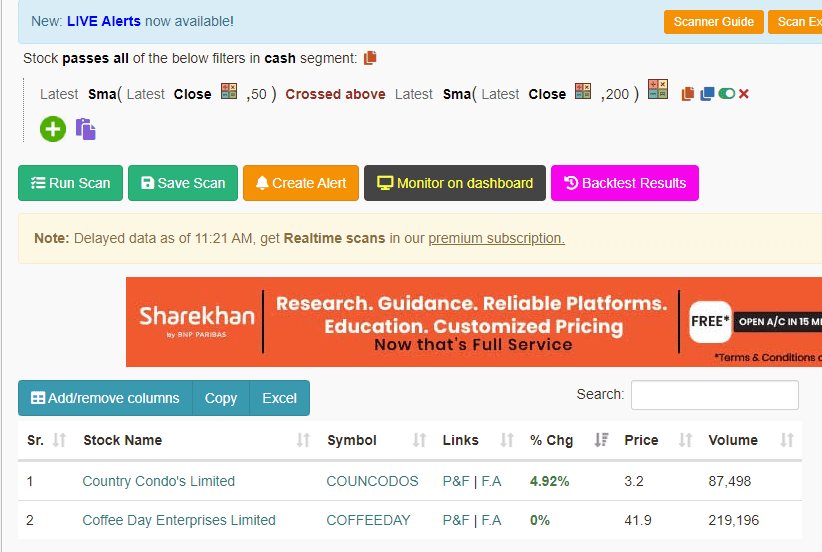
As you can see chartink is showing two stocks’ names. Now let’s check one of the two stocks in the TradingView platform to know whether it is showing correctly or not.
Checking Golden Crossover Using Tradingview.in
Now go to TradingView.com and search for any one of the two stocks’ names which we got on the chartink website. Here, I am checking the Country Condo’s limited on tradingview.com.
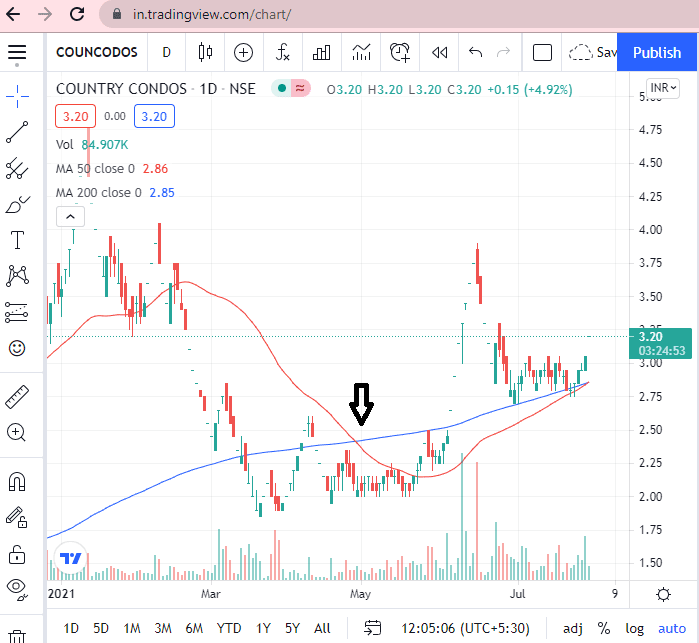
As you can see that Country Condo’s limited is having its golden crossover which is clearly visible through this chart. So it is being proven that whatever the companies name the chartink suggests on that day to have its golden crossover is true. The company name Chartink suggest is actually going through a golden crossover on that day.
The Golden Cross vs Death Cross
A golden cross and a death cross are exactly opposite to each other. A Golden cross indicates that a bull market is going for the long term. On the other hand, a death cross symbolizes a bear market, that is the market is going on a downtrend. Both indicate the solid confirmation of a long-term trend by the development of a short-term moving average crossing a long-term moving average.
What is the Golden Crossover Strategy?
When the 50-day moving average crosses over the 200-day moving average, we call it a Golden Cross. If you trade the golden cross “blindly,” the market can put you in whipsaws. We can use the Golden Cross as a trend indicator. Buy the pullbacks only when the 50-day moving average is higher than the 200-day moving average.
How to Trade Moving Average Golden Cross and Death Cross?
When the 50-day moving average is above the 200-day MA, i.e., the Golden Cross, we can use it as a trend filter. Only buy the pullbacks when the 50-day is above the 200-day moving average.
When the 50-day moving average is below the 200-day MA, i.e., the Death Cross, we can also use it as a trend filter. Only short-sell the rallies when the 50-day moving average is below the 200-day moving average.
Conclusion
So, here’s what you’ve learned through today’s lesson:
- When the 50-day moving average crosses over the 200-day moving average, we call it a Golden Cross.
- When the 200-day moving average crosses the 50-day moving average, we call it the Death Cross.
- If you trade the Moving Average Golden Cross and Death Cross “blindly,” you can face a whipsaw in the market. This whipsaw can lead to a series of losses in a sideways market.
- You may profit from huge trends if you know how to ride them.

")
