Pivot Points Indicator is a predictive or leading indicator. Traders use the price level as a possible support and resistance between market movements. Simply, it itself is the average of high, low, and closing prices from the previous trading day. The whole content is about Pivot Points trading along with its features, setup, strategies, and more.
Pivot Points Indicator FAQ
Generally, Pivot points are leading or predictive indicators. It determines the overall trend of the market over multiple time frames. The tool provides specialized plots of the support-resistance levels. The term “Pivot” means a central point on which a mechanism turns or oscillates.
Pivot Points are normally used by intraday traders but sometimes it works well in long-term trading also. Based on the center price level, the Pivot point, there are 6 price levels. Three support levels and three resistance levels.
We’ve already mentioned that intraday traders generally use this indicator the most. To find the support/resistance level and entry-exit bounce, Pivot Point consider one of the most popular indicators in intraday trading.
As we know that the price levels are based on the open, high, low, close of the previous day. So wider the range between these values, the greater the distance between levels and vice versa. There are a few sure-shot formulas of Pivot Point calculation, explained below.
Among the five different versions of PP, these two are very much important. Standard or Classic Pivot Points – It starts with a base PP which is the average of the previous high, low, and close values. PP generally stands at the middle point of the support-resistance level. Fibonacci Pivot Points- It is almost similar to standard PP. Works on high, low, and close prices.
Origin History of the Pivot Points
Floor traders mainly used the Pivot Points to set key levels. In this, the floor traders are the original day traders and they deal in a very fast-moving environment with a short-term focus. At the beginning of the trading day, floor traders would look at the previous day’s high, low, and close to calculate a pivot point for the current trading day. This Pivot Point was the base, and further calculations were used to set support 1, support 2, support 3, resistance 1, resistance 2, and resistance 3. These levels would then be used to assist their trading throughout the day.
Top Features of Pivot Points
- Pivot points analysis is a technique for determining key levels.
- It tends to function as support or resistance and can be a turning area. This technique is used by day traders.
- There are several methods of identifying the exact points. There are some different versions of pivot points like Traditional, Fibonacci, Woodie, Classic, Camarilla, and DeMark. Each type has its own calculation method.
- Therefore, the maximum use of pivot points is the variation of significant prices like established highs, lows, opening, and closing prices, and then applying a calculation to determine these points.
- These are calculated additional support and resistance levels alongside the pivot points. These can be used to determine when to enter or exit trades or to determine the range of a market.
- In this indicator, conservative traders look for additional confirmation before entering a trade.
Formulas of Pivot Points
When we take Pivot Points, we take the whole support-resistance levels calculations as well. Traders should know PP along with support and resistance level calculation in order to study the indicator properly. The calculation of PP depends on the previous high, low, and close average. On our StockManiacs site, you will find the Pivot Point Calculator and can calculate the PP, resistance, and support value easily. There are a few techniques by which one can calculate this system.
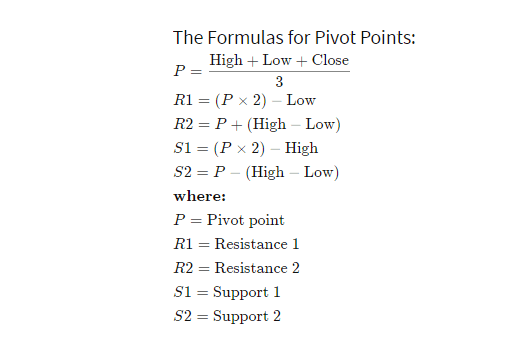
Here, P defines the pivot point which is calculated by the addition of the high, low, and close, divided by 3. Based on the center price level or Pivot point, support-resistance levels are formulated.
How to Use Pivot Points in Trading?
Here, I will guide you about the usage of the Pivot Points on your charting platforms. I’ve taken two best terminals, Zerodha Kite and Upstox Pro.
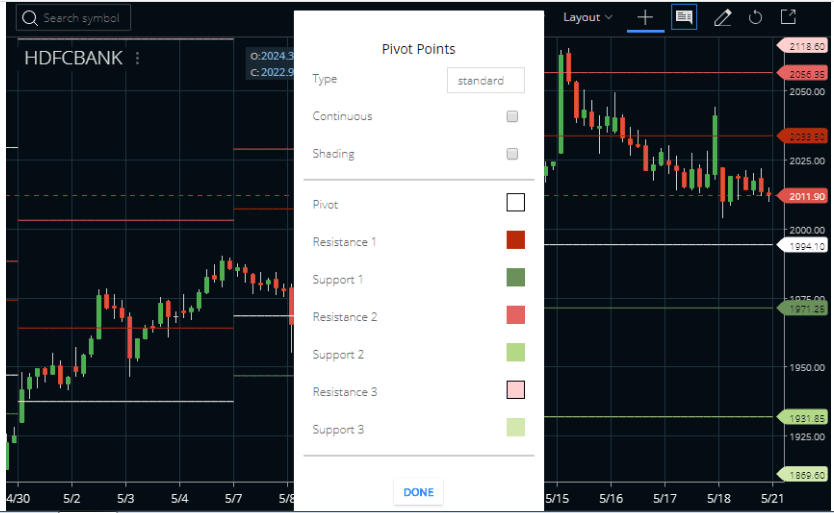
On Zerodha Kite
Traders can find the Pivot Points indicator under the STUDIES section in the Zerodha Kite browser app as well as in the Kite mobile App. We can attach the Pivot points indicator on to intraday charts because they are mainly for intraday trading. Please check the image below to understand how we attached the Pivot Points indicator in the HDFC Bank share price chart.
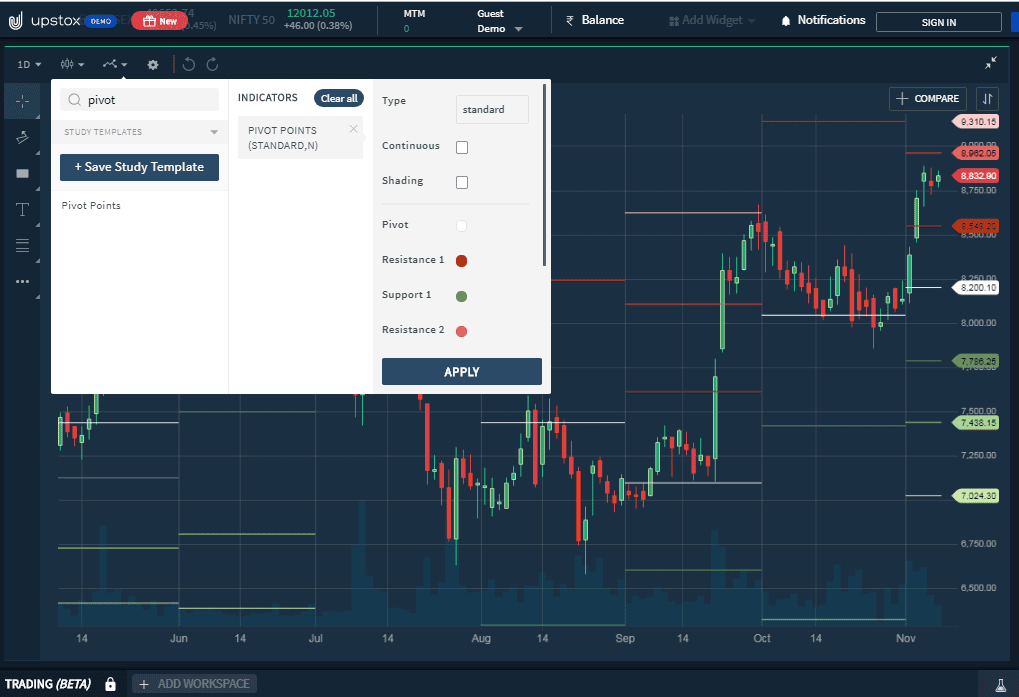
On Upstox Pro
In Upstox Pro, also the strategy is almost the same as the Zerodha Kite. First of all open the account, then a chart of any preferred asset. Now, look for the indicator search option, and write down the indicator name. Lastly, click on apply.
How to Trade Pivot Points Successfully?
There are a few best ways by which one can trade with Pivot Points successfully. I’ve listed below some of them. So, just let’s have a look.
Day traders can use a 5-minute or 15-minute chart which is most reasonable. Swing traders may use weekly pivot points and it would be best to apply the strategy on the four-hour to the daily chart. Lastly, Position traders would probably best be suited to use monthly pivot points on either the daily or weekly chart.
Using as Support and Resistance
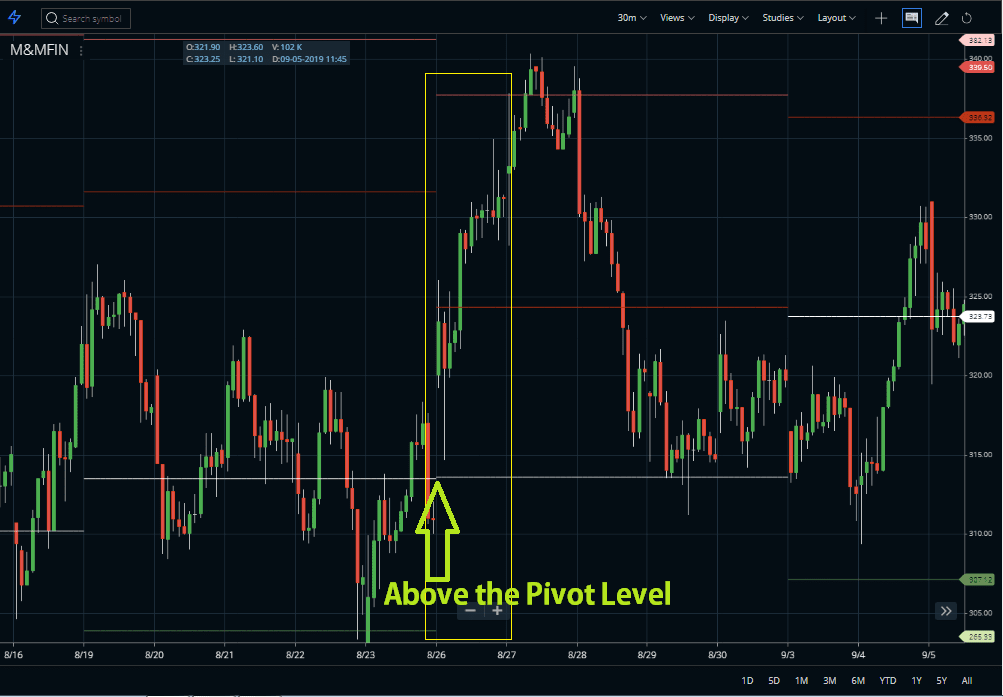
The most basic strategy is always having a look at the opening candle. If a stock price opens above the Pivot or Center level, the stock is about to rise. Look at the picture below, here I take 30 min chart and the day’s first candle opens above the Pivot level. And, after opening it moved upwards.


Now, we will go forward to the support resistance level. In simple terms, support is from where a price bounce downward or upward. The opposite is the resistance, from there the price goes down.
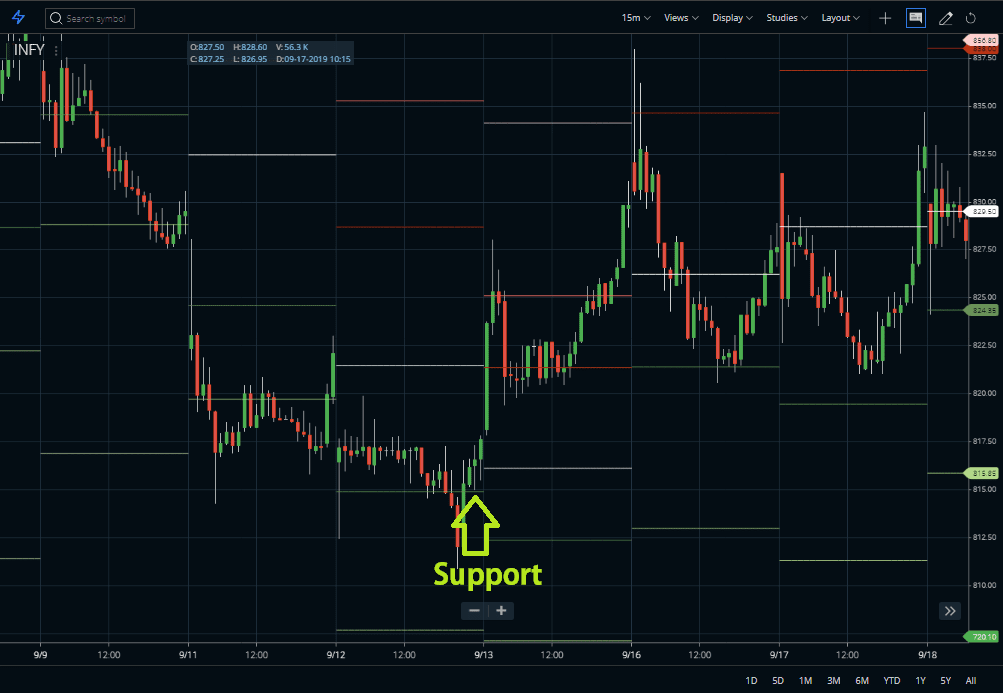
Observe the picture carefully. Here, the price took support at the S1 (Support 1) level and moved in the upward direction.
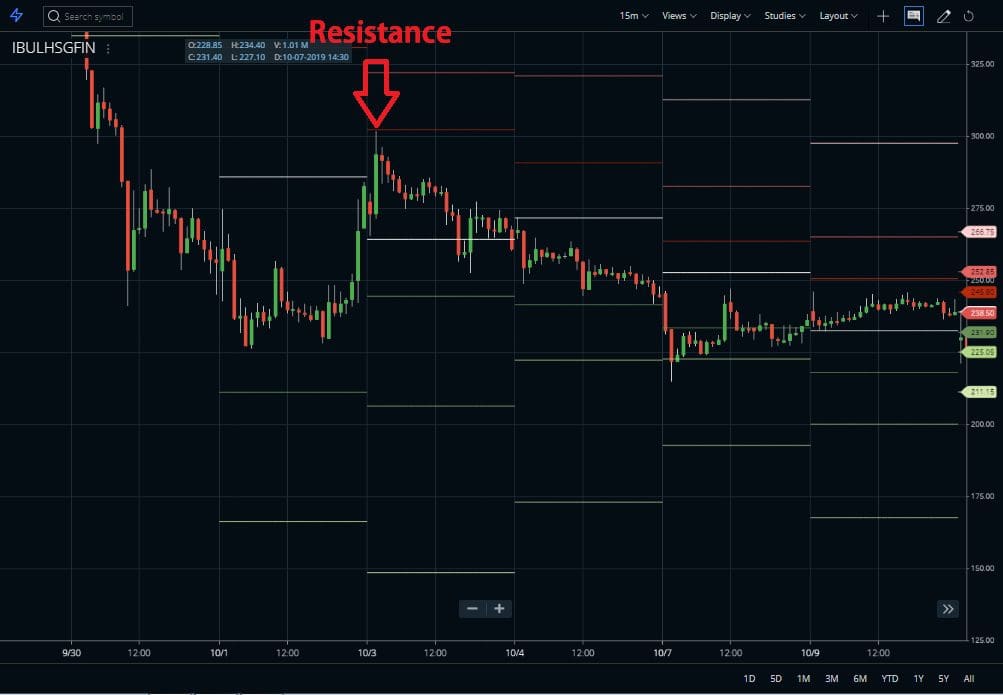
The above chart is an example of the resistance level. Here, the price was moving upward but at R1 it took the resistance and started moving downward.
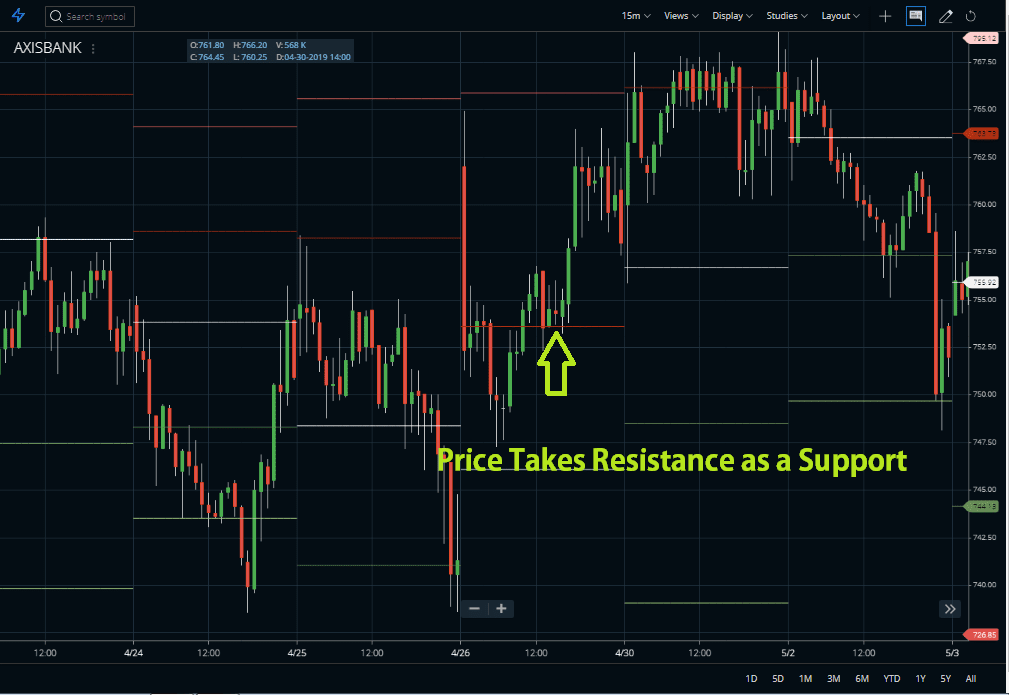
Now, look at the above graph, as you can see that the R1 (resistance 1) acted as a support level from where the price takes a bounce and move upward.

Just in the opposite way, sometimes the price also takes support as a resistance. Like the above picture, the price takes S2 (support 2). A bullish or bearish candlestick reversal pattern could confirm a reversal of the first or second resistance. Indicators like RSI or Relative Strength Index could also confirm overbought and oversold conditions at these important levels.
More Examples of Pivot Points Trading
Nowadays, your broker’s terminal cal plot the Pivots for you on an intraday chart. We use Zerodha Kite to plot PP. In order to make the strategy easy, an image is attached below:

This is the Reliance share price chart with 10 min time frame. As you can see the PP line along with the support and resistance base are in a different color, you can change the color according to your wish. Before going into depth, let’s just look at the description below:
- Pivot- White
- Resistance 1- Red, 2- Yellow, 3- Blue
- Support 1- Green, 2- Brown, 3- Pink
As you can see, according to the last trading day, the market opens at the first resistance level and cross the third resistance level, indicating an uptrend in the market. The price opened with a breakout of the resistance level. It means the market will go higher while opening below the PP level generally indicates a downtrend in the market. It is advisable to buy a share at the support level and sell at the resistance level.
Therefore, the PP plays a significant role in intraday trading and traders follow the technique properly to get an indication of support and resistance level.
Things You Must Know To Trade Pivot Points
A pivot point is a leading indicator for all markets. Learning how to trade pivot points is not at all rocket science. The first thing you must practice in pivot point trading is to be patient with yourself.
Take Calculated Risks
Be bold in trading but the boldness must be calculative. There are bold traders and there are bold traders, but there are no old bold traders. One thing you must note pivot point trading is not a get-rich-quick scheme, it is a regular earning process. Pivot points trading is in fact a great way of improving your trades.
Last Day’s OHLC Value is Most Important
You can use the last trading days’ open, high, low, and close values to get the next day’s floor pivot values. But thanks to technology. Now almost every charting platforms come with floor pivots. Floor pivots are the most popular pivots used in cash, futures, and commodities markets. Floor pivots are calculated in advance as predictive support and resistance levels from where the market can reverse back. The primary pivot point (PP) is the point where the market changes from bullish to bearish. The support and resistance levels are predictive targets or bounce-back points. Check the image below:

7-Point Guide for Day Trading Pivot Points
Daily floor pivots were originally calculated by pit traders to predict intraday turning points. So, how to trade pivot points as a strategy:
- Use a 15-minute chart for intraday.
- Use pivot points as support or resistance.
- In some cases, the trader uses a pivot point as an entry point when the price is able to break through the pivot.
- In other cases bounce from the pivot point is considered as an entry in counter-trend trade.
- Resistance 1 (R1) and support 1 (S1) provide advanced countertrend entries.
- In both cases, the trader needs confirmation from the momentum indicators.
- In addition to daily pivots, I recommend using monthly and weekly pivot points. Weekly and monthly pivot points are of more concern to swing position traders.
Video Example of Nifty Trading with Pivot Points
Below is a video published by us on Nifty trading using the Pivot Points trading strategy.
Suggested Reading
The most complete trading book on this subject is Secrets Of A Pivot Boss by Frank Ochoa. True Pivot lovers can learn many hidden secrets of this trading technique in this book. All trading codes are also included in the book. Click below to order Secrets Of A Pivot Boss from Amazon.
Download Pivot Points PDF
Here we provide Chapter 5 of this costly ebook as a sample. Where Franklin Ochoa has described the Classic Pivots.

Download Chapter 5 of the book “Secrets Of A Pivot Boss” from here. You can read the review of the book here.
Conclusion:
However, it usually starts with a cross of the Pivot Point. Sometimes the market starts above or below the Pivot Point indicator. Support and resistance come into play once it approached close to the Pivot level after opening. The concepts behind Pivot Points can be applied across various time frames which are designed for floor traders. It is important to confirm these Pivot Points indicator signals with other aspects of technical analysis as with all indicators.


