Understanding the mood of the stock market is extremely important for both traders and investors. Markets are not driven only by earnings, economic data, or technical indicators. In reality, the psychology of investors plays a huge role in price movements. The Market Mood Index (MMI) helps capture that psychology by measuring whether investors in the Indian stock market are currently acting out of fear or greed.
Live Market Mood Index (MMI)
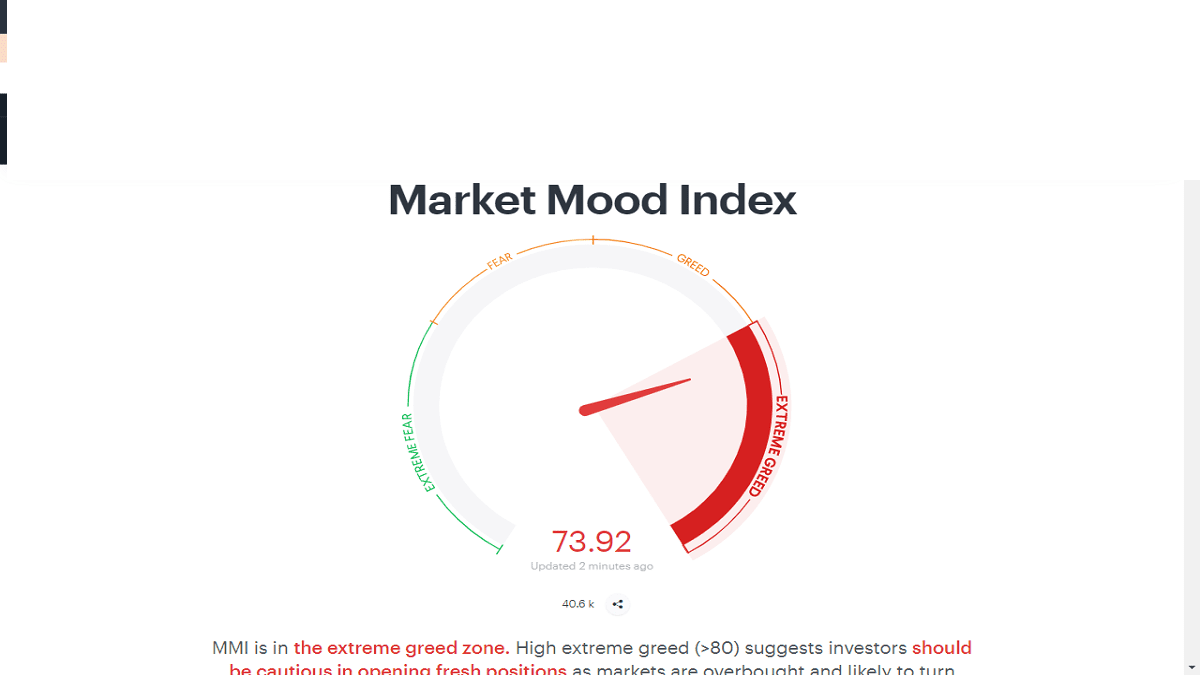
The live Market Mood Index indicator below shows the current sentiment of the Indian equity market. The value ranges between 0 and 100 and indicates whether the market is experiencing Extreme Fear, Fear, Greed, or Extreme Greed. Traders often use this sentiment gauge to identify potential buying opportunities when fear is high and possible profit-booking zones when greed becomes excessive.
Get this data before the market closes on Telegram
Historical Market Mood Index (MMI) Data vs Nifty Trend
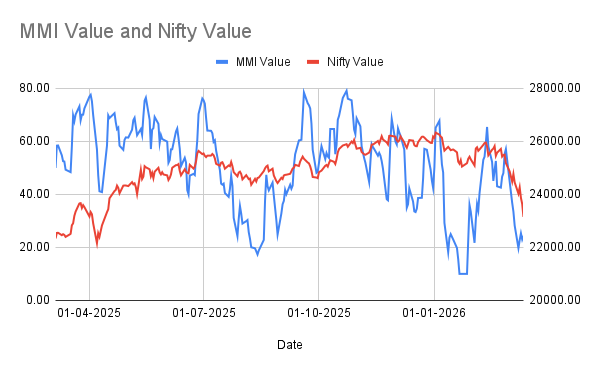
The chart below shows the historical Market Mood Index (MMI) data for India compared with the Nifty 50 index performance over the past year. By analysing the MMI index history, traders and investors can understand how market sentiment cycles between extreme fear and extreme greed. Historically, periods of low MMI values (fear zones) often appear near market bottoms, while high MMI readings (greed zones) tend to occur close to market tops. Studying this historical MMI data alongside the Nifty trend helps investors identify potential accumulation opportunities, manage risk, and better time entries and exits in the Indian stock market.
Market Mood Index vs Nifty
What is Market Mood Index (MMI)?
Market Mood Index is nothing but a market sentiment indicator which helps us understand the current market situation. It analyses overall market behaviour and suggests the present market condition.
In simple words, the indicator measures whether investors are currently fearful, cautious, optimistic, or extremely greedy.
The idea behind this concept is simple but powerful. Markets are not always rational. Investors often make decisions based on emotions rather than logic.
During bull markets, investors become greedy and keep buying even at higher prices. During corrections, investors panic and sell their holdings at very low prices. The Market Mood Index helps identify such emotional extremes.
Understanding these emotional cycles can help traders avoid buying at the top and selling at the bottom.
Why Understanding Market Mood Matters
It's important to have a good understanding of the market mood. MMI or Market Mood Index helps you to do so. Because a wrong guess can lead you to a heavy loss. That is why it is important for you to know the right time to make a buy or sell move.
Suppose everyone is selling the Nifty index. In such a scenario, do not go with the flow. Just because everyone is selling it does not mean you cannot buy the market at that time.
Rather you can find a buying opportunity during that time.
But you have to keep in mind that such opportunities usually work better for swing trading or positional trading rather than intraday trading.
On the other hand, the market mood also helps you find the right time to exit from the market. If investors become excessively greedy, the market can quickly become overbought and vulnerable to correction.
Market Mood Index Zones Explained
The Market Mood Index divides sentiment into four different zones which represent the emotional condition of investors.
| MMI Value | Market Sentiment |
|---|---|
| 0 – 30 | Extreme Fear |
| 30 – 50 | Fear |
| 50 – 70 | Greed |
| 70 – 100 | Extreme Greed |
Let us understand each zone in detail.
Extreme Fear (Below 30)
High severe fear (below 30) indicates that now may be an excellent opportunity to open new positions. Markets are often oversold during this stage because many investors panic and exit their positions.
Suppose you are keeping your eye on the market, but due to its volatility, you are unable to understand the right time to buy. As everyone is selling the market, you may become afraid to put your money into it.
However, according to the Market Mood Index, this might actually be the right time to invest because prices are already depressed.
Contrarian investors often look for opportunities during such periods of extreme fear.
Fear (30–50)
The range between 30 and 50 represents the fear zone.
It implies that investors are concerned about the market but are not yet in panic mode. The market may continue to fall or it may start stabilising, depending on how sentiment evolves.
This situation is often tricky because markets can move in either direction. Traders often prefer waiting for clearer signals before committing capital.
Greed (50–70)
When the indicator moves between 50 and 70, the market enters the greed zone.
Investors become more confident and start chasing rising prices. Optimism spreads across the market.
However, excessive optimism can sometimes lead to irrational behaviour where investors buy assets without proper analysis.
Extreme Greed (Above 70)
Extreme greed suggests that investors are becoming overly optimistic and markets may be overbought.
This is usually not the best time to open fresh long positions. Instead, traders often consider reducing exposure or booking profits.
Example of Market Sentiment in Action
Let us explain with a simple example.
Suppose a stock is doing very well and its price has moved from ₹50 to ₹100 during a bullish phase.
When you hear about this rally, you may believe that the stock will continue rising and decide to buy it.
However, by the time you enter the trade, the rally may already be over. Early investors begin booking profits, and the stock starts correcting.
Out of fear, you decide to sell at ₹60 per share.
This means you bought near the top and sold near the bottom.
Situations like this happen because investors follow the crowd instead of analysing the market sentiment.
The Market Mood Index helps avoid such emotional decisions.
How Market Mood Index is Calculated
Tickertape built the Market Mood Index using several market indicators that reflect investor behaviour.
FII Activity
FII refers to Foreign Institutional Investors.
These large global institutions invest significant capital in the Indian stock market. Their buying and selling behaviour strongly influences market direction.
Heavy FII buying often signals optimism, while large selling pressure suggests fear.
Market Breadth
Market breadth measures the number of stocks advancing versus declining.
If most stocks are rising the market is healthy. If only a few large stocks are pushing the index higher while many stocks fall, the rally may not be sustainable.
Volatility and Skew
Volatility reflects uncertainty in the market.
Higher volatility usually means investors are nervous about the future.
The skew indicator helps estimate whether investors are positioning for a fall or a rise.
Momentum
Momentum measures how far the market has moved from a certain level.


Strong positive momentum indicates a bullish market, while negative momentum suggests bearish conditions.
Price Strength
Price strength measures how many stocks are making 52-week highs compared to those making lows.
A strong market typically has more stocks making new highs.
Demand for Gold
Gold is considered a safe-haven asset.
When investors become worried about the stock market, they often move money into gold. Therefore, rising gold demand often signals growing fear in equity markets.
Killer Insight #1 – Why Extreme Fear Often Creates the Best Buying Opportunities
One of the most powerful lessons investors learn over time is that the best opportunities often appear when markets look their worst.
During periods of extreme fear, investors panic and rush to exit the market. Prices fall rapidly because supply overwhelms demand.
However, long-term investors understand that panic selling often pushes stocks below their intrinsic value.
Historically, many major market bottoms occurred when investor sentiment reached extreme pessimism.
The Market Mood Index helps identify such phases when the crowd is extremely fearful.
Killer Insight #2 – How Smart Money Uses Market Sentiment
Professional traders and institutional investors rarely follow the crowd blindly.
Instead they carefully observe investor behaviour.
When retail investors become extremely greedy, professionals often start reducing exposure.
When retail investors panic, professionals quietly accumulate quality stocks.
This strategy is known as contrarian investing.
Monitoring the Market Mood Index can help traders recognise these emotional extremes.
Killer Insight #3 – Combining MMI With Technical Indicators
Market sentiment alone should not be used as a trading signal.
However, when sentiment signals align with technical indicators, the probability of a successful trade improves significantly.
For example:
- If MMI enters Extreme Fear while Nifty approaches a strong support level, markets may bounce.
- If MMI reaches Extreme Greed near resistance, markets may experience profit booking.
Combining sentiment with technical analysis can create a more balanced trading strategy.
Historical Behaviour of Market Mood Index in Indian Markets
Looking at historical market cycles shows how sentiment repeatedly swings between fear and greed.
During major corrections such as the COVID crash or global financial crisis, investor sentiment collapsed rapidly. Panic selling pushed the Market Mood Index into Extreme Fear.
These moments often feel uncomfortable because news headlines become extremely negative.
However, once panic selling subsides, markets often recover.
During strong bull markets, the opposite behaviour occurs. Investors become extremely optimistic and push prices higher. Sentiment enters the Greed or Extreme Greed zone.
Eventually, valuations become stretched, and markets consolidate or correct.
Understanding this cycle of fear and greed helps investors make better decisions.
Practical Strategy Using Market Mood Index
Many traders combine the Market Mood Index with trend analysis.
Step 1 – Identify Market Sentiment
Observe whether the MMI is currently in Fear or Greed.
Step 2 – Confirm Trend Direction
Use moving averages or trend indicators.
Step 3 – Look for Opportunity
Extreme Fear during an uptrend may present buying opportunities.
Step 4 – Manage Risk
Always use stop losses.
Using Market Mood Index With Other StockManiacs Tools
The Market Mood Index becomes even more powerful when combined with other tools available on StockManiacs.
For example, traders often combine sentiment indicators with:
When multiple indicators align, traders gain stronger confirmation for their decisions.
Frequently asked questions about Market Mood Index (MMI)
It indicates the emotional state of investors and whether the market is driven by fear or greed.
Yes. Both traders and investors can benefit from understanding market sentiment.
The other name of the Market Mood Index is the Market Sentiment Indicator or Fear and Greed Indicator.
No indicator can guarantee future price movements. However, sentiment extremes often appear near turning points.
It is more effective for swing trading and positional trading.
Conclusion
The Market Mood Index is a powerful tool for understanding the psychology of the stock market.
By measuring whether investors are fearful or greedy, the indicator provides insights that traditional indicators may not capture.
When used properly, the Market Mood Index can help traders identify buying opportunities during panic selling and avoid entering markets during excessive optimism.
However, like any indicator, it works best when combined with technical analysis, proper risk management, and disciplined trading.