The SuperTrend indicator is a very simple indicator, introduced by Olivier Seban. The buy and sell signal of this indicator changes to flip over the closing price. A buy signal is generated when the stock/index price turns greater than the indicator value and a sell signal is generated when the stock/index price turns lesser than the indicator value. This is a very trader-friendly indicator and it is used widely by stock market traders all over India.
SuperTrend Indicator with Zerodha Kite
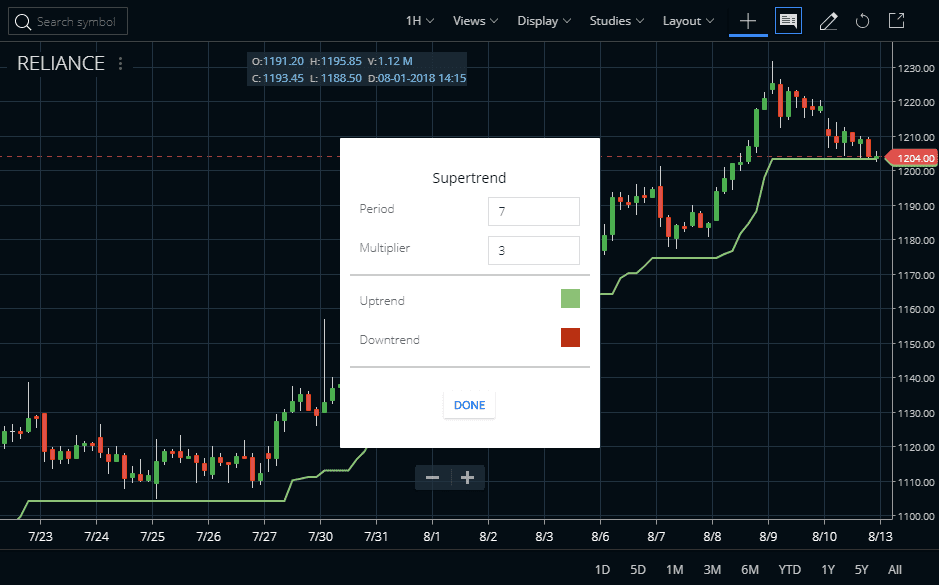
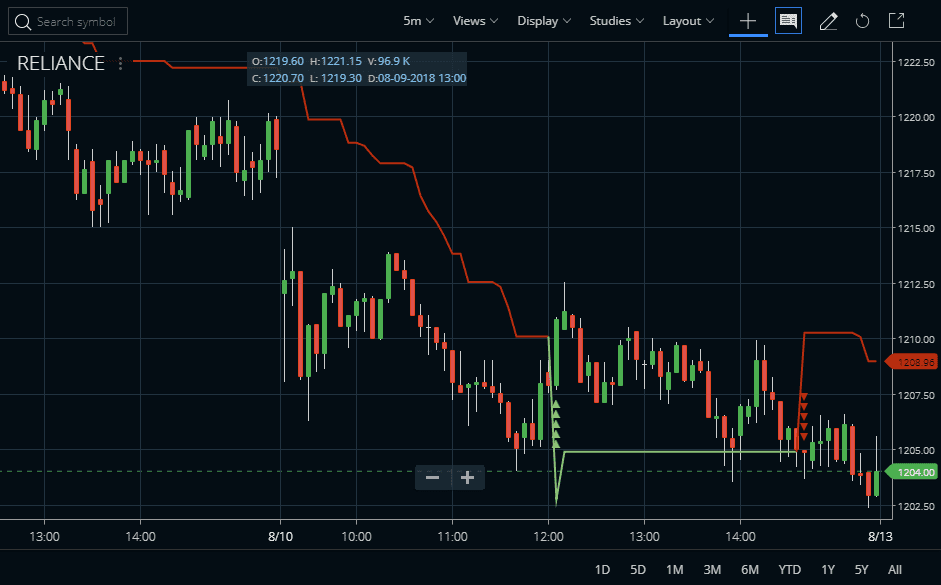
The traders can know more about the Supertrend indicator with Zerodha Kite, then they can find it in the STUDIES section of Zerodha Kite. This indicator is also available in Kite Mobile App. The default Period is 7 and Multiplier is 3. You can set the value of this to high and low. In this indicator on to any charts like daily, weekly, monthly, or intraday you can attach. You can also check how we attached the Supertrend indicator in the Reliance Industry share price chart.
SuperTrend is a trending indicator and this is like all trending indicators. It works well in highly trending markets in uptrends and downtrends. This indicator is easy to use and gives an accurate reading of an ongoing trend. It is constructed with two parameters, period and multiplier in which the most commonly used ones are 10 and 3.
Why Zerodha Kite SuperTrend Indicator became so popular?
Generally, Zerodha Kite is the simplest ever trading platform that I have used. Previously we used to use trailing stop loss systems like Chandelier Exit OR SuperTrend etc in Metastock OR after 2009 Amibroker became the most popular charting platform in India. But after the introduction of Zerodha Kite trailing stop loss in the form of SuperTrend people gradually shifted to Zerodha Kite for trading and also for charting.
There are several reasons of Zerodha Kite trailing stop loss indicator became the most popular in India.
Reason No. 1
For a long time, people were using Amibroker mainly due to indicators like SuperTrend. But after Zerodha introduced SuperTrend in Zerodha Kite, people started joining Zerodha and started using SuperTrend in Kite.
No cost for intraday as well as the end-of-day data in Kite compared to at least Rs. 500 to Rs. 2500 cost per month for data in Amibroker. The data in kite is clean and for equities even you can get continuous data.
Reason No. 2
The Zerodha Kite SuperTrend indicator is exactly matching the formula developed by Olivier Seban due to its creation by the engineers of Zerodha whereas in Amibroker there are SuperTrend indicators available by anonymous traders with the formula having no authenticity.


Reason No: 3
Even the Zerodha Kite trailing stop loss indicator is better than other brokers’ SuperTrend due to its clear differentiation of buy-sell line colors and unique trading arrows. The buy/sell arrow is not available in other broker platforms like Sharekhan TradeTiger OR Angel Speed Pro.
Parameters of The Indicator
The default values used while constructing this indicator are 10 for the average true range or trading period and three for its multiplier. The SuperTrend indicator when compared to a regular Moving Average trading system generates fewer false signals, for this reason, the SuperTrend indicator is preferred over a Moving Average trading system.
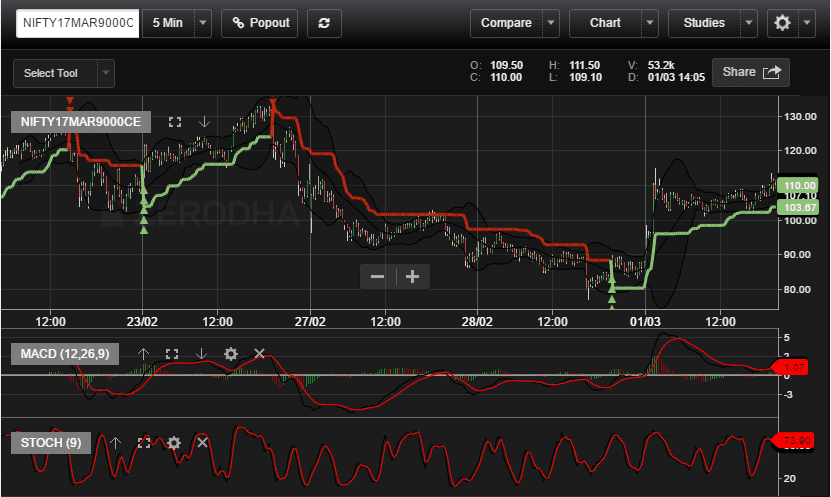
Options Trading with SuperTrend Indicator in Zerodha Kite
Just check SuperTrend and enter into trade. I even suggest traders compile SuperTrend with Range Bar charts to make a killing trading setup. You can even trade calls and puts with the setup SuperTrend + Range Bar.
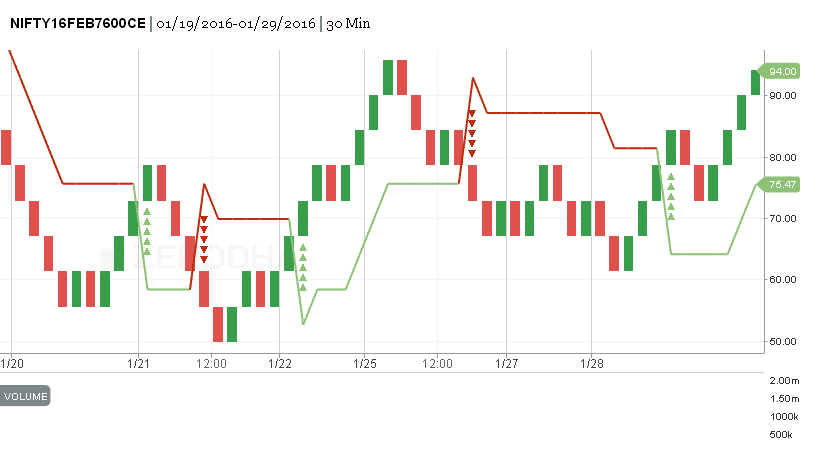
Here is an image of how SuperTrend looks like in the Nifty options range bar chart with the SuperTrend indicator applied.
The default value of SuperTrend in Zerodha Kite is Period = 7 and Multiplier = 3. You can trade this default value of Super Trend using Range Bar charts. By default Range, Bar charts do not have a time axis, and the candles get formed by price action only and this chart has very low noise.
You can watch this video also on how to use SuperTrend in Zerodha Kite.
In this video, I have discussed another concept of watching SuperTrend in 2 different time frames. One is 30 minutes time frame and another is 5 minutes time frame. Just check the signal in 30 minutes time frame and go in the same direction in 5 minutes time frame. That means if 30 minutes chart is in buy mode take all buy signals in 5 minutes time frame and vice versa. I would like to discuss more this SuperTrend indicator in the comments below.
Best Settings of SuperTrend Indicator
We all know that SuperTrend is a trendy indicator, and works pretty well in the trending market. Here, we can change the settings as per our requirements. You can use a single SuperTrend or multiple SuperTrend at a time. Here, to make the concept clear, we have listed some screenshots below:
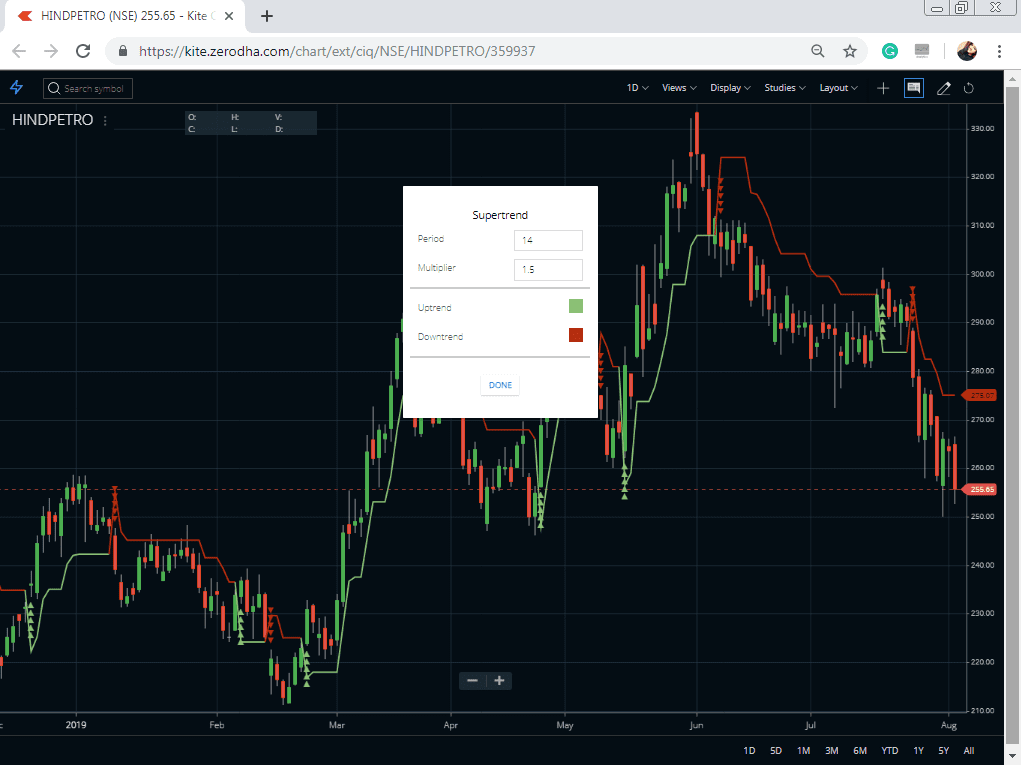
In order to change the settings, you have to go to the studies section, then click on the Supertrend indicator, you will get a small window like this. Here, you can set the period and multiplier as well as can change its color.
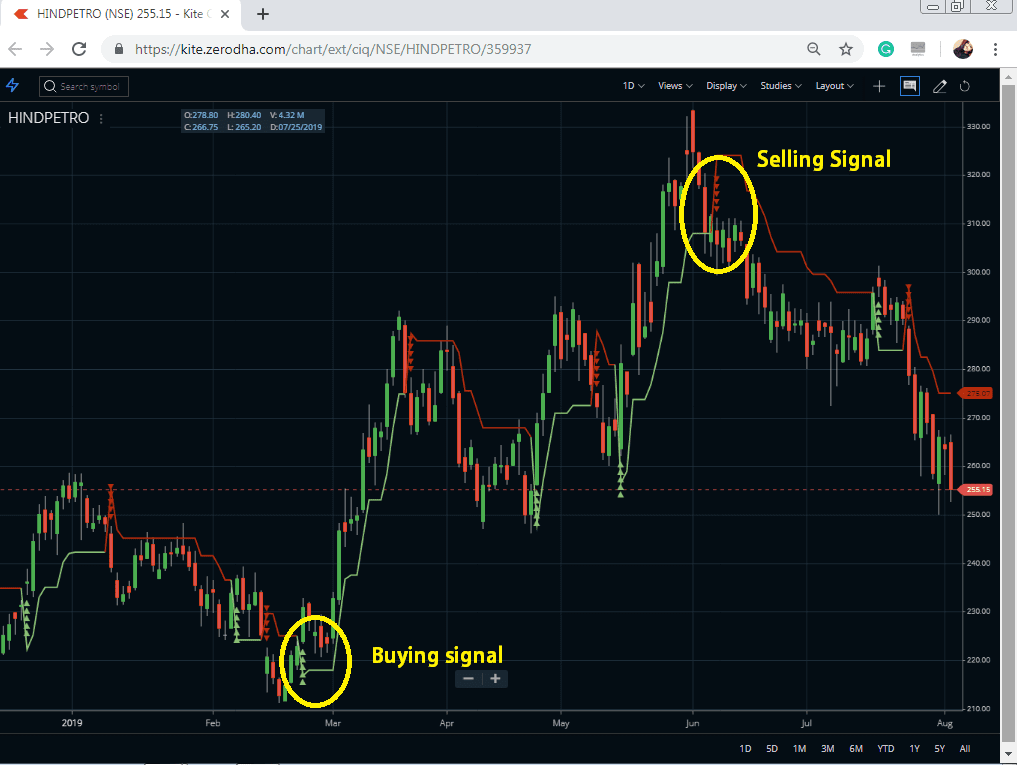
This above chart is a 1day chart with 14 periods and 1.5 multipliers SuperTrend. The is recommended for daily, monthly long-term securities.
Sometimes, false signals appear and disrupt the trade. In order to avoid such false signals, we can set up multiple supertrend with different settings.
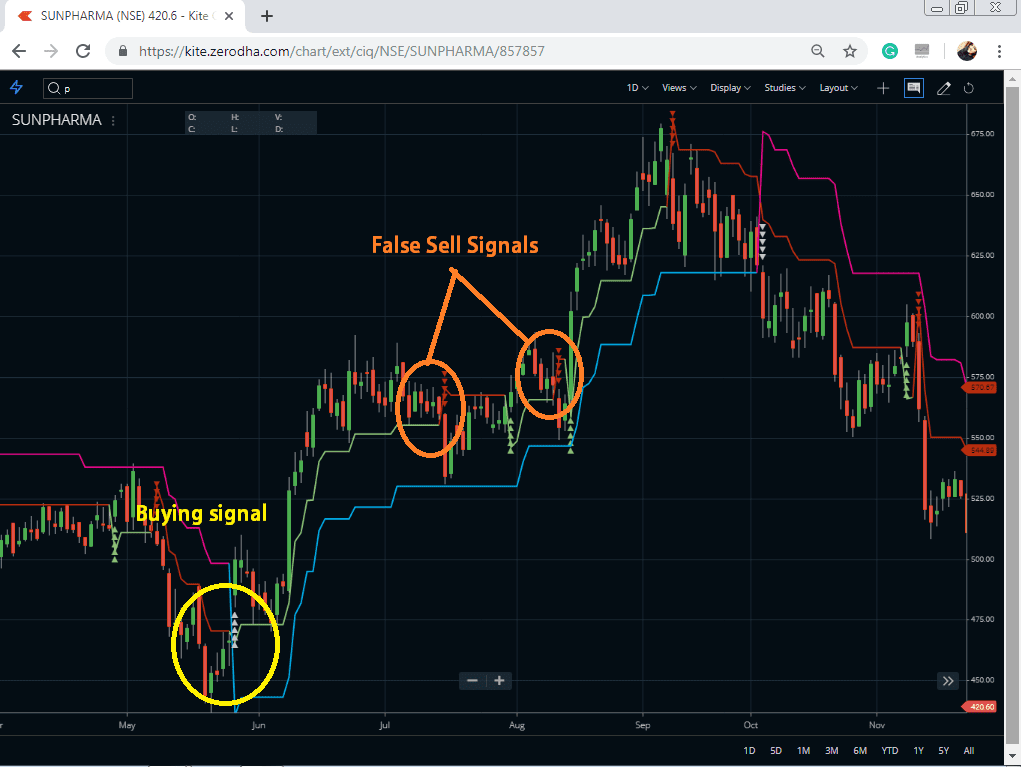
Here, we take Sunpharma and put 14, 1.5 supertrend and 10, 3 supertrend together. 10, 3 supertrend is in pink and blue color while 14, 1.5 supertrend is in red and green color. As you can see there is a false buying signal with a period of 14 and a 1.5 multiplier supertrend. Here, we place both the supertrend together to avoid a false signal.
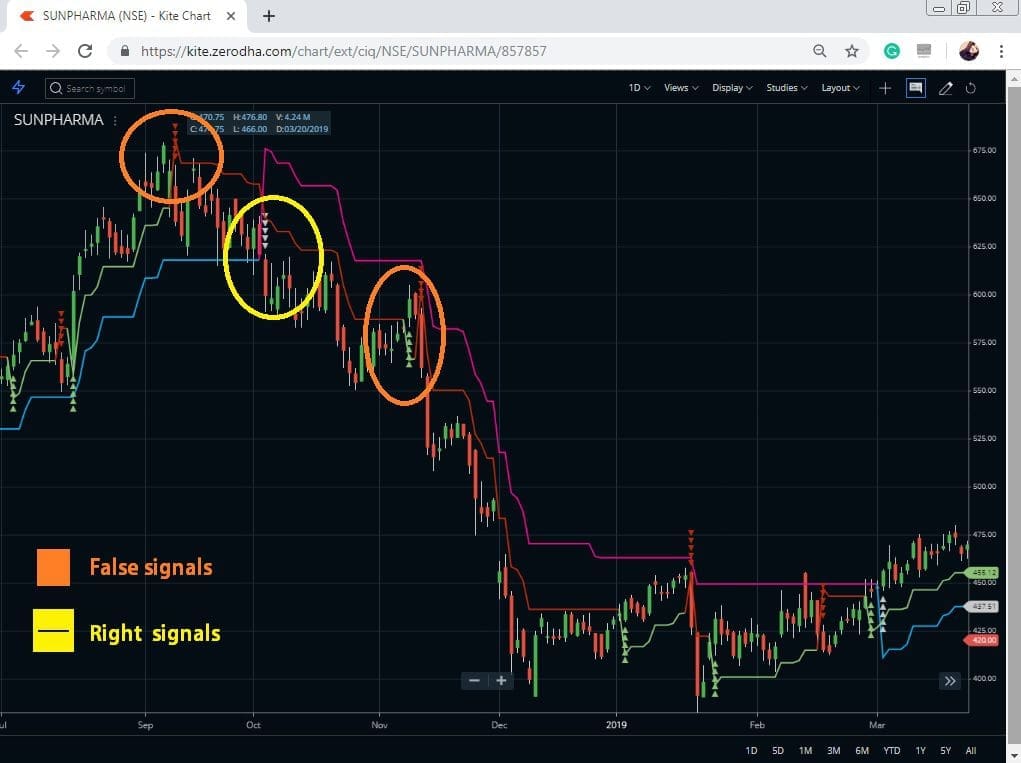
The same image has shown with the false sell signal also.
These settings are well-known for their profit-making ability. If you have any queries or doubts regarding the setup, you may comment below.
FAQ
Yes, the Supertrend indicator is an effective and reliable tool for accurately predicting market changes. Additionally, its accuracy can be further improved by combining it with other technical analysis tools.
Different indicators suit different individual trading styles and goals, so there is not one ‘best’ version of the Supertrend Indicator. It’s important to compare a few versions (e.g. ATR multiple vs Multiplier) in order to select what works best for you and your trading style.
The Supertrend Indicator definitely has potential for intraday traders as it helps identify areas of support or resistance quickly which are important in intraday markets. However, also combining this with other indicators may help strengthen your strategy even more when dealing with frequently changing markets.
The “secret” behind using a SuperTrend strategy lies in identifying key trends that will reflect ongoing trade activity throughout each given day These trends can then provide traders excellent entry points during volatile currency movements over time.
Conclusion
We have already covered this technical indicator developed by Olivier Seban in detail on our website. You can find more advanced articles on this topic on the internet. Still, this post can be a starting point for those who are new to the stock market and want to start using a simple trading system.


How can we differentiate between a false signal from a real signal in supertrend when we use multiple supertrend with different settings? Please reply
There are multiple ways. Yes, using multiple SuperTrend is one of them. Or you can use SuperTrend with 200-period moving average, like this.
If u get buy or sell signals u should Mark high and low level first .. then if it’s break that candle u can confirm then u can buy or sell .. u should keep stop loss which candle got buy single for example high break out I should keep sL low and it’s break low u should keep ur sL in High only as per the candle signal u can back test EOD Chart thank you