
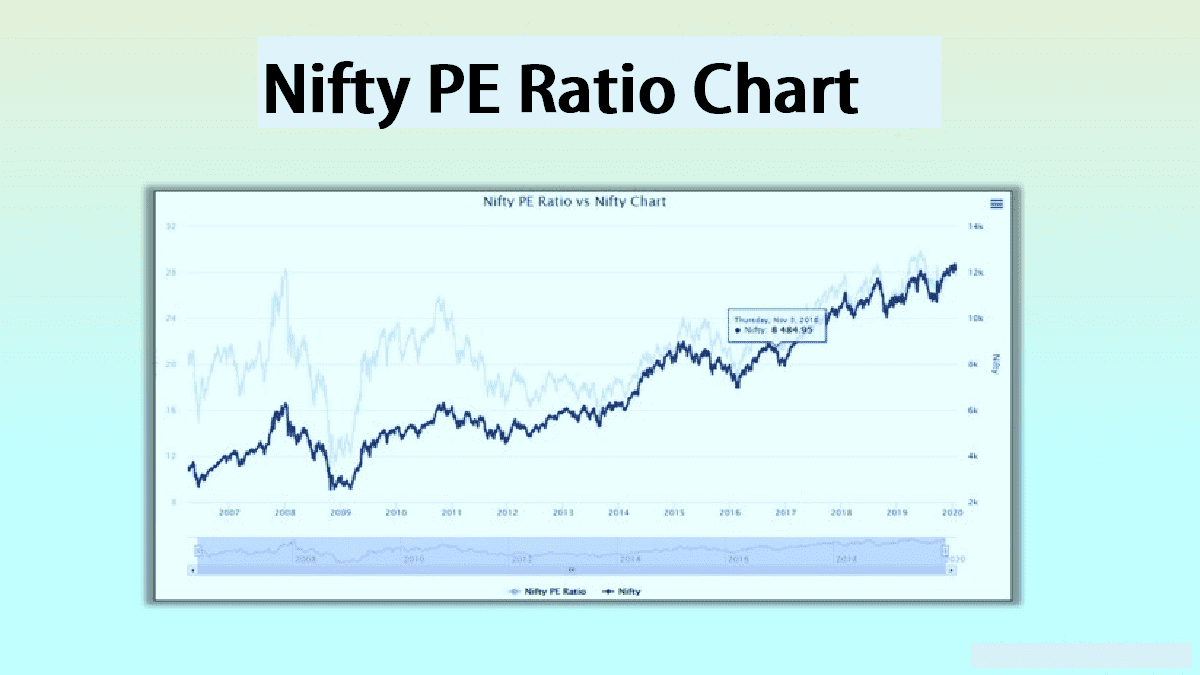
Nifty PE Ratio shows how much investors pay for ₹1 of Nifty 50 earnings. A PE below 15 indicates undervaluation, 15–25 is fair value, and above 25 suggests overvaluation. Tracking the Nifty PE ratio chart helps investors decide when to buy, hold, or book profits.
You may find basic information on the Price to Earnings (PE) ratio from our former blog post. Here, we come with the Nifty PE Ratio Chart page for some purpose. If you are related to equity investment, you must know the importance of the analysis of the Nifty PE ratio chart. From this page, you will get live and historical updates on Nifty PE. Here, besides observing the chart, I will also discuss the importance of the Nifty PE Ratio. Before stepping into the Nifty PE, let’s see what the PE ratio is.
Live Nifty PE Ratio Today (Auto Updated from NSE Data): —
Nifty PE Ratio Chart
The Nifty PE Ratio Chart dynamically visualises the Price-to-Earnings ratio of the Nifty index over time. Nifty is oversold below a PE Ratio value of 15, fairly priced between 15 and 25, overbought between 25 and 35 and highly overbought above 35. This clear differentiation helps investors quickly assess the market's valuation level and make informed investment decisions. However, to be more specific, instead of any fixed levels, we have used the mean and standard deviations of the PE ratio of Nifty 50 to get overbought and oversold levels.
This chart above also plots the Nifty EPS (Earnings Per Share). By tracking the EPS, investors can gauge the profitability of the companies within the Nifty index. The chart updates dynamically, ensuring that the latest EPS values are always displayed, allowing investors to monitor trends in corporate earnings effectively.
The Nifty PBV Chart shows the Price-to-Book Value ratio of the Nifty index, offering insights into how the market values the book value of the index's constituent companies. A lower PBV ratio might indicate undervaluation, while a higher ratio could suggest overvaluation. This chart helps investors understand the valuation levels of the companies within the Nifty index in relation to their book values.
The Nifty Dividend Yield Chart illustrates the dividend yield of the Nifty index over time, providing a measure of the income generated by the index's constituent companies as a percentage of their stock price. This chart is useful for income-focused investors who seek to understand the income-generating potential of their investments in the Nifty index. By updating dynamically, it ensures that the most current dividend yield information is always available.
Nifty PE Ratio Valuation Indicator (When to Buy or Sell)
| PE Range | Valuation | What To Do |
|---|---|---|
| Below 15 | Deep Undervalued | Aggressive Buying |
| 15–18 | Undervalued | Invest More |
| 18–22 | Fair Value | Continue SIP |
| 22–25 | Slightly Overvalued | Be Cautious |
| 25–30 | Overvalued | Partial Profit Booking |
| Above 30 | Bubble Zone | Avoid New Investments |
What is the Price to Earnings (PE) Ratio?
The price-to-earnings ratio, or PE ratio, is the measurement of the share price that is relative to the annual net income earned by the firm per share. The ratio shows the current investor demand for a company's shares. A high PE ratio generally means increased demand. This is because investors predict earnings growth in the future. Moreover, the PE ratio has units of years. This can be interpreted as the number of earnings years to pay back the purchase price.
Why Nifty PE Ratio Values Differ Across Websites
Many investors get confused when different websites show different Nifty PE values.
Common reasons:
- NSE uses free-float market capitalisation
- PE is calculated using trailing 4-quarter earnings (TTM)
- Since April 2021, NSE has used consolidated earnings instead of standalone earnings
- Data update timing varies across platforms
This is why your manual calculation may show 28–30 while the official PE is 20–22.
Why Nifty PE Ratio Dropped in 2021
In April 2021, NSE changed how Nifty PE is calculated:
- Earlier: Standalone earnings
- Now: Consolidated earnings (includes subsidiaries)
This increased total earnings → reduced PE ratio overnight.
Important: Pre-2021 and post-2021 PE ratios are NOT directly comparable.






What is the Nifty PE Ratio?
So, the Nifty PE ratio measures the average Price to Earnings ratio of the Nifty 50 companies. And it is covered by the Nifty Index. You can also call the PE ratio a "price multiple" or "earnings multiple".
- Generally, if P/E is 15, it considers Nifty is 15 times its earnings.
- And Nifty is in the oversold zone when Nifty PE value is at or below its 2 standard deviation line.
- It's taken as an overbought range when Nifty PE is near or above its 2 standard deviation line.
- You can assume that the market tends to bounce back from the oversold region as wise investors start buying stocks looking to snatch up bargains. Conversely, they do the exact opposite when Nifty P/E is in the overbought region.
Some Important Factors of PE
Moreover, you must remember some important points that there is no particular set rule you can apply. You must keep yourself updated on what is going on in the world. For instance, if the global economy is in trouble or there is a global health crisis, then the corporate earnings can be worse than expected. And this lowers investor expectations to many extents, and share prices will go down.
- Even though you see the market seems fairly valued at a P/E ratio below its 2SD level, once bad times come, it causes the market returns to continue on a downward trend. Hence, the P/E ratio may go much lower.
- On the other side, during the time of booming economies, corporate earnings can continue to go upward. And share prices can increase for many years continuously. A P/E ratio much above the top 2SD line does not always mean the market is overpriced or overbought.
Can You Catch the Markets at Extreme PE?
Ideally, if we analyse and see historical data of Nifty PE, it makes sense to buy more when valuations are low. Isn’t it? Buy Low. Of course, that is the whole idea of investing. But in real life, it is not that simple as analysing. It is so difficult to catch markets at their extreme high and low levels. It’s like a pendulum – it keeps oscillating continuously between overbought and oversold levels.
So at which point should you wait to invest? It is still so much difficult to wait for extremely low PE markets. And extremely low PEs are extremely rare. Still based on our prolonged analysis, we are able to sort out some of the best levels of Nifty PE Ratio. Here are the details:
Important Levels of Nifty PE Ratio and Investment Suggestions
- When the Nifty PE is below its bottom 2SD line, you can consider this as oversold. And the range of 12 to 10 is historically an extremely oversold or undervalued level.
- At these oversold zones, you can buy shares at discount prices. You can also invest in equity-based mutual funds. Besides this, index funds can also be a good investment at these levels.
- Oppositely, when Nifty PE is above its top 2SD line, it is overbought. And a range above 30 is an extremely overbought or overvalued level.
- At this zone, you should sell all your equity-based investments and hold this capital for the undervalued level of Nifty. During this time, you should not make any further investments.
Real Live Examples from Nifty PE Ratio Chart
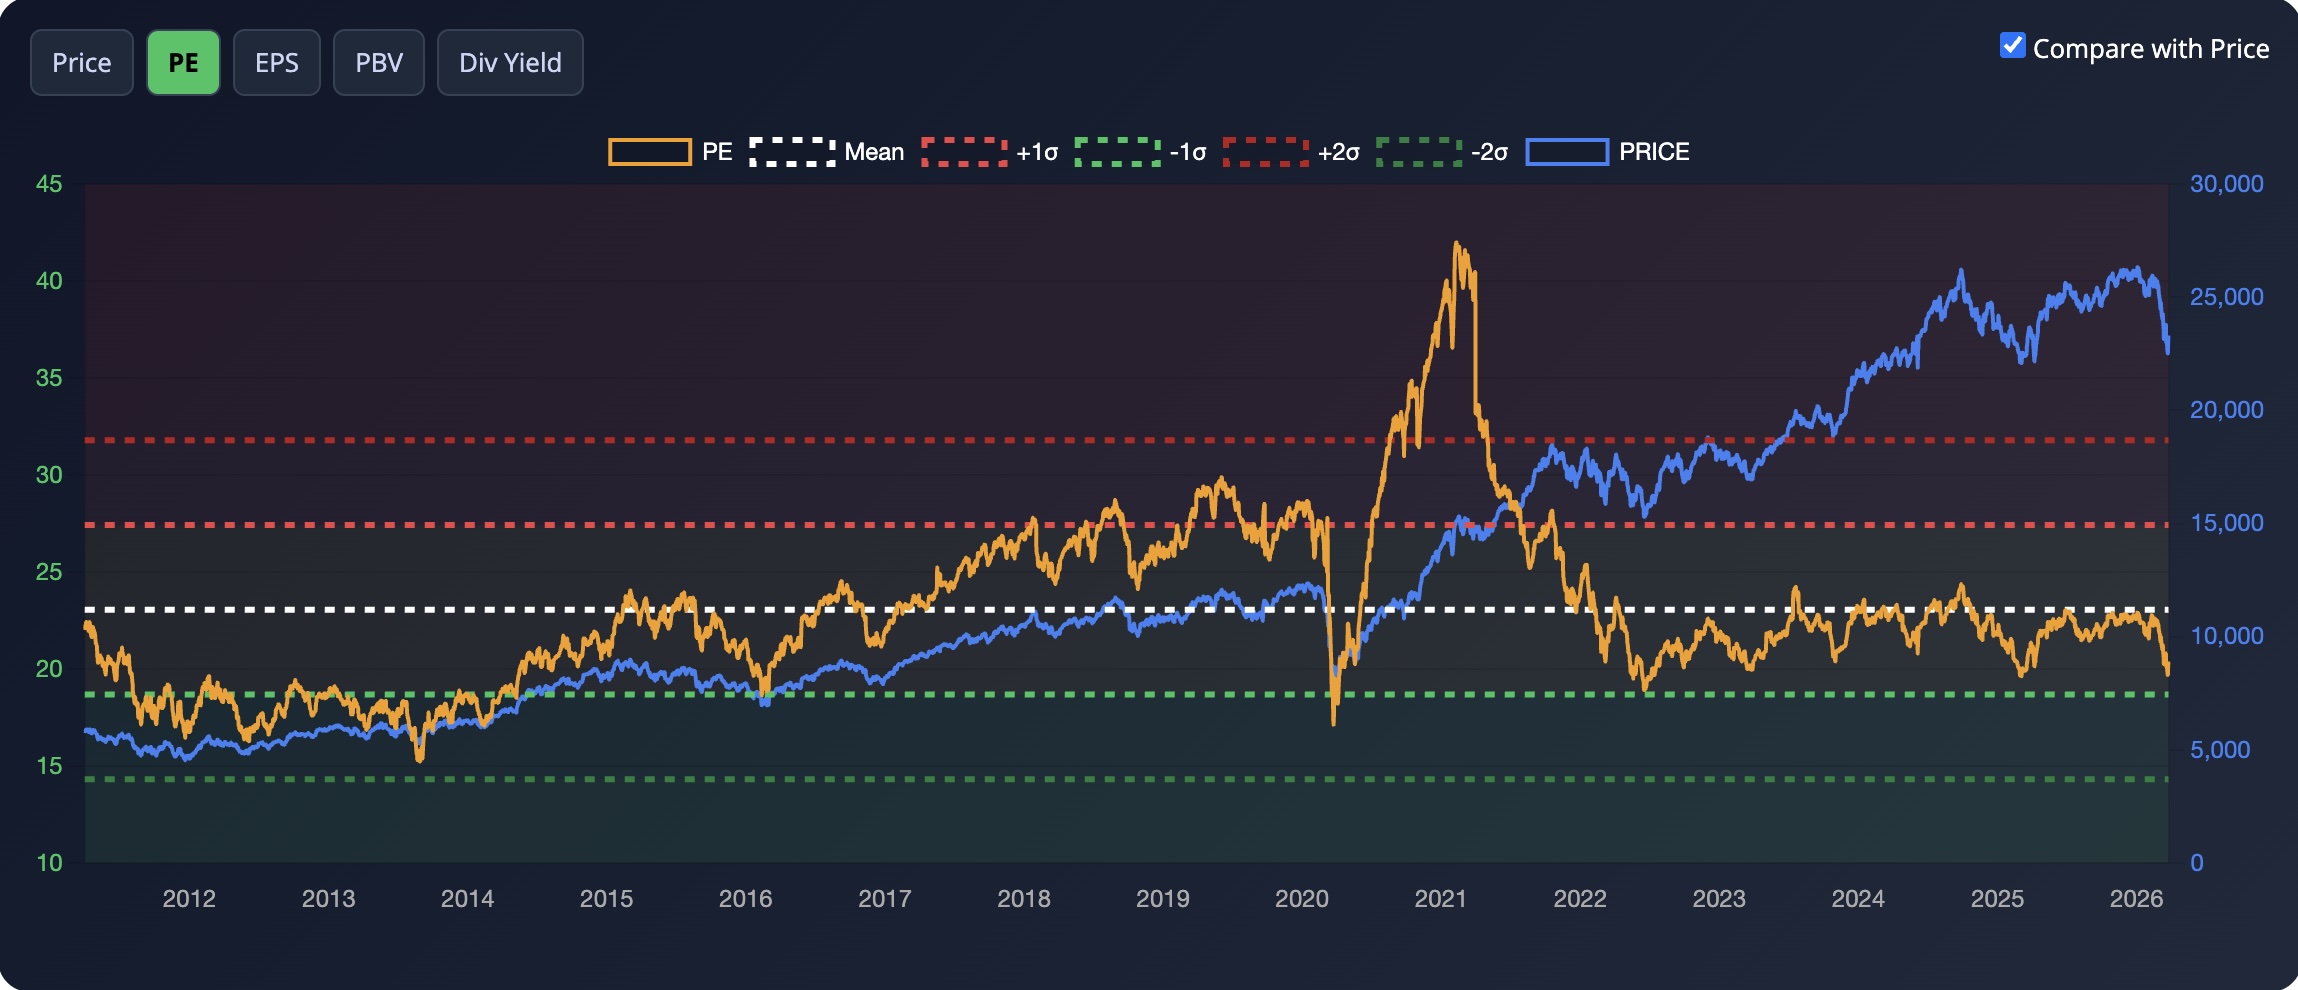
Dips in the Nifty PE ratio are often closely linked with corrections in the Nifty index price. When the market falls sharply, earnings do not drop immediately, causing the Nifty price-earnings ratio to decline.
This creates a powerful signal:
- When the current PE drops below average levels, it indicates undervaluation
- These phases usually coincide with price dips or market panic
- Historically, such zones have provided strong long-term entry opportunities
For example:
- During the 2008 and 2020 crashes, the PE of Nifty dropped sharply
- At the same time, prices were low, creating ideal buying conditions
- Investors who entered during these low Nifty 50 PE Ratio levels saw strong future returns
In simple terms:
Falling PE + Falling Price = Market Fear = Best Investment Opportunity
This is why tracking the Nifty P E ratio chart along with price helps investors identify when the market is cheap rather than just reacting to price movements.
Conclusion
Obviously, no one can predict the exact top or bottom of the market perfectly. But in comparison to the current price, EPS (Earnings per share), PE ratio live and the historical data can be helpful in the analysis process. During this investment journey, those who enter the stock market at the lower PE levels in the right instruments can have a pretty good return over the long-term horizon. Here, from the Nifty PE ratio historical and live data charts, you can easily track the levels.
So in brief, at overvalued levels, wise investors start booking their profits. And at undervalued levels, the investors may start the accumulation process.
FAQs on Nifty PE Ratio
The Nifty 50 PE ratio today reflects how much investors are paying for ₹1 of earnings of the index. It is also called the Nifty Price Earnings Ratio or Nifty Price to Earnings Ratio. Tracking the Nifty's current PE using a live Nifty PE ratio chart helps investors judge whether the market is cheap, fair, or expensive.
A PE of Nifty today, around 20, is generally considered fairly valued. Historically, the Nifty price-earnings ratio stays in the 18–22 range. At this level, investors usually continue SIPs rather than making aggressive lump sum investments.
A good Nifty 50 pe ratio today lies between 18 and 22. Below 18 indicates undervaluation, while above 22 suggests caution. Long-term investors use the Nifty Price Earnings ratio along with charts to identify better entry points.
Your manual Nifty price-earnings ratio may differ because NSE uses free-float market cap and consolidated earnings (post-2021). This makes the official Nifty current PE different from simple calculations.
Yes, the Nifty 50 PE ratio today helps in understanding valuation, but SIP investors should continue investing regularly. The Nifty P E ratio chart is more useful for adjusting allocation rather than stopping investments.
Next, Check Out Other Market Charts
- Click Here to track live Gift Nifty movement and global market sentiment before the Indian market opening.
- Click Here to analyse end-of-day technical trends and price action of Nifty 50 stocks.
- Click Here to monitor EOD movement and technical strength of Nifty Next 50 companies.
- Click Here to follow end-of-day trends and momentum in leading midcap stocks.
- Click Here to study Point & Figure trend analysis for index movements.
- Click Here to measure market breadth and sentiment using the TRIN indicator.
- Click Here to track real-time market breadth using advancing versus declining stocks.