Dow Futures are one of the most followed global market indicators, providing real-time insights into the direction of the US stock market. Traders, investors, and analysts closely monitor Dow Futures to understand overnight sentiment, anticipate market openings, and make informed trading decisions. This page gives you everything you need in one place — Dow Futures live data, technical indicators, pivot levels, and trading signals — powered by a real-time analytics engine.
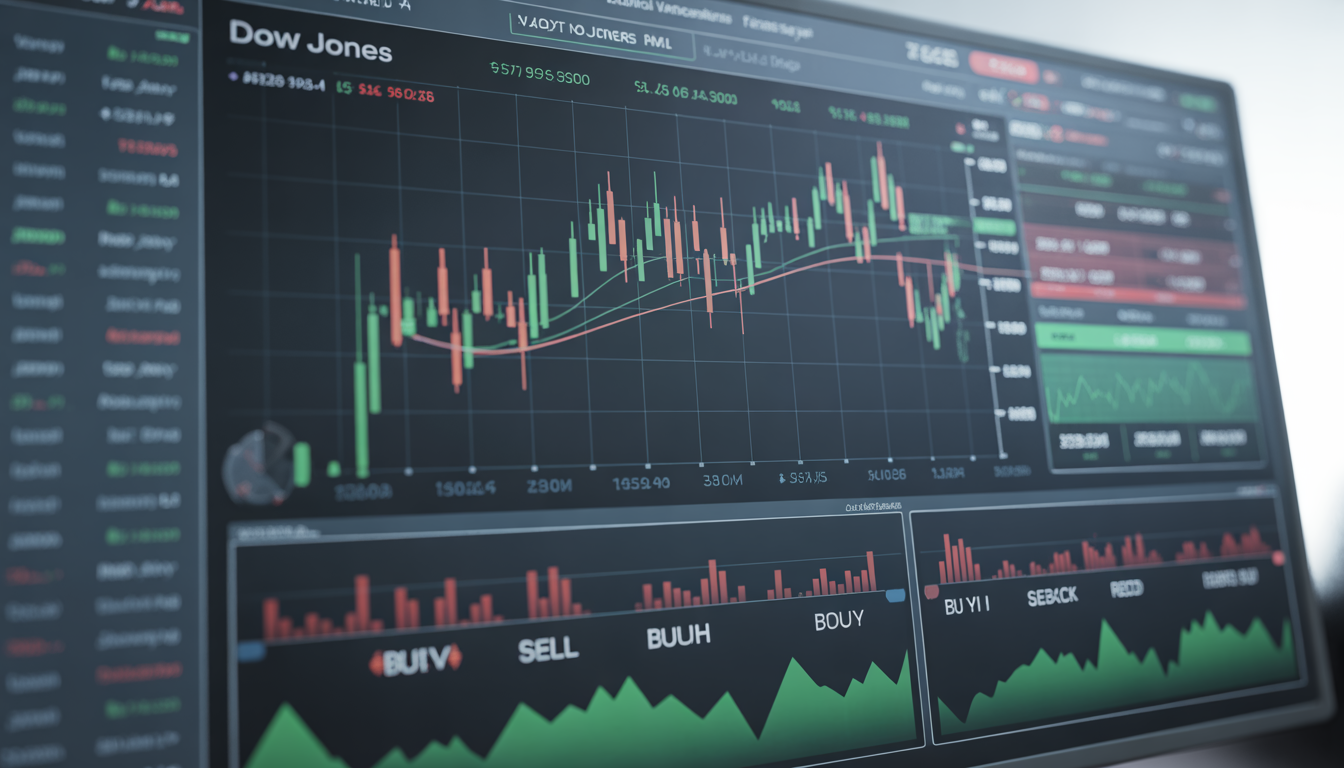
Live Dow Futures Chart
Use the chart above to switch between:
- 1 Minute (1M)
- 5 Minute (5M)
- Daily
This allows you to analyse both short-term momentum and long-term trends effectively.
Live Dow Futures Data & Signals
The dashboard provides:
- Real-time price updates
- EMA trend analysis
- RSI momentum
- VWAP positioning
- Buy/Sell signals
- Market strength
What Are Dow Futures?
Dow Futures track the expected movement of the Dow Jones Industrial Average before the stock market opens. They trade nearly 24 hours a day and reflect global sentiment, including reactions to economic data, geopolitical events, and overnight developments.
For traders, Dow Futures act as a leading indicator, helping anticipate whether markets may open higher or lower.
How to Use Dow Futures for Trading
1. Pre-Market Direction
Before the US market opens, Dow Futures give a clear indication of market sentiment. A strong move overnight often leads to a gap-up or gap-down opening.
2. Intraday Trend Confirmation
During trading hours, combining Dow Futures with technical indicators like EMA and VWAP helps confirm trend direction.
3. Momentum Tracking
RSI and price action together help identify whether the market is overbought or oversold.
4. Multi-Timeframe Analysis
Using 1-minute, 5-minute, and daily charts provides a complete picture of market behaviour.
Technical Indicators Explained
EMA (Exponential Moving Average)
EMA helps identify trend direction. When the short-term EMA is above the long-term EMA, the trend is bullish. When it is below, the trend is bearish.
RSI (Relative Strength Index)
RSI measures momentum. Values above 60 indicate strength, while values below 40 indicate weakness.
VWAP (Volume Weighted Average Price)
VWAP shows the average price weighted by volume. It is widely used by institutional traders.
Pivot Levels & Market Structure
<div id="dow-futures-pivot-widget"></div>
Pivot points are key support and resistance levels derived from the previous day’s data. These levels help traders:
- Identify breakout zones
- Set stop-loss levels
- Plan entry and exit points
Trading Signals Engine
Our system combines:
- Daily bias
- 5-minute trend
- 1-minute entry signals
This multi-timeframe approach ensures high-probability trading setups.
Signal Types:
- STRONG BUY
- BUY
- SELL
- STRONG SELL
- HOLD
Dow Futures Trading Hours
Dow Futures trade almost 24 hours a day, making them one of the most accessible instruments for global traders. The trading session typically begins in the evening (US time) and continues through the next day, allowing traders to react to global developments instantly.
This extended trading window makes Dow Futures extremely useful for:
- Monitoring overnight market sentiment
- Reacting to global economic news
- Planning trades before the US market opens
Understanding Market Bias
Market bias is a critical component of successful trading. It helps determine whether traders should focus on long (buy) opportunities or short (sell) setups.
Our system determines bias using:
- Daily trend (EMA alignment)
- Price relative to pivot levels
- Overall market momentum
A bullish bias indicates strength and preference for buying, while a bearish bias suggests weakness and selling opportunities.
Multi-Timeframe Strategy
Professional traders rarely rely on a single timeframe. Instead, they analyse multiple timeframes to confirm trends and identify high-probability setups.


Daily Timeframe
Used to determine the overall market direction.
5-Minute Timeframe
Used to confirm short-term trends.
1-Minute Timeframe
Used for precise entry and exit points.
By aligning all three timeframes, traders can significantly improve accuracy and reduce false signals.
Risk Management Techniques
Trading Dow Futures can be highly rewarding, but it also involves risk. Proper risk management is essential for long-term success.
Key strategies include:
- Using stop-loss orders
- Position sizing
- Avoiding overtrading
- Sticking to a trading plan
Always remember that preserving capital is more important than chasing profits.
Importance of Volume Analysis
Volume plays a crucial role in validating price movements. High volume indicates strong participation and confirms the strength of a move, while low volume may signal weak or unreliable trends.
Combining volume with VWAP provides deeper insights into institutional activity and market sentiment.
Global Market Impact
Dow Futures are influenced by several global factors, including:
- Economic data releases
- Central bank decisions
- Geopolitical events
- Corporate earnings
Understanding these factors can help traders anticipate market movements and adjust their strategies accordingly.
Advanced Trading Concepts
Breakout Trading
Occurs when price moves beyond key support or resistance levels, often accompanied by increased volume.
Pullback Trading
Involves entering trades during temporary price retracements within a larger trend.
Trend Following
Focuses on identifying and trading in the direction of the prevailing trend.
Key Levels to Watch Daily
Each trading day presents new opportunities based on key price levels. Monitoring these levels can help traders make informed decisions.
Important levels include:
- Previous day high and low
- Pivot point and support/resistance levels
- VWAP and moving averages
These levels act as decision zones where price reactions are likely.
Intraday Trading Strategies
Intraday trading with Dow Futures requires quick decision-making and precise execution. Traders often use short-term charts and indicators to capture small price movements.
Popular strategies include:
- Scalping
- Momentum trading
- Breakout trading
- Reversal trading
Each strategy has its own risk profile and requires discipline.
Final Thoughts
Dow Futures are an essential tool for traders looking to stay ahead of the market. With Dow Futures live real-time data, advanced indicators, and a powerful signal engine, this page provides a complete solution for analysing and trading Dow Futures.
Stay updated, trade smart, and use data-driven insights to improve your trading performance.