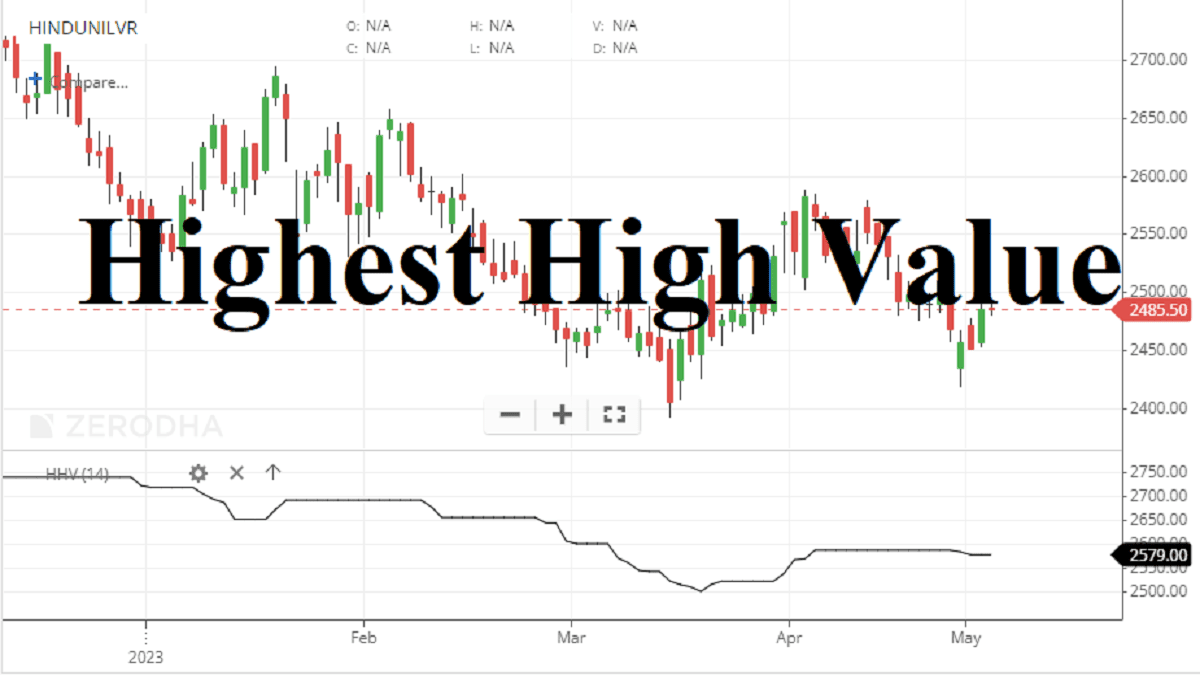
Highest high-value indicator or in short form HHV means that the stock has hit an all-time peak since it is listed and it indicates that there is big demand at that particular time for that particular stock. In this indicator, the default period is 14. The Highest High-Value indicator returns the highest high price over user-defined n-periods.
The Formula of Highest High-Value Indicator (HHV):
Highest High Value = Maximum (High) of N−periods
How to Attach the HHV Indicator on Charts?
Adding the HHV Indicator on Zerodha Kite
Traders can know more about the Highest High-Value indicator than they can find in the Zerodha Kite. It is also available in Kite Mobile App. The Default Period is 14. The traders can also Check the image below to understand how to attach the Highest High-Value indicator in the HDFC Bank share price chart below. The indicator can be used in any time frame chart such as daily, weekly, intraday, or monthly.
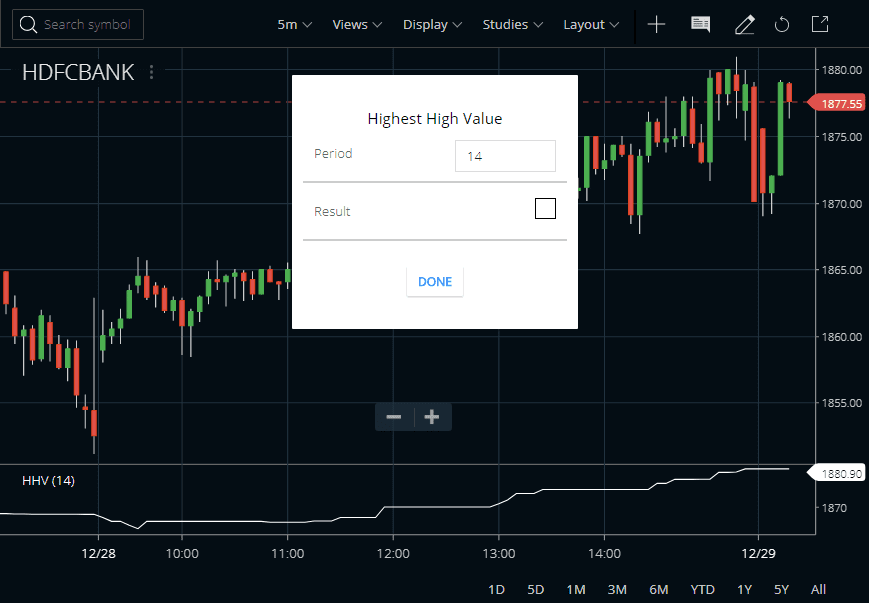
The more the price of a security increases this technical indicator makes steps and moves up. In the same way, the indicator moves down in steps when the price of the security moves down gradually. The Highest High-Value function is especially useful for creating trailing stop loss formula.

The Highest High and Lowest Low are the same types of two technical analyses that plot the highest and the lowest asset price over the price chart in the form of two lines.
Highest High Value in Amibroker
There is an HHV function in the AmiBroker function reference. The default usage of the same is HHV(ARRAY, periods). This function is especially helpful in creating trailing stop loss in the AmiBroker platform.






Highest High-Value Metastock
Metastock software also has a default HHV() function. It returns the highest value of the data array over a specified period. You can code trading strategies using this indicator in Metastock too.
How to Use the Highest High-Value Indicator?
HHV and LLV, these two simple yet effective indicators can turn into a powerful trading system when combined. The two can be used on their own or as a supportive tool, that confirms or refutes the signals sent by different indicators. They can hint at potential reversal points, and help traders estimate the probability of a trend reversal and the likeability of a sudden price move.
The idea behind the indicators is not only similar but also quite simple. The Highest High returns the highest price observed over the course of several periods. Lowest Low, in its turn, shows the lowest price observed over the number of periods. Indian stock brokers at present are only offering the HHV indicator on the charts. You can adjust the number of periods when setting up the indicator. The longer the period, the longer the last observed highest/lowest price will dominate the chart. This is true for both indicators.
Using as a Price Channel
How exactly would one use the Highest High and Lowest Low in trading? Due to their nature, the Highest High and Lowest Low are perfectly suited to serve as a dynamic price channel. In the TradingView platform, one strategy is available on this setup. A price channel is a corridor inside which the asset price will move while the current trend is prevalent. When the trend changes, the price channel will follow. Usually, the price channel is confined by two parallel lines. Certain indicators — like this one — can create price channels of their own.
One main way to use the indicators is as follows. When the price fluctuates within the price channel, the trader would observe and wait for a trading opportunity to present itself. When the price, however, leaves the price channel, one of the two can be expected: 1) it will either continue moving in the same direction, setting new highs or lows or 2) or it will rebound and return back to the channel. Now, to the tricky part. It is not always easy to tell which one will happen once the price action reaches the Higher High / Lower Low lines. It is up to you to learn to distinguish between a breakthrough and a rebound, the difference that can make or break a lot of deals.

As you can see, the actions, taken by traders in both cases are the exact opposite. It is crucial, therefore, to tell a rebound from a breakthrough. But there is one thing that can help: confirmations. When spotting a candle that closes on one of two lines, wait for two more candles to close in order to receive confirmation. Judging by these two candles it will be easier to estimate the future price movement.
The major drawback of this setup is in Indian charting platforms like Zerodha Kite etc, you can not attach both HHV and LLV in the same window. So implementing this trading strategy is still complex.
Using the Highest High-Value Indicator with Other Indicators
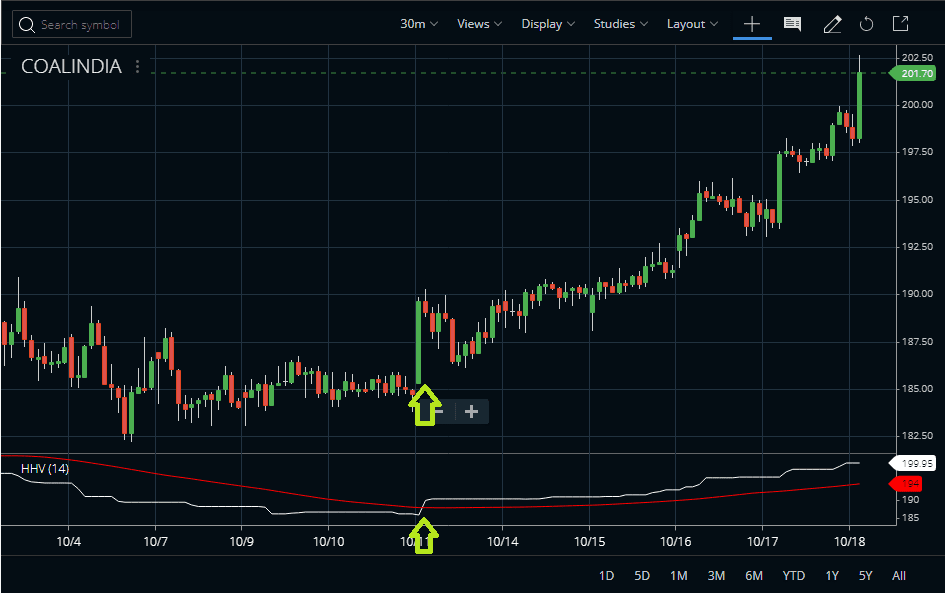
As stated above, it is also possible to combine the Highest High and Lowest Low with other technical analysis tools. No matter what traders use, try to find something that goes together well. As an example, I have tested a simple moving average of the Highest High-Value indicator. Buy when the HHV crosses the moving average on the upside and sell when it crosses the moving average back on the downside. I have tested that this generates some good and stable signals.
FAQs on HHV Indicator
The Highest High and Lowest Low (HHL) indicator is a technical analysis tool that uses past price action data to identify possible reversal points in the market. It provides traders with an understanding of where important resistance or support levels might be located in order to better time entry and exit points for trades.
There is no one single most successful trading indicator as different indicators have different strengths and weaknesses depending on a trader’s particular needs. That said, some commonly used indicators include Relative Strength Index (RSI), Moving Average Convergence Divergence (MACD), Bollinger Bands, Ichimoku Cloud, Stochastics, Williams % R, etc., all of which can be useful when combined with other strategies such as risk management.
The 4 main categories of common technical analysis indicators are Momentum Indicators, Trend Following Indicators, Volatility Indicators, and Volume-based Indicators. Momentum indicators measure how fast prices move up or down over short periods; trend following attempts to capture trends; volatility measures how quickly prices change direction; and volume indicates buying/selling pressure behind certain moves in price.
It depends on what you consider ‘best’: whether it’s accuracy within a specific range or outperforming other popular methods when tested against historical data set samples. Generally speaking, there are many common ones like Moving Average Convergence Divergence (MACD), Relative Strength Index (RSI), Bollinger Bands, and Money Flow Index that traders rely heavily upon. But only through testing them against your own methodology could you decide which works best for you.
Conclusion
The Highest High-Value indicator plots the maximum high of a security over a specific period. This is a trend-following indicator and follows the price action. This Indicator can be used with other trend-following indicators to create a trading system.