When we talk about the technical analysis of stocks, webs of indicators come into our minds. A section of retail investors believes that without applying technical indicators, an accurate analysis of a stock cannot happen. They are wrong to some extent. There is a quite popular way by which one can analyze stocks without applying any study. It terms as Price Action. This market movement strategy works solely without applying studies. This article will provide you with guidance regarding this strategy and the steps to identify it.
Firstly, let’s have a quick look at the definition of Price Action, then we will go for features, examples, and strategies of this specific tool.
What is Price Action?
In simple terms, the Price Action strategy is based on the actual price movement rather than relying solely on indicators. The price movement analysis depends on the recent past and current price changes. This particular technical tool helps traders to identify market trends and sentiments. One of the main reasons for applying the price behavior is it is less time-consuming and a quickly generates profit-maximization tool.
Generally, in price action, a candlestick chart works as a base, the candle’s type, size, and OHLC bar are the significant factors here. Over the years many analysts who write about this technique, categorize the strategies and observations in a proper way.
Features of Price Action
- The market price chart reflects price movements that are caused by economic variables. Therefore, instead of analyzing economic variables, we can simply apply the price action analysis method. This will help to identify the price action, created by the market variables.
- These analysts search for a favorable entry and exit point by using charts along with real-time rates data like bids, offers, volume, velocity, and magnitude.
- It not only identifies the extry-exit point but also provides valid guidance regarding support and resistance level. In order to execute a trade, you need to search for support and resistance levels first to find out its intrinsic value of it.
- It’s a less complex analytical platform in technical analysis. Besides this, as it is free from indicators complexity, consumes less time than other technical tools.
- By applying this, the bearish and bullish trends can easily be identified.
- The tool is widely used in equity, commodity, forex, etc.
Price Action Strategies Every Trader Should Know About
Breakout Strategy
Among various price action strategies, it carries a significant role. If a price move is in a certain direction and suddenly a breakout happens, at that point, traders become alert about the upcoming trend or future direction of the price action. In order to make your eyes comfortable with the breakout strategies of price action, you need to understand certain chart patterns very thoroughly. These patterns include Triangle, Head and shoulder, and Flag Patterns.
False Breakout Strategy
The strategy is exactly the same as it sounds. A breakout that failed to continue a certain pattern. It can be considered as a ‘deception’ by the market. It looks exactly like the price will break out the previous pattern but then after a short time, quickly it reverses. Therefore, it is advisable to take advantage of the false breakout strategy rather than falling victim to them. Pin bar patterns or fake patterns are some of the common false breakout appearance signals.






High-Low Strategy
This strategy is one of the most vital trading strategies in price action. Today we will cover this strategy with examples but before that let’s have a quick look at the brief description regarding this. The strategy covers high-low-price action with a certain pattern. We will get back to you with this particular strategy in detail later.
Support and Resistance Zone
This is the most tricky zone in the charts. Some traders just use single lines to trade in support and resistance levels but ultimately these lines are of no use. Hence, instead of drawing single lines, specific zones should be created. By creating specific zones on the support-resistance level, traders will not miss trading opportunities.
Price Level Strategy
Based on the previous price level, creating a new support-resistance level plays a vital role in trading. You need to find out the proper location on a chart and from this search for the current entry-exit signal. In order to avoid loss in trading, finding a good location along with a mature signal is very much necessary.
Candlestick Pattern
By following different candlestick patterns traders can work in price action. In candlestick patterns, the length of tails, bullish-bearish candles, the position of the body, and the position of candles can guide traders to identify high trading opportunities.
Higher High and Lower Low Trend Identifying Strategy
As I have stated above that we will cover the High-Low strategy of price action in detail with an example. Here, we come up with an example of the Nifty50 index where we will show you how this strategy works. In order to clarify the subject, we attach images below:
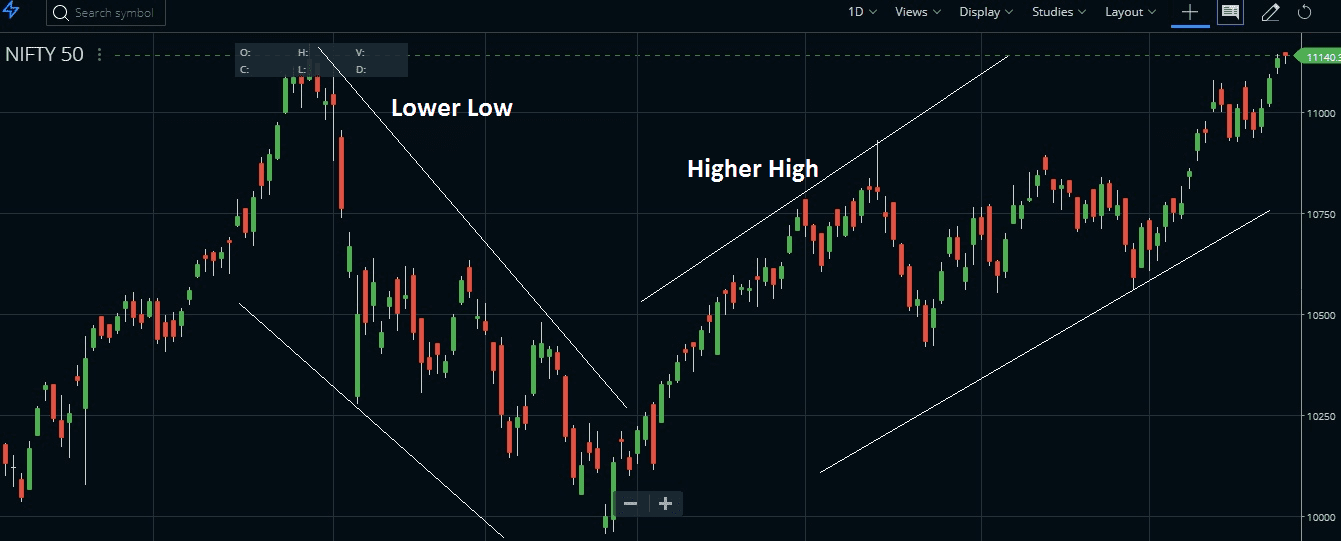
The above chart is the 1-day chart and the below is the 15 min chart of Nifty50.
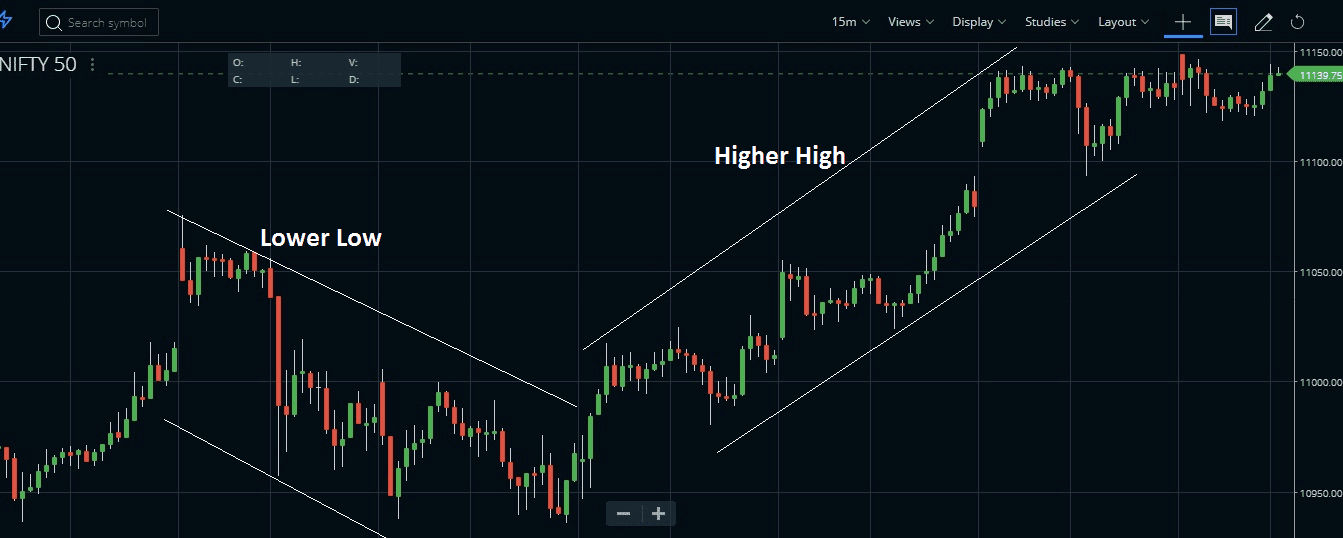
As you can see in both charts, the first half is composed of a lower low while the 2nd half is composed of a higher high pattern. Lower low consists of Lower high and lower low and Higher-high consists of Higher high and higher low. Here in this example, during the continuation of the lower low, a higher high comes suddenly. As a result, the market reverses and moves towards a bullish trend with a higher-high pattern. Therefore, lower-low represents bearish movements while higher-high helps to identify a bullish trend.
PDF Guide on Price Action Strategy
Besides this, if you want more information regarding this, you can get our free guidebook. Just click here to download the free guide.
FAQ
Yes, price action is an effective and reliable trading strategy that has been used by many successful traders. It involves using historical prices to determine the future direction of the stock market. By being aware of past patterns in stock markets, you can better predict where the market may be headed in the future.
Price action trading is a technical analysis method that relies on patterns from previous market data, such as candlestick charts and chart patterns, to identify potential trades and make decisions based on those findings rather than relying heavily on indicators or other forms of technical analysis. It typically involves taking signals generated by certain types of structures in the chart rather than relying only on support/resistance levels or trendlines as some traders do when using traditional methods.
There are many experienced and successful traders who use price action trading; it’s hard to say who exactly would be considered “the best”. However, some notable names include Jesse Livermore, George Soros, William O’Neil, and Linda Raschke, all of whom have made significant profits from their use of this approach over time.
The specific elements included in a particular trade (entry/exit points) will vary depending on the individual trader’s preferences; however there are general principles that most practitioners follow when setting up these types of trades which could be seen as constituting an overall “price Action Formula” – including establishing Risk Management Rules (stop losses & take Profit Targets), recognizing breakouts/consolidation periods, identifying Support/Resistance Levels, etc.
Conclusion
In conclusion, price action is a powerful tool for evaluating the markets and can provide an edge to any trader’s arsenal. Despite its power, implementing it correctly takes some practice and research in order to understand the nuances associated with the strategy. With enough dedication and effort, however, traders of any skill level may be able to use price action methods to their benefit when entering or exiting markets.