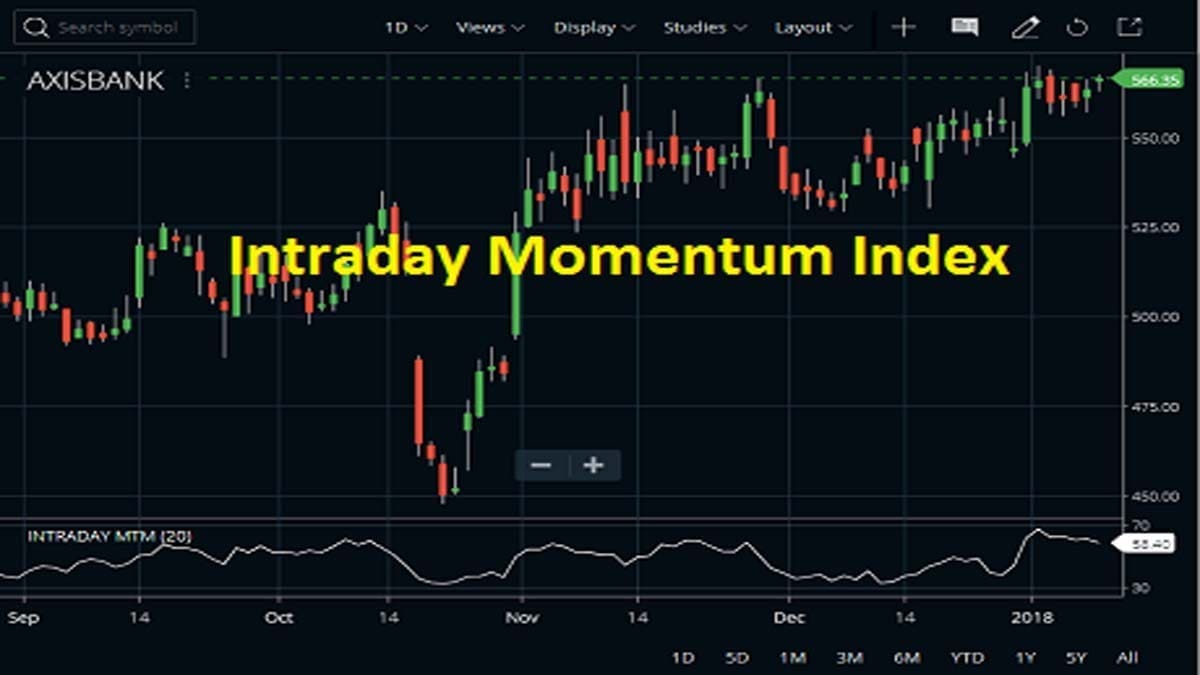
Tushar Chande first developed the Intraday Momentum Index (IMI) in his book “The New Technical Trader“. The indicator belongs to the oscillator family. Traders found the indicator almost similar to RSI or Relative Strength Index. I will discuss the similarity later. First, let’s break down the definition of the indicator first. Then we will move toward the calculation and profit-making strategies of the indicator. It is basically useful for short-term traders rather than for long terms. Day traders find it more useful.
What is Intraday Momentum Index?
The Intraday Momentum Index (IMI) is a technical indicator that cross-breeds between the Relative Strength Index (RSI) and candlestick analysis. Tushar Chande developed the indicator. It provides investors with potential buying and selling days based on signals created on individual days. Investors are using this technical indicator to estimate when a stock should be bought or sold.
How do We Calculate Intraday Momentum Index Indicator?
The calculation of the Intraday Momentum Index is very similar to the RSI. We can calculate the indicator as to the sum of gains on up days/the sum of gains on up days + the sum of losses on down days. After that, multiplied by 100.
Now, if the resulting number > 70 then the security is overbought. Oppositely, when a figure<30, it is oversold. The traders will look at the IMI over a specific period of days, with 14 days being the most common time frame to look at.
Intraday Momentum Index = 100 * (upsum / (upsum+downsum))
How to Open Intraday Momentum Index on Charts?
Here, I will guide you on setting up the IMI indicator on charting platforms. I’ve taken Zerodha Kite and Upstox Pro to set examples for it. Setting up the IMI on Charting platforms is quite easy. So, first, let’s start with the Zerodha kite chart, then I will move on to Upstox Pro.
IMI Indicator on Zerodha Kite Chart
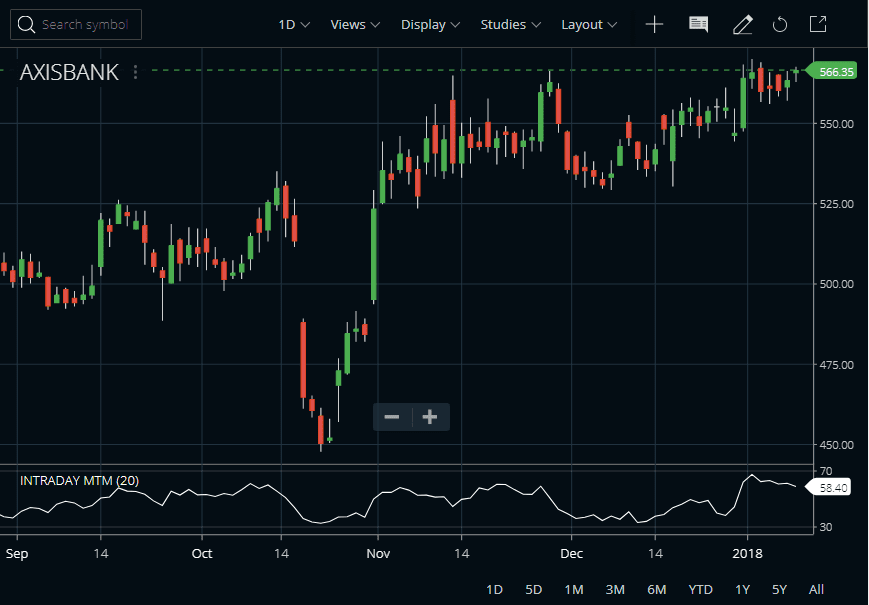
This technical indicator can be attached to the Zerodha Kite charts from the STUDIES section. Just type the name of the indicator and it will appear. Then click on Done and you’re ready to go.
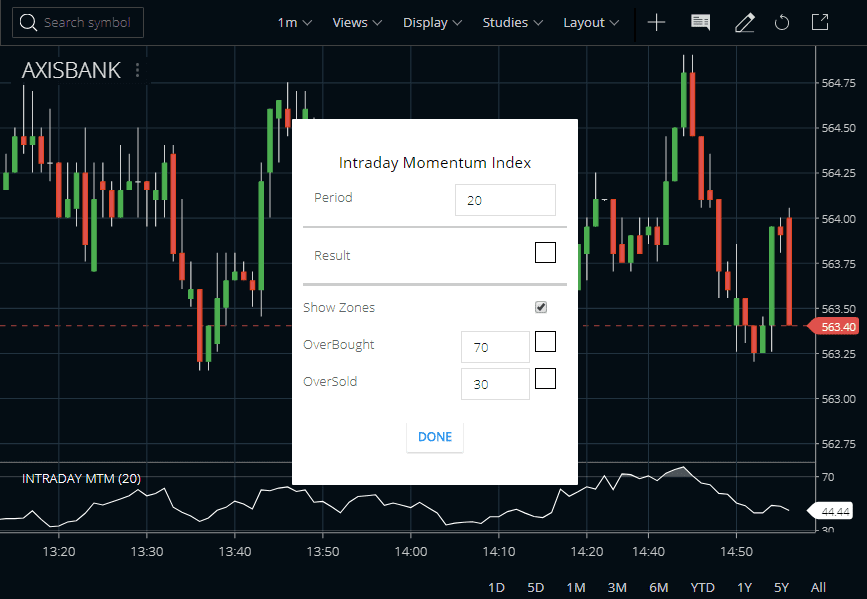
As shown in the image, the default parameter of the Intraday Momentum Index is 20 and you can also set the overbought and oversold levels. The investor will look at the indicator over a look-period of days, with 20 days being the most common time frame to look at. In all overbought or oversold indicators, this indicator too should first quantify the trendiness of the market before acting on the signals.
IMI Indicator on Upstox Pro
Setting up the IMI on Upstox Pro is similar to Zerodha kite. First, open any chart of security, then search for the indicator. Finally, place it by clicking on Apply. Here, also, you can customize the section as per your wish.
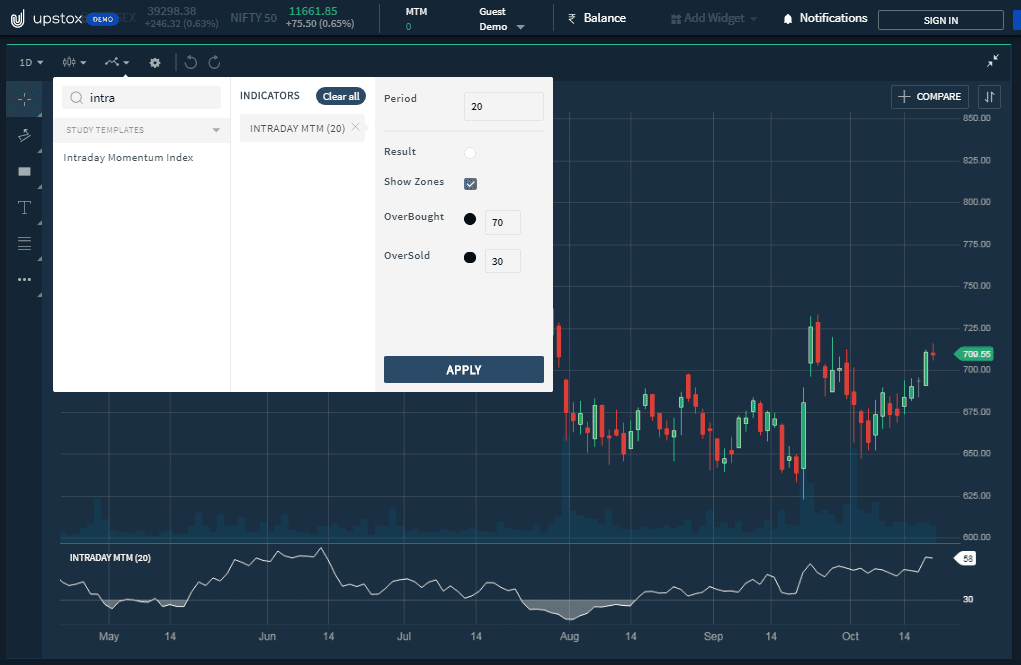
The overbought and oversold categories are customizable too.
Features of the Intraday Momentum Index
- The IMI is a technical indicator that combines candlestick analysis along with the relative strength index to provide insights.
- The indicator looks at the relationship between a security’s opening and closing price over the course of the day, rather than how the open or close price varies between days.
- Technical analysts can use the IMI to predict when security is overbought/oversold.
- The results from the IMI measure are scaled between the range of 0 and 100.
- It takes one input parameter which is the number of periods used to construct the up and down price change averages.
Trading Strategies for Intraday Momentum Index
- It uses the relationship between the intraday opening and closing prices to determine whether the day is “up” or “down”.
- In this indicator, if the close is above the open, it is an up day and close is below the open it is a down day.
- Generally, intraday Momentum Index values above 70 indicate a potential overbought situation with lower prices ahead. On the other side, values below 30 indicate a potential oversold situation with higher prices ahead.
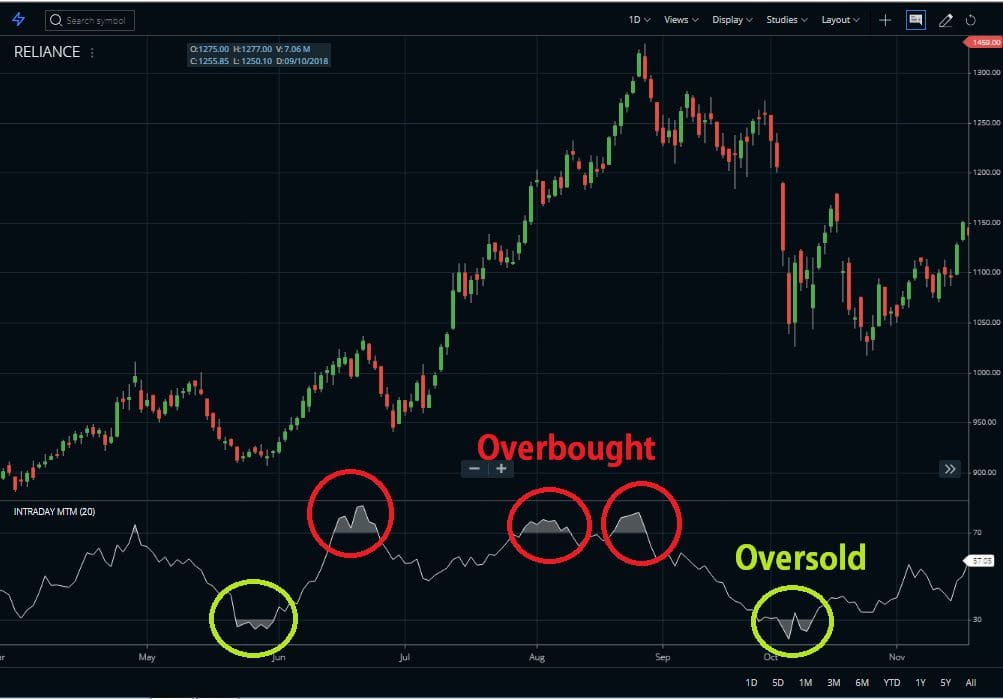
- The divergences between the indicator and the price action. In this, if the price trends are higher (lower) and the Intraday Momentum Index trends are lower (higher), then a reversal may be imminent.
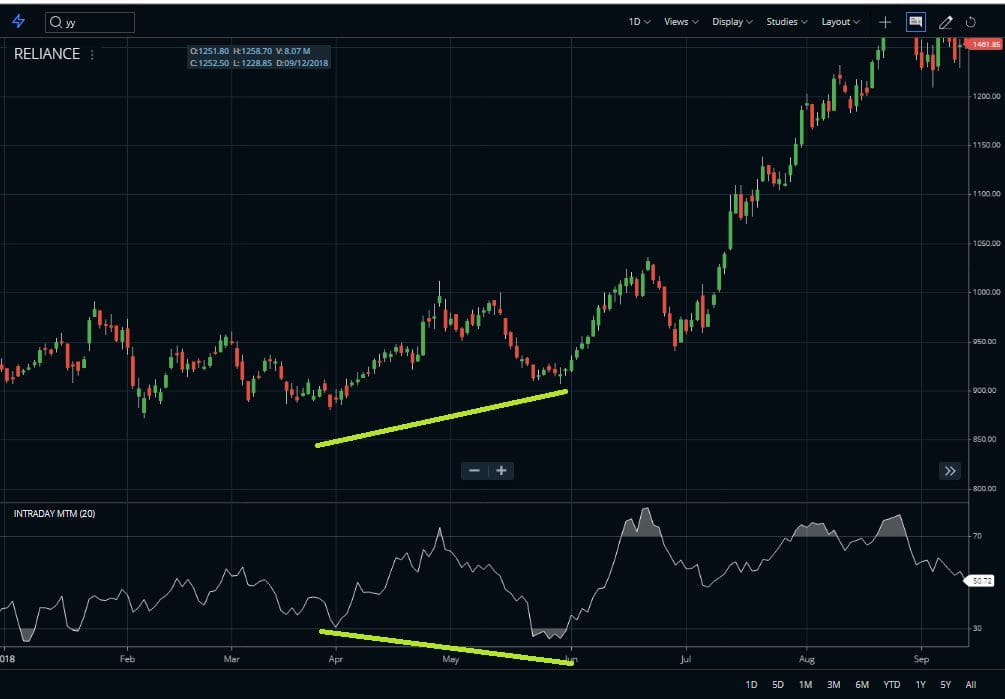
- See the above picture, there you will get a dissimilarity between price action and IMI indicator. The highlighted area shows in comparison to the price, IMI drops down more at the oversold levels. After the dissimilarity, the price started to move in an upward direction.
- The price can stay longer in the levels of overbought/oversold.
- Another strategy is the breakout strategy. Here, the indicator line went through a particular range. And, once the range is broken, there is a chance of an uptrend.
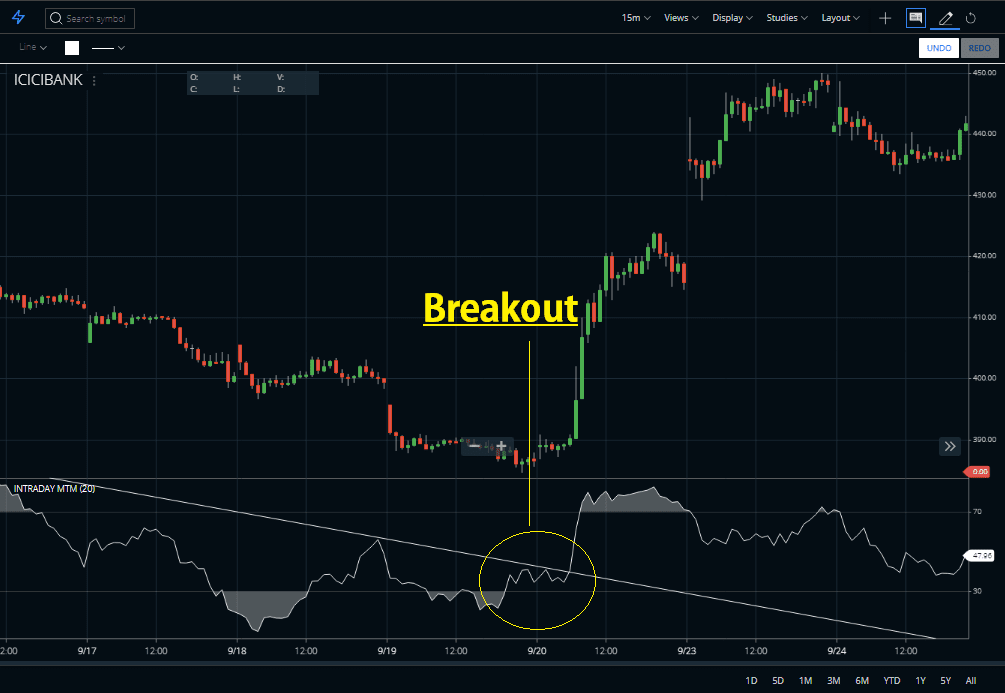
- In the above chart, I draw a trendline by connecting two peaks of the IMI indicator. It is showing that once the IMI breaks the trendline, the price went in an upward direction.
- However, besides the above information, there are others too. Traders sometimes use the indicator or oscillator to identify the support and resistance levels.
FAQs
The Intraday Momentum Index (IMI) is a technical indicator that provides a measure of the amount of price change on an intraday basis, combining volume and direction to generate trading signals for active traders.
Many technical analysts believe that the moving average convergence/divergence oscillator (MACD), along with other popular indicators like relative strength index (RSI), stochastic oscillators, and Bollinger Bands are among the most reliable for pinpointing turning points within intraday trends.
This question can’t be answered as there isn’t any single “no. 1” indicator when it comes to success in intra-day trading; different clients’ needs may lend themselves to favoring different types of indicators and strategies based on risk tolerance and personal preference.
The IntraDay Momentum Strategy involves using technical analysis and indicators such as MACD, RSI, Stochastic Oscillator, etc., together with volume data to identify entry & exit points in markets at precise times during an intra-day session to gain maximum profits from short time frame trades or scalping returns quickly over shorter time frames or days rather than longer-term investments over weeks or months.
Conclusion
However, I must say one thing, if you use the IMI along with other indicators, the accuracy level will be better. Like, with the IMI, you can use Moving Averages (SMA, EMA, etc). Apart from this, SuperTrend is also another way to increase the effectiveness of IMI. Without examining the stock’s fundamentals, one can easily analyze and predict the price movement by it. Here, in this article, I’ve shown you the default settings. If you want, you may set the period and overbought/oversold level as per your requirement. The basic strategy is quite simple and easy to understand but for more accuracy use advanced ones.