Average True Range indicator or ATR is an indicator that shows the historical volatility of a stock’s price over a specific period of time. ATR shows the historical range of price movement over a specific time period. ATR Trailing Stops is an extension of ATR where the basic idea of ATR has been used to create trailing stops to help the trader to make better entries/ exits. Zerodha Kite and a few other recent trading platforms plot this indicator for traders.
How to attach the indicator on charts?
Attaching ATR Trailing Stops indicator on Zerodha Kite
- Login to Zerodha Kite.
- Open your MarketWatch.
- Choose the stock you are going to trade.
- Right-click on the stock and select chart from graphic icons.
- The chart window of the stock opens.
- Go to studies. Select studies.
- Go to ATR Trailing Stops and click on it.
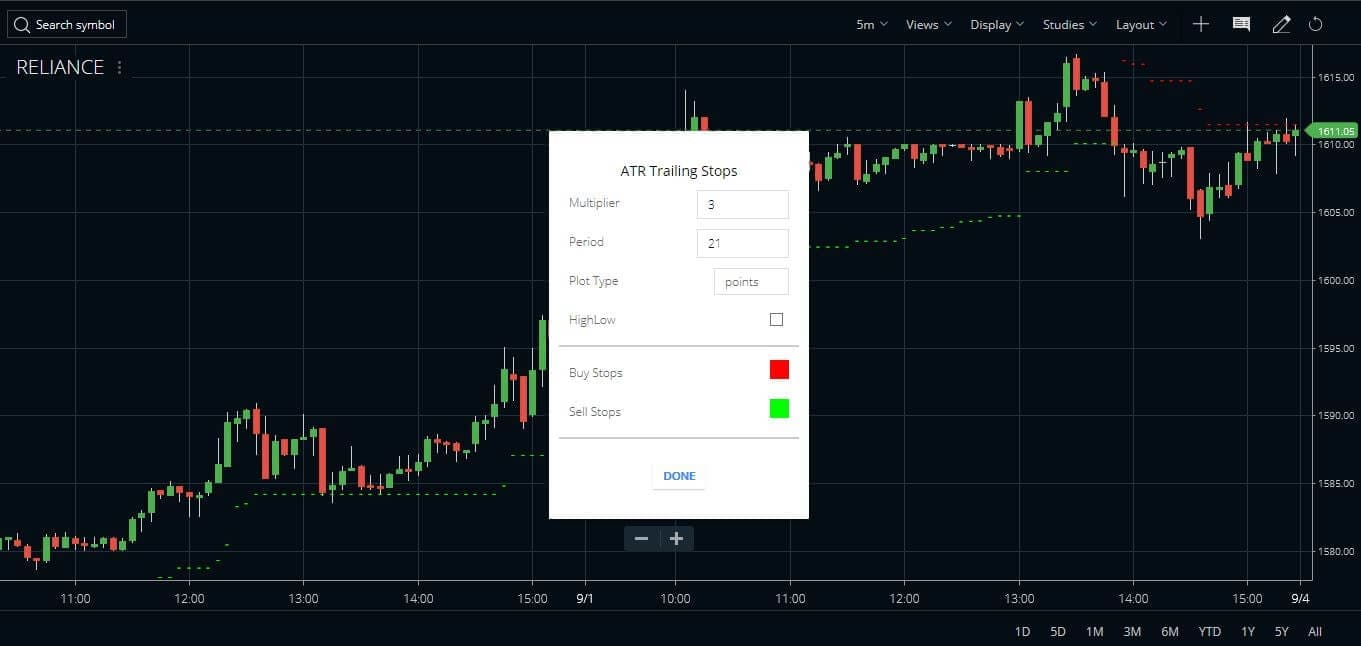
- A small window opens with the default parameters of the indicator.
- The default parameters are Multiplier – 3, Period – 21, Plot type – points, HighLow, Buy & Sell stop loss (colored).
- We can also customize all these parameters to suit our demands.
- Once we select the parameters and choose the Done command, the parameters window goes off the screen
- The indicator is plotted on stock price with buy-stop loss in green color dots and sell-stop loss in red color dots.
- But by default, this indicator will generate a signal when the close price breaches the stop line. But you can change it to High Low mode. In that case, if the high or low of any candle breaches the stop line it will generate a reverse signal.
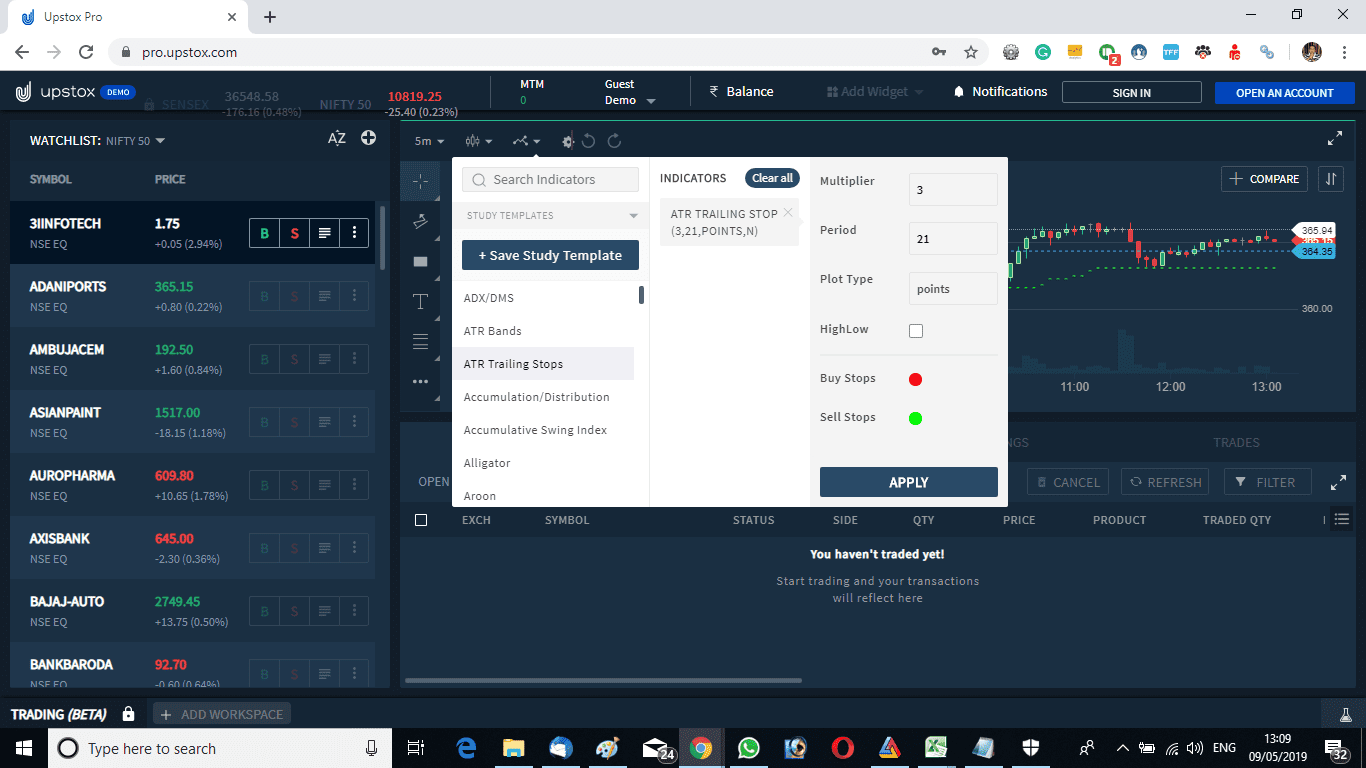
Attaching ATR Trailing Stops indicator on other terminals
Just like Zerodha Kite, this indicator is available in other terminals like Upstox Pro, etc. Watch the image below to understand how we attached the indicator in the Upstox platform on the Adani Ports shares price graph. The parameters are just as same as the Zerodha platform.
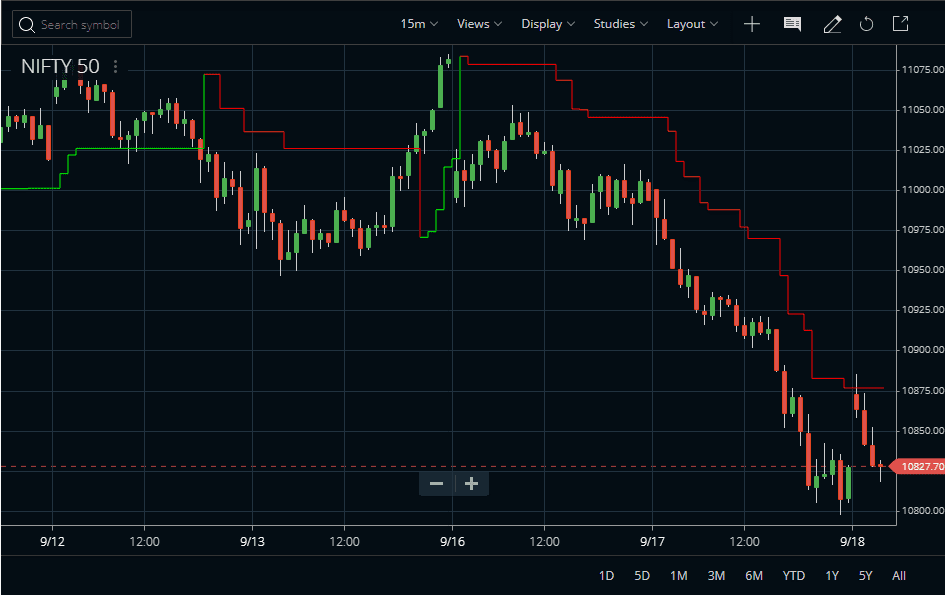
Plotting the ATR Trailing Stops as Points or Squarewave?
ATR Trailing Stops can be plotted in two ways. Points or Squarewave. The points version will show the stop line as dotted. But the squarewave version will show it as a straight line and the stop will move in a staircase. The above two images show the stop in the Points version. Check the image below to know what it looks like in the Squarewave version.


How to trade with ATR Trailing Stops?
Use as Buy-Sell Signals
- The trading strategy with this indicator is the same as the SuperTrend indicator.
- Buy the stock when the sell-stop loss (red line) is taken off and the price close above the red line.
- Similarly, one should exit the current buy position once the buy stop loss or green line is taken off.
- Enter the short sell when the buy stop loss (green line) is violated and exit short sell when the sell stop loss is taken off.
- This is a stop and reverse system and one can take a fresh buy position at this point maintaining the trailing stops.
- It is a stop-and-reverse system, hence, this system will always keep the trader in a position
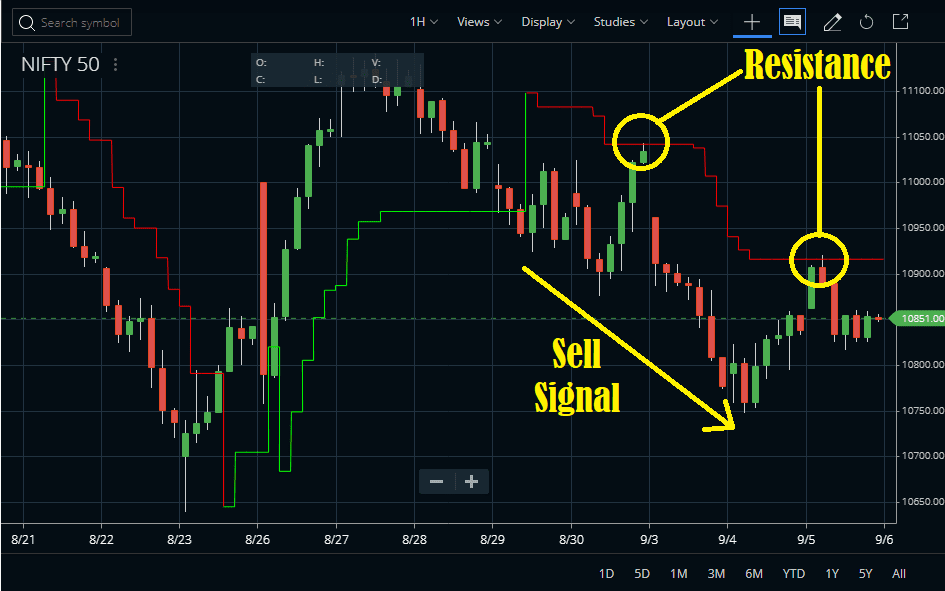
Use as Support and Resistance
The ATR Trailing Stops can also act as strong support and resistance. Many times we have seen prices bouncing up or down exactly from the indicator lines. Check the image below.
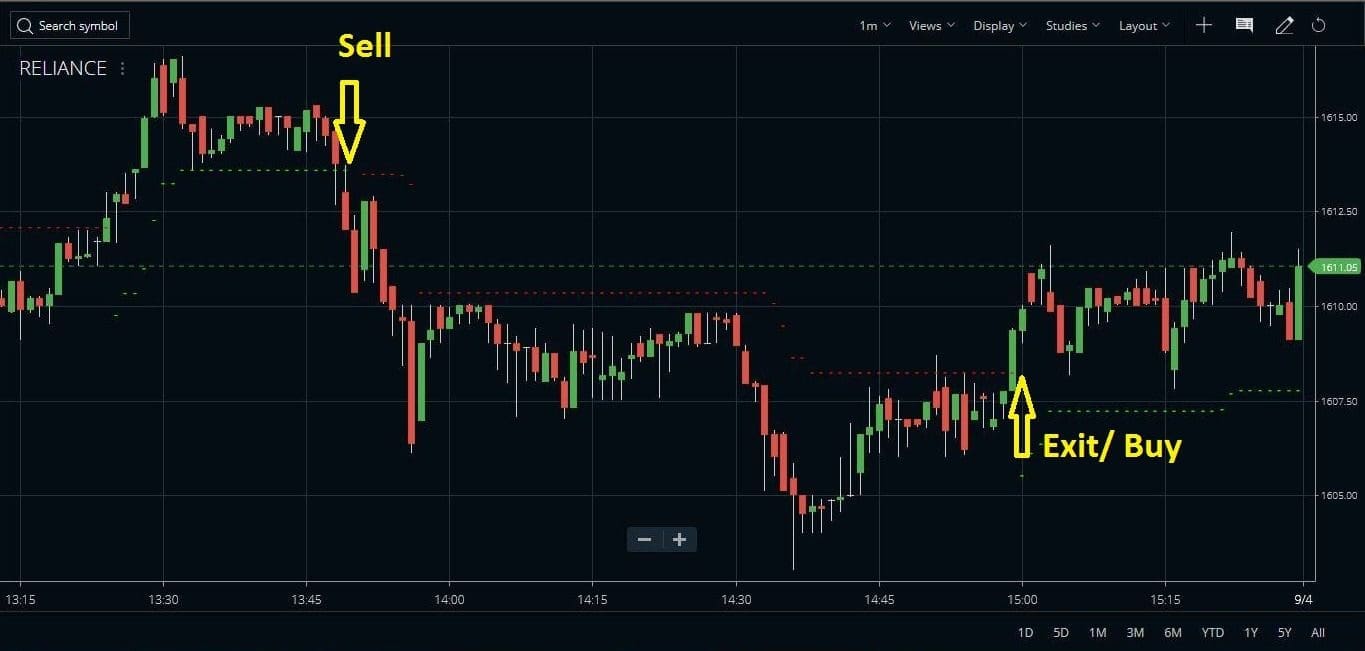
Simple stop and reverse system
- The indicator works well in all time frames.
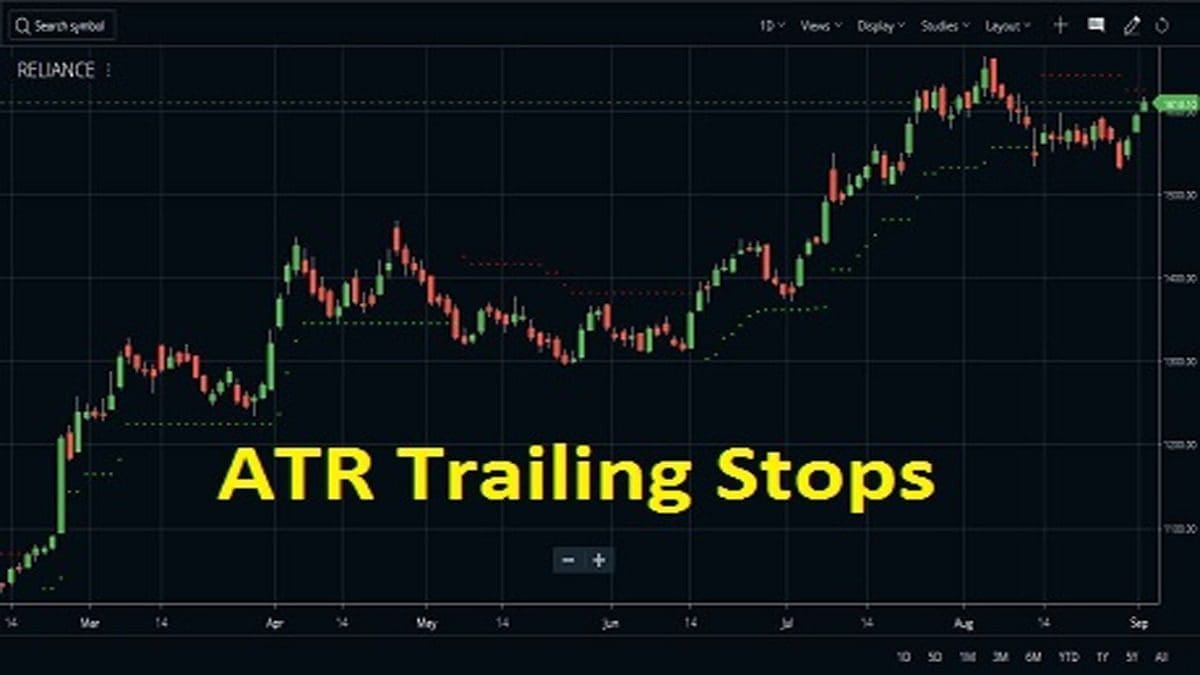
- The picture above shows Reliance stock price movement with ATR trailing stop indicator.
- The chart shows 1 min. timeframe.
- The indicator creates a stop position when the price goes below buy stop loss.
- The short position is closed when the stock price goes above the sell-stop loss.
- With the closure of the short position, we can also create a buy position at this point.
- A trader is always in a position, the buy position is closed and a short position is created and again the short position is closed and a buy position is created.
- In live trading, a trader needs to close the trade and enter the reverse trade by always sending double quantity orders in the system.
- As an example, suppose we have 75 quantity Nifty futures buy position. To close the buy trade and enter the short-sell trade we need to short-sell 150 quantity Nifty. Out of that, 150/2 = 75 quantity will close the buy trade and the remaining 75 quantity will enter the short sell trade.
Suggested reading
We suggest going through the video course Trailing Exits: Using Average True Range to Set Profit Targets (Wiley Trading Video) by Charles LeBeau.

Common FAQ
The ATR trailing stop is calculated by multiplying the average true range by some pre-defined multiplier. We can optimize the indicator by either changing the value of the ATR or by changing the value of the multiplier. The stop will keep trailing, i.e. it will move up or down with the price.
We can multiply the ATR by some multiplier. As ATR is dynamic, i.e. changes with time and price, the multiplied product will also be dynamic. We can use that multiplied result as a stop loss. As an example, we can multiply 21-period ATR by a multiplier of 3 and that can act as a stop loss.
The fixed stop does not change with the price. But the trailing stop loss will change with price. For example, a trader bought Nifty Future at 10800 and he keeps 20 points protective-stop at 10780. Now he decides to raise his stop loss by 10 points, with every 10 points up-move of price. So when the price reaches 10810 the stop moves to 10790. Similarly, when the price moves to 10820, the stop moves to 10800, and so on. If the trailing stop gets hit, that marks an exit from the buy position. This trailing stop loss system has been incorporated in Zerodha bracket orders.
Conclusion
The ATR Trailing Stops indicator is very price sensitive and creates whipsaws during the range-bound market. During that time the position can be stopped early. To prevent early exits, this indicator can be used in conjunction with other indicators. We suggest using the ADX/DMS indicator or the Aroon Oscillator as a supporting indicator. The ADX or Aroon can measure the trend strength. Hence, if it is a strong trend, traders can use the ATR Trailing Stops indicator for entry and exit. On the other hand, if ADX shows a range-bound market we suggest not to use this indicator as traders can lose money both ways then.
 Indicator: Formula, Settings & Strategy")


Please Tell me the formula that Zerodha uses for calculating the ATR stoploss square as it is observed that the value is not same as other ATR stop loss methods that are used in Trading view and other charts
You can ask the same in Zerodha TradingQNA forum.