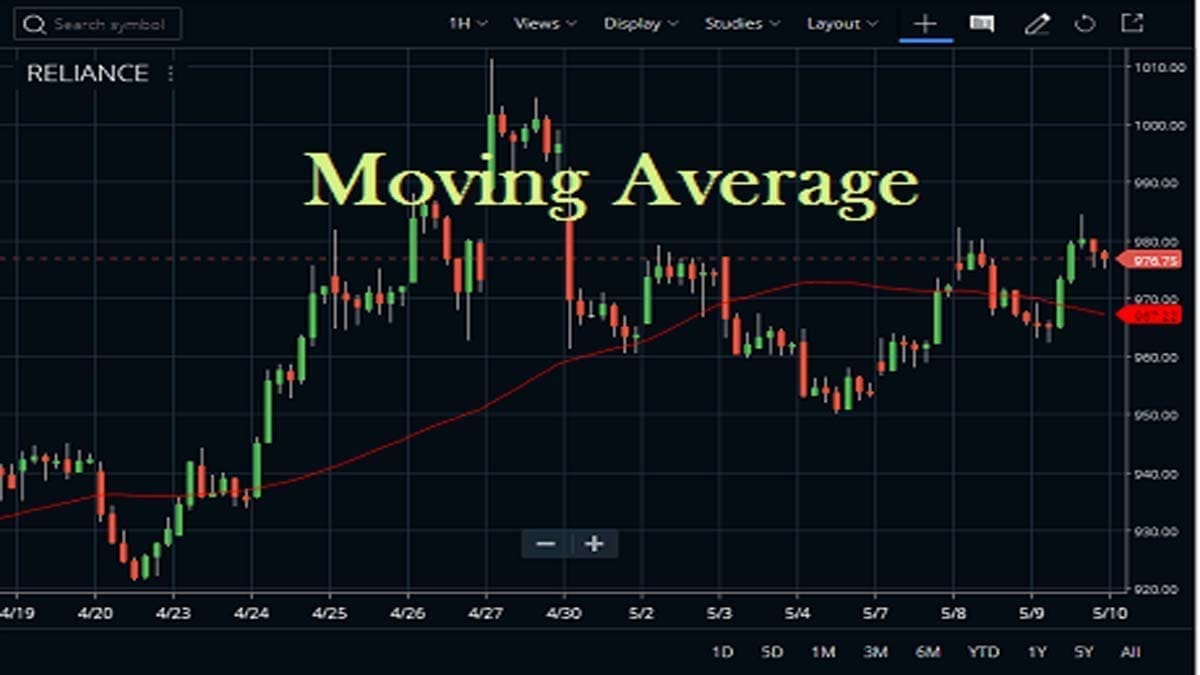
Moving Average Indicator or in short, MA is a widely used indicator in technical analysis. It does not predict the price direction but rather defines the current direction. The indicator lag due to being based on past prices. The indicator’s main importance is it helps smooth price action and filter out noise. The content will help you to understand the overall concept of Moving Average along with its settings, strategy, and formula.
What is the Moving Average Indicator?
Investopedia says about MA an indicator often utilized in technical analysis displaying the average price of a stock over a given time period. MAs are typically used to measure momentum and outline areas that you can think of as support and resistance zones.
Basically, in the technical analysis platform, Moving Average represents the mean instrument price value for a specific period of time. When you calculate the moving average, one averages out the instrument price for the time period. As the price changes, according to it, the moving average either increases or decreases.
Moving Average Indicator FAQ
A Moving Average is basically a series of average values that can smooth out the noise of the price action. The basic strategy is quite simple. If the instrument price rises above its moving average, a buy signal appears. Reversely, when the price falls below its moving average, we have a sell signal.
Simple and Exponential Moving Averages are two important categories of Moving Averages. SMA is the average price of security while EMA gives more weight to the most recent prices. So, in comparison to SMA, EMA better reflects new market data. When comparing long-term averages, the difference between the two is noticeable.
The 50-day moving average is the most popular and commonly used indicator in stock trading. Generally, traders use a 50-day SMA (simple moving average) to get the support-resistance level. When the price crosses 50 MA and goes above, the trend is up and vice versa.
Generally, a simple moving average is calculated by taking the arithmetic mean of a specific set of values. So, mathematically, a set of numbers or prices are added together and, then divided by the number of prices in the set.
What are the Different Types of Moving Average Indicators?
Moving Average has different classifications like
- SMA (simple moving average)
- EMA (exponential moving average)
- WMA (weighted moving average)
- WMA (wilder moving average)
- HMA (hull moving average)
- Time Series
- Triangular
- Variable
- VIDYA
- Double Exponential
- Triple Exponential
Simple Moving Average (SMA)
The simple moving average is the most basic form of moving average. It is formed by computing the average price of a security over a specific number of periods. In the calculation, the closing price is taken. Here, the Short-term averages respond more quickly to changes in the price of the underlying, while long-term averages are slow to react. Some of the basic features of SMA are as follows:
- The importance of SMA is mainly concentrating on identifying the continual or reversal of the market trend, whether it is bullish or bearish.
- It can be enhanced as an exponential moving average (EMA) which more heavily weights recent price action in comparison to SMA.
Exponential Moving Average (EMA)
EMA or exponential moving average usually reduces the lag by applying more weight to recent prices. In simple words, it gives greater weights and the significance of the most recent data points. EMA is more sophisticated than simple moving averages and does not suffer from the same distortions here.
- Just like all moving averages, the technical indicator is used to produce buy/sell signals, based on crossovers and divergences from all of the historical averages.
- Traders often use multiple different EMA days, for example, 20-day, 30-day, 90-day, and 200-day moving averages.
Weighted Moving Average (WMA)
As the name suggests Weighted Moving Average puts more weight on recent data and less on past data. The calculation is done by each bar’s price with a weighting factor.
- Weighted Moving Average defines the trend direction.
- Here, buyers can take entry in the dip or below the WMA level. In the opposite way, sellers may enter at the above WMA.
- WMA is basically more sensitive to the price.
Wilder Moving Average (WMA)
Welles Wilder authored Wilder Moving Average in his book New Concepts in Technical Trading. Like some of the other indicators, it smooths the market noises and reflects the market trends more clearly.
- Traders get an overall picture of the market behavior and can make informed trading decisions by applying it.
- It is good to use a WMA indicator together with another WMA indicator of a different period length.
Hull Moving Average (HMA)
The Hull Moving Average was developed by Alan Hull. It is an extremely fast and smooth-moving average. A longer period of HMA uses to identify the market trend. The HMA almost eliminates lag altogether as well as manages to improve smoothing at the same time.
- When the HMA is rising, the prevailing trend is rising. This indicates it may be better to enter long positions.
- And, if the indicator is falling, the prevailing trend is also falling, indicating it may be better to enter a short position.
Apart from the above Moving Averages, there are others:
- Time Series
- Triangular
- Variable
- VIDYA
- Double Exponential
- Triple Exponential
- Arnaud Legoux Moving Average
Triangular Moving Average Indicator
The triangular moving average can be calculated using various inputs such as prices, volume, or other technical indicators. Triangle moving averages or TMA is most often applied to the price of an asset.


The objective of the moving average is to double smooth the price data. It will produce a line on the chart which doesn’t react as quickly as an SMA would.
VIDYA Moving Average
VIDYA or Chande’s Variable Index Dynamic Average is an adaptive weighted moving average indicator. The indicator precisely focuses on volatility. In simple words, the VIDYA is an average that adjusts itself to changing volatility. In case, when volatility is high, the VIDYA becomes more sensitive and when volatility is low, the indicator becomes less sensitive. This allows you to assess the trend as per the current market conditions.
Variable Moving Average Indicator
A VMA or Variable Moving Average is able to regulate its smoothing % based on the market’s inconstancy automatically. The indicator’s sensitivity grows by providing more weight to the ongoing data as it generates a better signal indicator for short as well as long-term markets.
Double & Triple Exponential Moving Averages
As the names suggest, the double EMA includes the EMA of an EMA. And, the triple EMA has a quite more complex calculation. It involves an EMA of an EMA. The purpose is still to reduce lag, and the triple EMA has even less lag than the double EMA (exponential moving average).
Moving Average Indicator Settings
Here, I am gonna show you the Moving Average Settings with three different platforms, Zerodha Kite, Upstox Pro, and AmiBroker.
On Zerodha Kite
Traders can find the Moving Average under the STUDIES section in Zerodha Kite. You can attach it to any chart from there. The default moving average indicator settings on the Zerodha platform is 50-period. Check the image below where we attached the moving average indicator on Reliance Industries shares price chart.
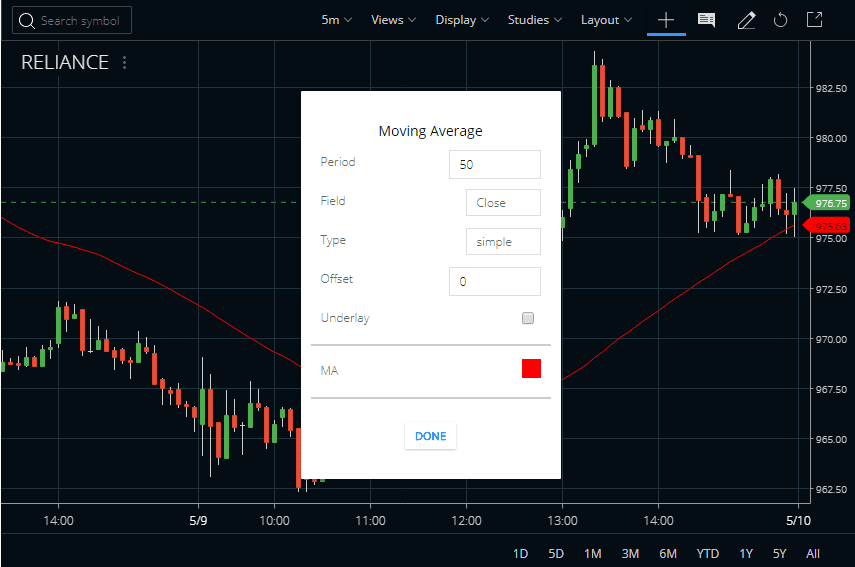
You can also select whether to plot the MA on the open, high, low, and close fields or any other technical indicators. Traders will be able to choose the MA type, i.e. simple, exponential, time series, triangular, variable, Vidya, weighted, Welles Wilder, hull, double exponential, etc. You can also choose an offset of the MA and also the color can be selected from the parameters.
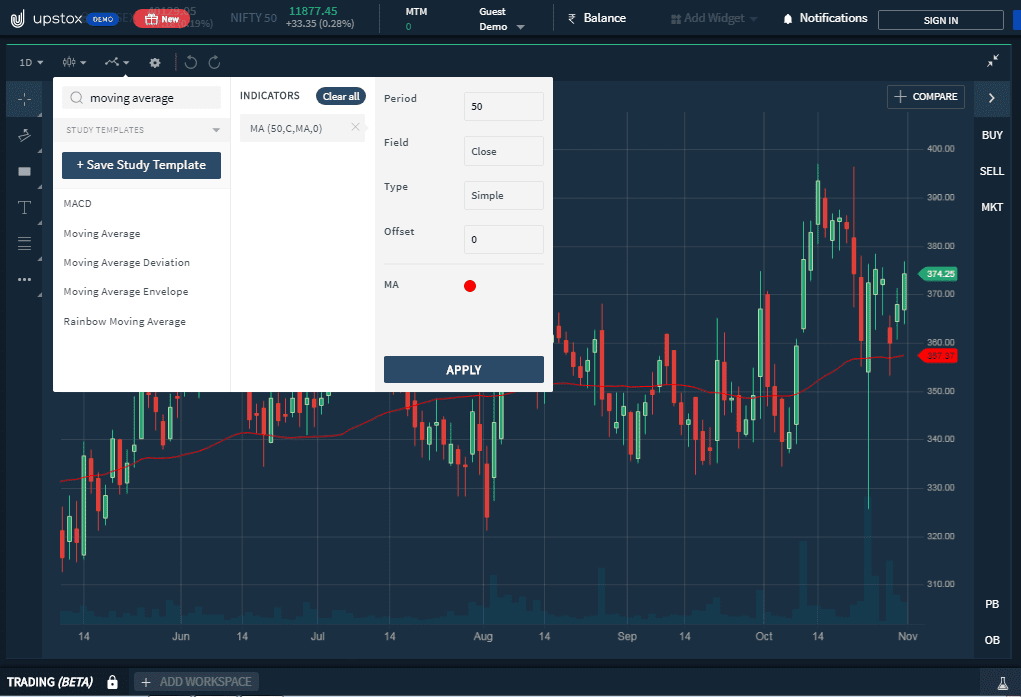
On Upstox Pro
The settings with Upstox Pro are also quite simple and straight. Open your account and go through a chart. There write down the indicator name and click on the apply option.
On AmiBroker
You can also plot this indicator on advanced charting platforms like AmiBroker. You can even code your own buy-sell signals on this platform. I am providing a ready-made MA crossover strategy on the AmiBroker platform. See the image below to understand what the system looks like.
Download MA Crossover AmiBroker AFL
Download the MA crossover system for AmiBroker from below. You can also modify this strategy as per your own requirements.
Moving Average Indicator Strategies
The easiest technique for setting your charts is to plot the basic moving averages of the underlying price. You can plot line charts or use the end-of-day charts using bars or candlesticks.
The Basic Trading Strategy with the Moving Average Indicator
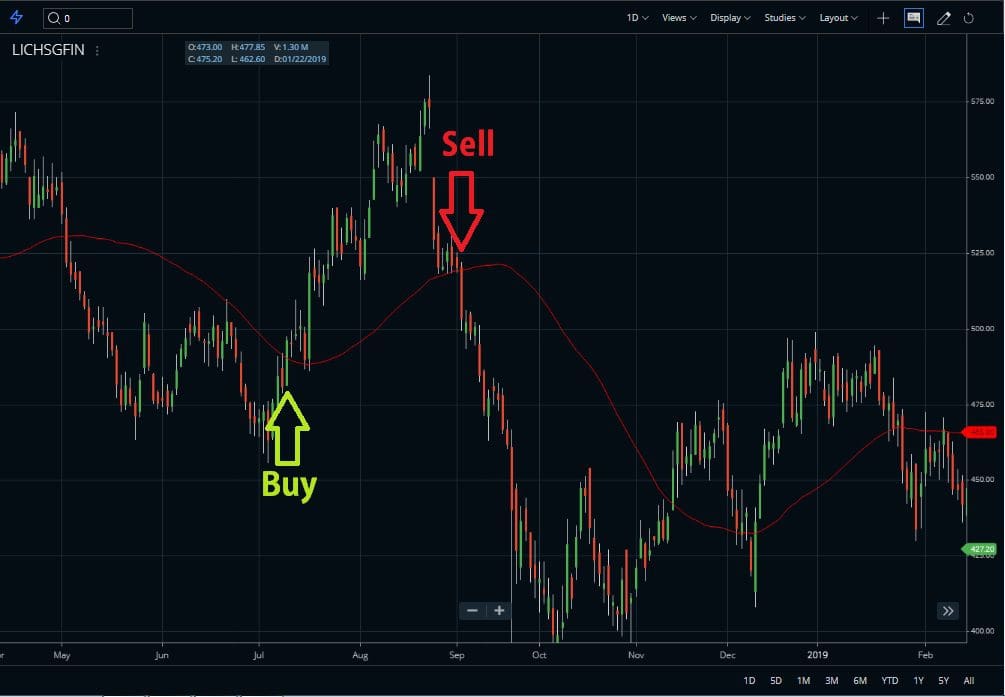
The most common use of MA is buying and selling signals based on the cross of price over the MA. We can consider price crossing up from below the MA as a BUY signal, whereas we can consider price crossing down from above the MA as a sell signal. We can also use two or more MA crossovers as trading signals.
Advanced Moving Average Indicator Trading Strategies
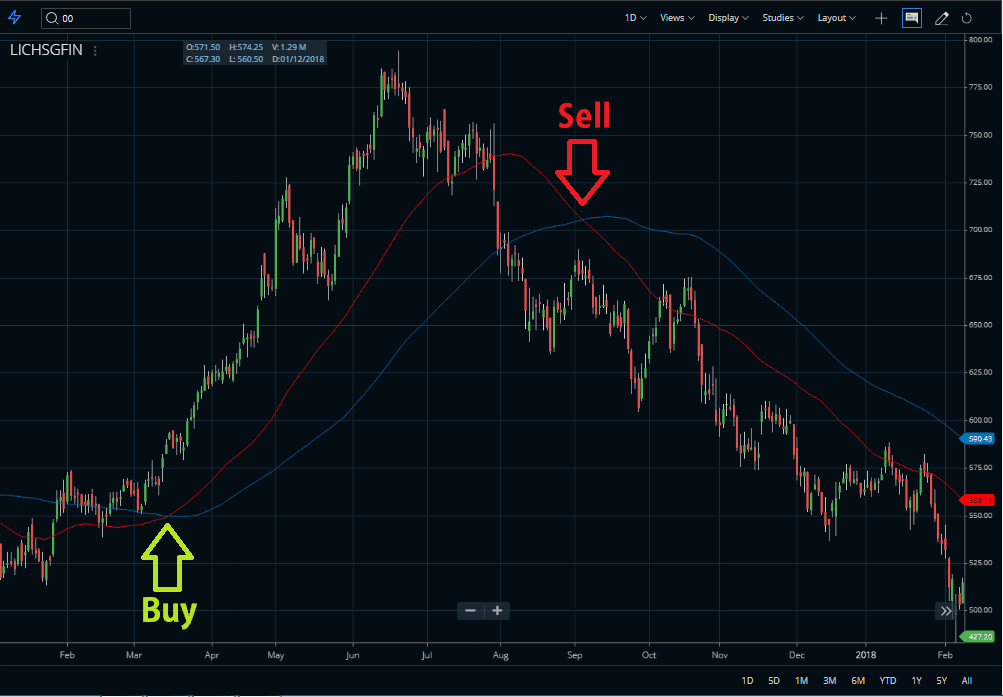
Now, let’s get into a more advanced strategy. Here, I’ve taken two MAs, the red one is 50 SMA and the blue one is 100 SMA. If the 50 MA crosses the 100 MA from below and goes above, the trend is going up. And, the opposite trend appears once the red MA goes down. In simple words, low-period MA stays higher than high-period MA in the case of an Uptrend and vice versa.
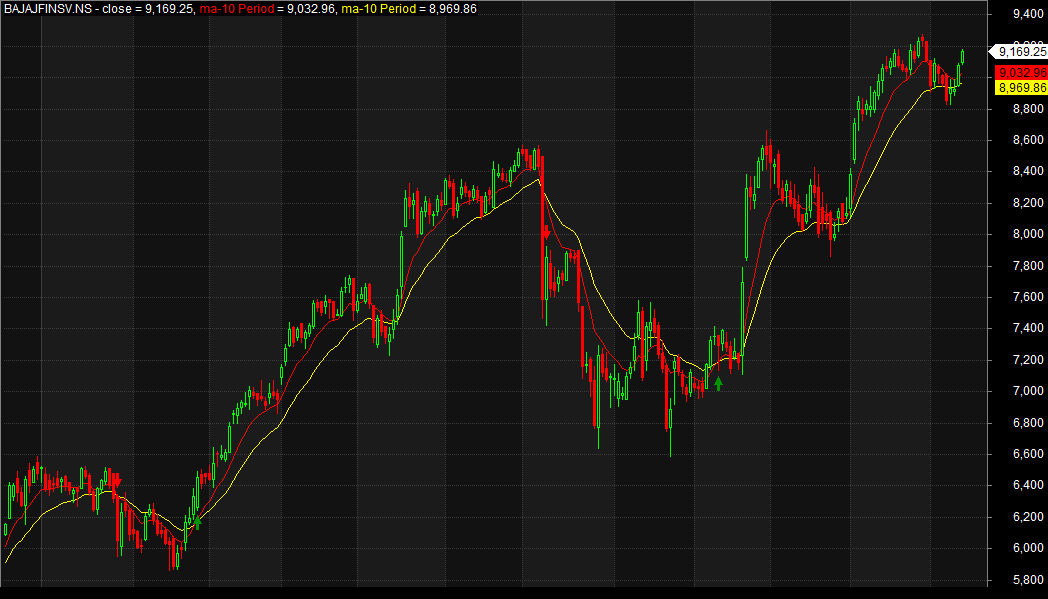
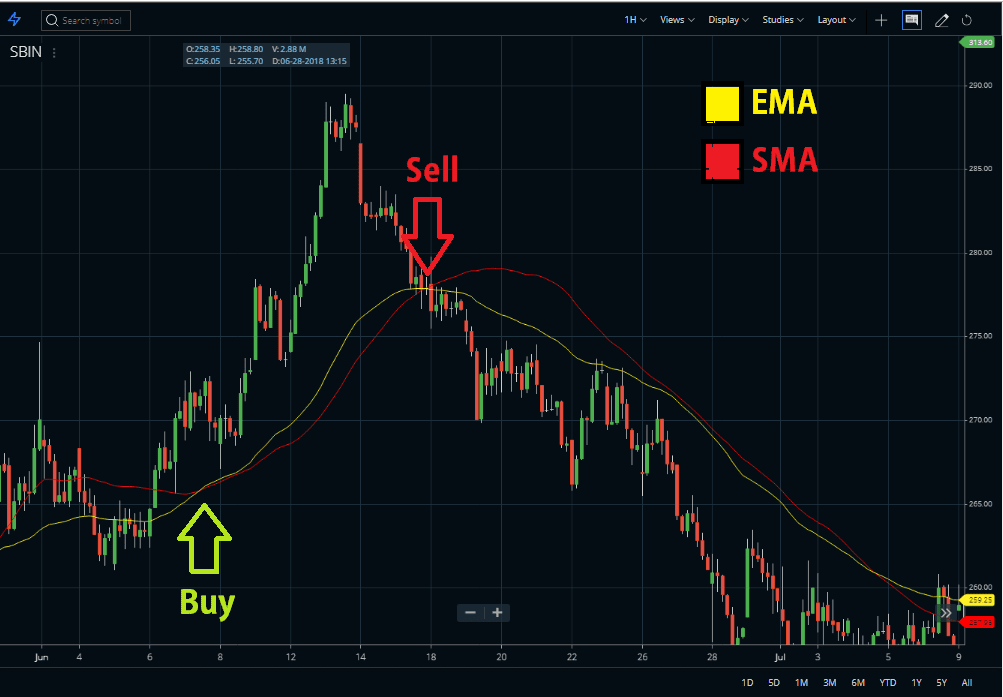
Look at the picture below. See yellow line is EMA and the red line is SMA. As you can see EMA stays more close to price while SMA maintains a distance. Here, also, you can apply a simple strategy. When EMA crosses the SMA and goes above, the price is going up. And, when the EMA crosses below the SMA, the price is going down.
Furthermore, I am going to show you how you can get the support-resistance level by using the Moving Average indicator.
See the highlighted area from where the price took support at 50 MA and move towards the up direction. It is a most useful and applied strategy of MA. From MA, the price bounced with a big bullish candlestick pattern. This indicates an upcoming uptrend.
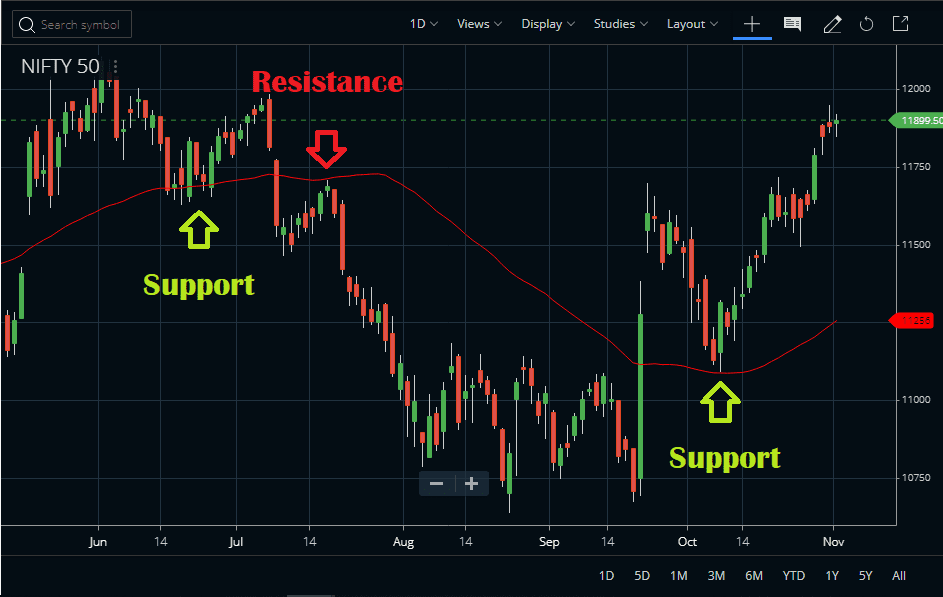
Now, we will look at the resistance level. In the above chart, the price is about to cross the MA on the upside but ultimately, it took 50 MA as its resistance and goes down. The downtrend has started with a big bearish candlestick.
Suggested Reading
To know more about the subject you may read The Moving Average Indicator: The Definitive Guide by Lode Loyens. But I would suggest you also definitely read Moving Averages 101: Incredible Signals That Will Make You Money in the Stock Market by Holly Burns.

Conclusion:
The Moving Average is a trend-following indicator as well it is lagging (indicators that will always be a step behind). This is not necessarily a bad thing though. Because we all know, the trend is your friend and it is better we trade only in the direction of the main trend. Moving Average ensures that a trader is in line with the current trend. Once in a trend, the MA will keep the trader in, but also give late signals. In addition, while using moving averages, don’t expect to sell at the top and buy at the bottom. We should now use moving averages on their own, but in conjunction with other complementary tools, as with most technical analysis tools.


