Before beginning, one thing should be clear to you, our previous article on Pivot Point is quite different from today’s Pivot support-resistance. Hence, Pivot is a totally separate concept. The pivot point is a calculated Pivot while today’s topic covers Structural Pivot which often refers to Bar Count Reversals. At the end of the article, a free Amibroker AFL code will be provided. So, let’s start with support resistance.
Support-Resistance (S&R) and Pivot
First, let us understand what we mean by support and resistance level or S&R.
Support
Generally, support means the entry point of a stock. From the support level, buyers can take an entry. Hence, support means below the level a stock has difficulty falling. Sometimes, the falling price towards the support level indicates a test for the stock.
Resistance
Resistance generally considers the exit or selling point of a stock. When a stock moves in an upward direction and reaches its highest point from where it turns around, refers to the resistance level. From the resistance level, the price tends to move downward direction. Therefore, sometimes it considers as selling level.






What is Pivot?
The Pivot has nothing to do with calculations. It just deals with visual interpretation. Structural Pivot is nothing but a price-bar formation, widely-used in technical analysis. It indicates a clear real-time signal of support and resistance. The price candlestick has four segments, OHLC (Open, High, Low, Close). For the composition of Pivot, a minimum of three bars are needed. In order to show support-resistance, Pivot Low-high are used to draw trendlines. Here, support indicates Pivot Low and resistance is Pivot High.
How does Pivot work?
- Pivot High is surrounded by lower highs and lower lows.
- Pivot Low is surrounded by higher highs and higher lows.
- The longer the trend before and after Pivot carries a higher significance.
- In order to visualize the price pattern, Pivot helps to determine the trendline.
Amibroker AFL Code for S&R with Pivots
We have created a nice AmiBroker AFL code. In our previous post, a full description is available about the software of AmiBroker. I have given the download link below. But first, let’s check the example of the AFL.
Pictorial Example of the AmiBroker AFL Code
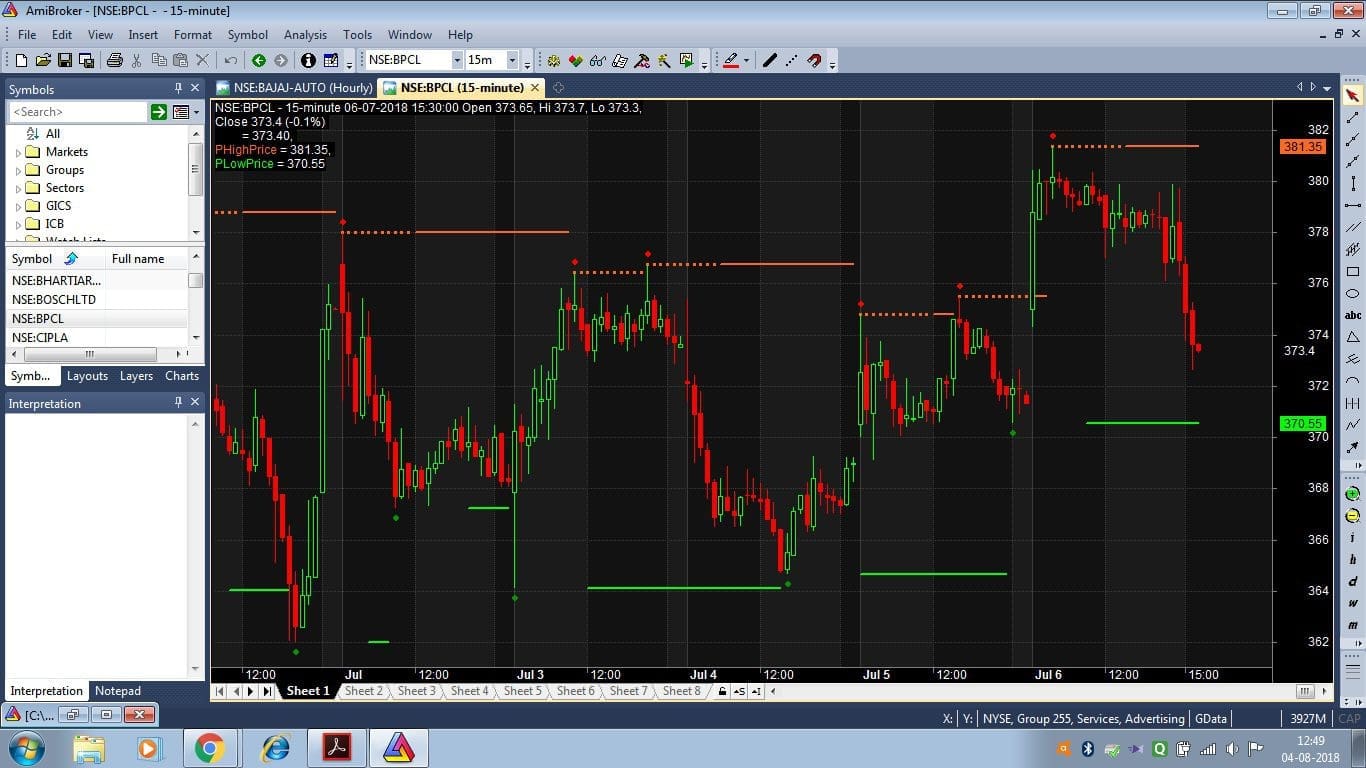
The above chart displays in Amibroker after applying the Amibroker AFL code. The script is on BAJAJ AUTO share price 15 min. As you can see there is a clear indication of support and resistance level here. The green lines are the support while the orange is the resistance level.
Download the FREE Amibroker AFL Code
You can download the code by yourself. It’s quite easy to apply to the chart. Just copy the link and put it in the formula editor of Amibroker. The download link of the Amibroker AFL code is given here.
FAQ
To add AFL code into AmiBroker, copy the code and paste it under the Formulas tab of your charting software. This will create a new formula window with the AFL code in it. Now, save this formula by clicking on the Save button in the menu bar above.
AFL stands for ‘Amibroker Formula Language’ which is used to develop trading strategies and indicators for use with the Amibroker charting platform. It consists of mathematical or logical formulas that help users formulate unique technical analysis approaches according to their individual specifications and preferences.
That depends on what type of analysis you are looking to perform as different indicators have distinctive features. Moving Average (MA), Relative Strength Index (RSI), and Accumulation Distribution Line (ADL) are some of the most popular ones among traders using stock market charts in Indian markets. Ultimately, choose an indicator based on how relevant it is for your desired application & result set desired objectives – whether scalping or long-term investing! You can also opt between various available versions like Triangular MA, Hull MA etc as per need and strategy style adopted!
To prevent your AmiBroker AFL from being copied or modified by other users, you can encrypt it by creating a DLL file. This prevents anyone else from viewing or modifying the code without your permission. You can create a DLL file using advanced software like AmiBroker Development Kit, Visual Studio or DotNet for AB.
Conclusion
In conclusion, the Amibroker AFL Code S&R with Pivots is a powerful trading tool that can help traders capitalize on market trends and make informed decisions when investing. The code makes use of support and resistance levels calculated using a 3-bar pivot formula, in order to reduce risk while maximizing small price movements. By downloading this AFL code today, investors can take advantage of these automated features now to begin making more profitable trades right away.