The whole financial market stands on top of the two pillars, supply, and demand. The entire market moves according to the correlation between supply and demand. During the bullish trend, buyers dominate the market and the opposite happens in the bearish market. The support-resistance level indicates nothing but the relationship between supply and demand. The content will cover Support-Resistance levels in detail. Basically, traders work on SR (Support-Resistance) visually, and the usage of calculation-interpretation is much less. I hope through the article, you will come to know every detail of How to Find the Support and Resistance Levels of a Stock?
Definition of the Support and Resistance Level
Let’s start with the basics, the definition of the Support-Resistance level. Before entering into a chart, it is important to have a basic brief overview of the particular subject. After that, we will describe certain steps in “How to Find Support and Resistance Levels of a Stock?”.
What is a Support Level?
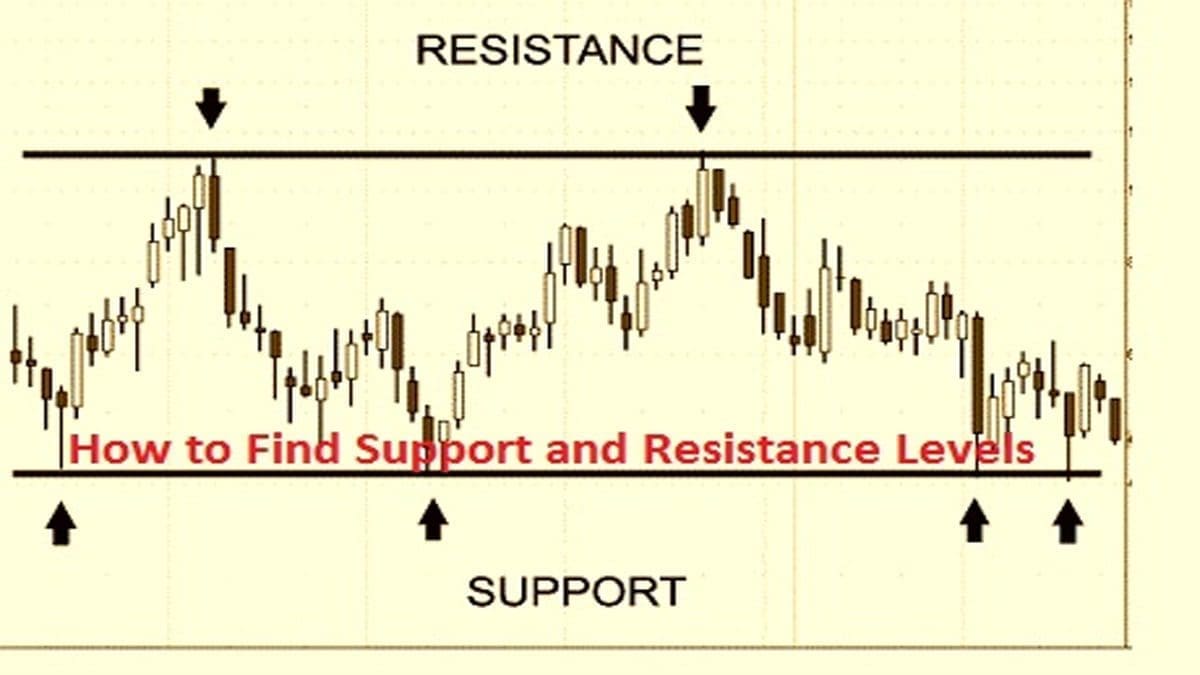
The name itself suggests its meaning. As the specific level prevents the price from falling further, refers to as Support. From this level, the buyer’s demand power becomes high. Price at the support level tends to bounce back in the upwards direction. As the support considers the maximum price falling level, it appears under the CMP (Current Market Price). After support is broken, another one will have to be established at a lower level.
If you draw an area that connects the previous three or more data points of a stock closing or low price, a support zone will create. It’s better to create a zone rather than a line. Sometimes, traders miss out on the support level, for this reason, it is suggested to draw a support zone.
What is a Resistance Level?
Resistance is just the opposite of the Support level. As the name suggests, it prevents the price from rising further. At this point, traders expect a maximum supply, and as a result, buyers’ demand power becomes low. As resistance considers the overbought level, it always comes above the CMP (Current Market price). Multiple resistance levels can appear in stock.
Based on the previous data, resistance is made by connecting the stock opening or high price points. The resistance zone is the most important level to consider as the exit signal from the market. Therefore, it is advisable to draw a zone there in the resistance level.
Features of the Support-Resistance Level
- I have stated above that after a broken level, a new level appears in the case of both support and resistance. However, sometimes broken support often becomes resistance while broken resistance often becomes support.
- There is no time limit, Support-Resistance levels can last for minutes, hours, days, weeks, and even years.
- Besides this, you can work on them in every timeframe.
- When a bullish turn meets resistance, it acts as a bearish trend from the resistance point.
- The opposite happens when a bearish trend meets the support and after that turn into a bullish one.
- Sometimes, after breaking support when the price level becomes resistance, the market tends to make lower highs and lower lows.
- Sometimes, when the market breaks the resistance and becomes support, tends to make higher highs and higher lows refer to an uptrend.
- Traders generally work based on the most recent Support-Resistance level but sometimes past S-R data is also used.
How to Identify a Support and Resistance Level?
The equity, commodity, or forex markets sometimes show excessive demand and sometimes they show excessive supply. The place these two excessive forces of supply and demand conflict are called support and resistance levels. In a market that’s oversold, we use terms like bears, sell, and bearish. In a market that’s overbought, we use terms like bulls, buy, and bullish. If a market does move neither up nor down and moves sideways we can say the supply and demand are equal.






Let’s come to today’s main topic “How to Find Support and Resistance Levels of a Stock?”. There are lots of ways by which traders can spot the Support-Resistance zones. By using indicators, oscillators, and breakout strategy, traders can create the S-R zone. Hence, move to the main discussion points.
By using Oscillator
By using oscillators, like RSI, Stochastics, etc you can identify the Support-Resistance level. Oscillators mainly oscillate in the range from zero to 100. When the price crosses the 70-80 level, considers an overbought situation while crossing the 30-20 level is called an oversold situation. Previously, I wrote an article on the overbought & oversold situation, you may go through it. In the overbought situation, the demand of buyers reaches its highest level, and from here market tends to go down. Therefore, the level is considered the Resistance Level. The oversold situation rises when the seller’s supply power reaches its maximum point and tends to go up from there, referring to the Support level.
To make the concept clear, I attach an image below:
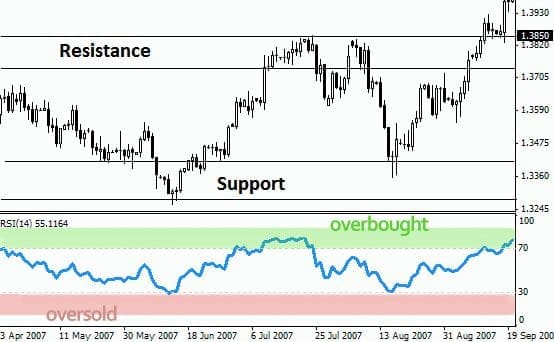
For example, I choose the RSI oscillator here in the script. As you can see that after identifying the overbought situation, I create a resistance zone there and oversold it as a support zone.
By using Indicators
Just like oscillators, by using the indicators also we can find out the Support-Resistance level. Different indicators such as Pivot Point, Alligator, Fractal, etc can help to spot the S-R level. For example, in Pivot Point, you can see a clear perception of the Support-Resistance level. By using the indicators like Alligator, and Fractal, we can easily identify the S-R level.
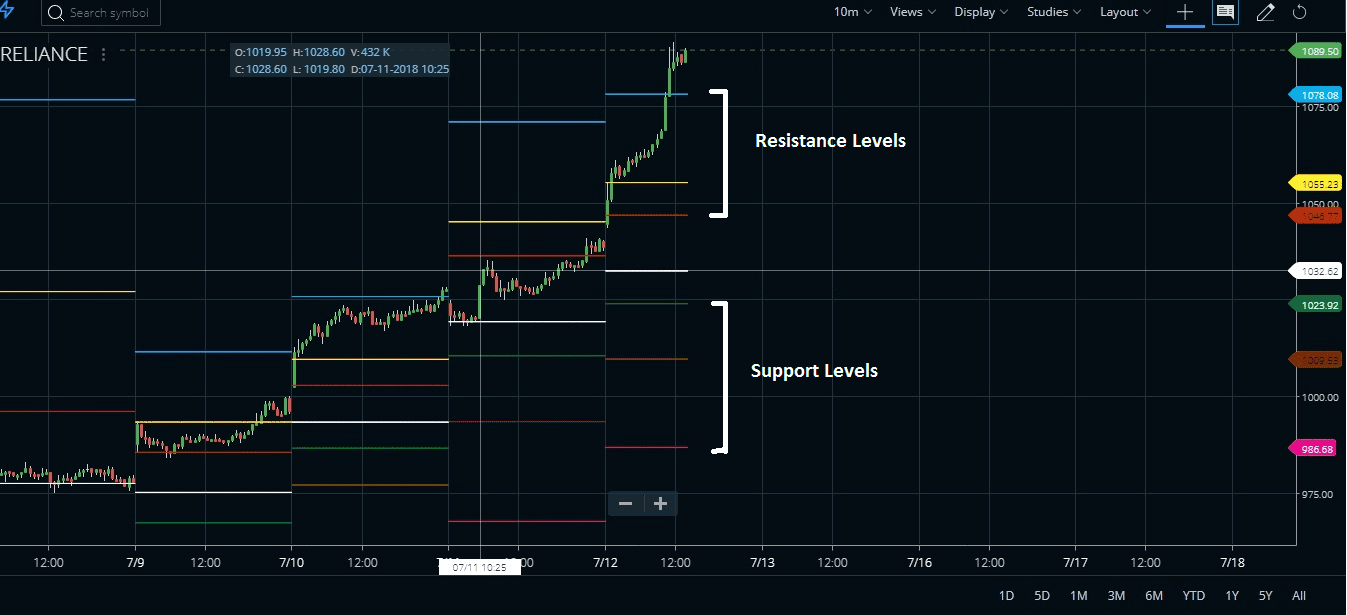
According to the example, we applied the Pivot Point to this chart. The white line is the Pivot line. Above the Pivot line, there are Resistance levels while below Pivot, Support levels exist.
Breakout Strategy
I have already mentioned the breakout strategy to some extent. Sometimes, when a Resistance is broken, the previous resistance level becomes support and the opposite happens with the Support level. To make you understand a chart is attached below:
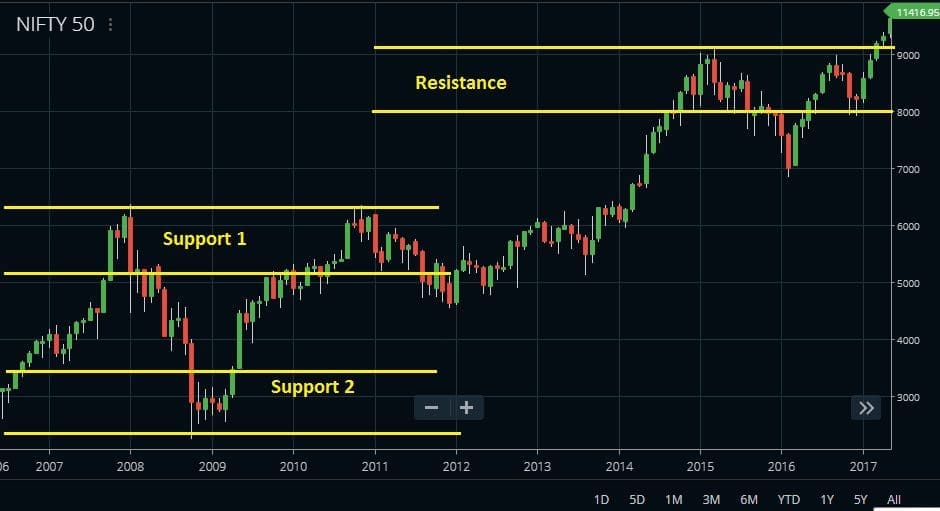
Here Support 1 used to be a Resistance zone but when the price breaks the resistance level with lower lows and lower high movements and creates a new Resistance, the previous one becomes the Support level. We have covered the higher-high, lower-low price action strategy in our previous article. You may go through it.
Rules of Trading Dynamic Support and Resistance
The S&R does not remain static rather the zone or S&R changes with the ongoing price action.
- When the price is above the dynamic zone (the trend is bullish ) – we will buy when the price dips to a dynamic zone and from there it strengthens.
- When the price is below the dynamic zone (the trend is bearish ) – we can sell when the price rallies towards the dynamic zone and take a resistance.
Support and Resistance Formula for AmiBroker
I am sharing dynamic support and resistance indicator for Amibroker. The indicator is coded for Amibroker on the formula of The Rumpled One’s or TRO’s code in Metatrader. Check the image below.
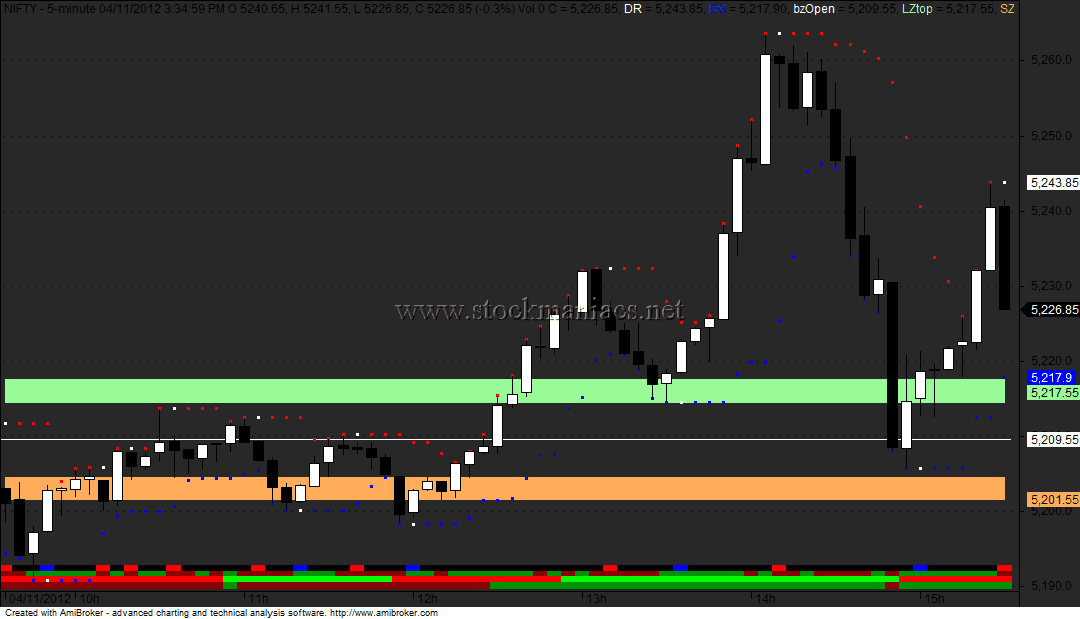
You can freely download and use the dynamic support and resistance indicator formula by clicking here.
FAQ
To identify a support or resistance level, look for an area where prices faced rejections repeatedly. Technical analysis charting tools such as Fibonacci Retracements can help to quickly identify these areas of potential supply and demand in Indian markets.
A popular trendline tool like TrendSpider may be used to easily draw out important levels of supply and demand on charts. This creates Levels that traders use to generate signals based on price movements near them.
Support levels are the areas where buying pressure will enter into play if the price drops there, while resistance levels represent those points at which sellers take profits when the price rises too high relative to their entry point. Understanding this core concept permits more informed investment decisions in Indian markets.
The most commonly used timeframe for finding high probability S&R Zones is within 1 hour – 4 hours, though much shorter or longer ranges can also be utilized depending on your trading strategy goals in Indian stock market settings.
Conclusion
In conclusion, the support and resistance level is all that traders and investors need to monitor for a stock. That decides good entry and exit levels. I hope this article will guide you in every way in your trading. This particular subject plays a significant role in the stock market.