A regular investor must be familiar with the terms Overbought and Oversold, or OB and OS, in the stock market. These are the two significant phases of a market movement. Finding a proper Entry time is considered the most important decision in trading. When the OB or OS situation reaches the extreme point, the reverse trend appears. To become a successful trader, identifying the OB and OS situation is one of the main points. In “Overbought and Oversold Meaning”, we are going to simplify the terms and state the indicators that help to identify the situations.
Overbought and Oversold Meaning
So, let’s start with the very basics: what exactly is meant by the terms “overbought and oversold”?
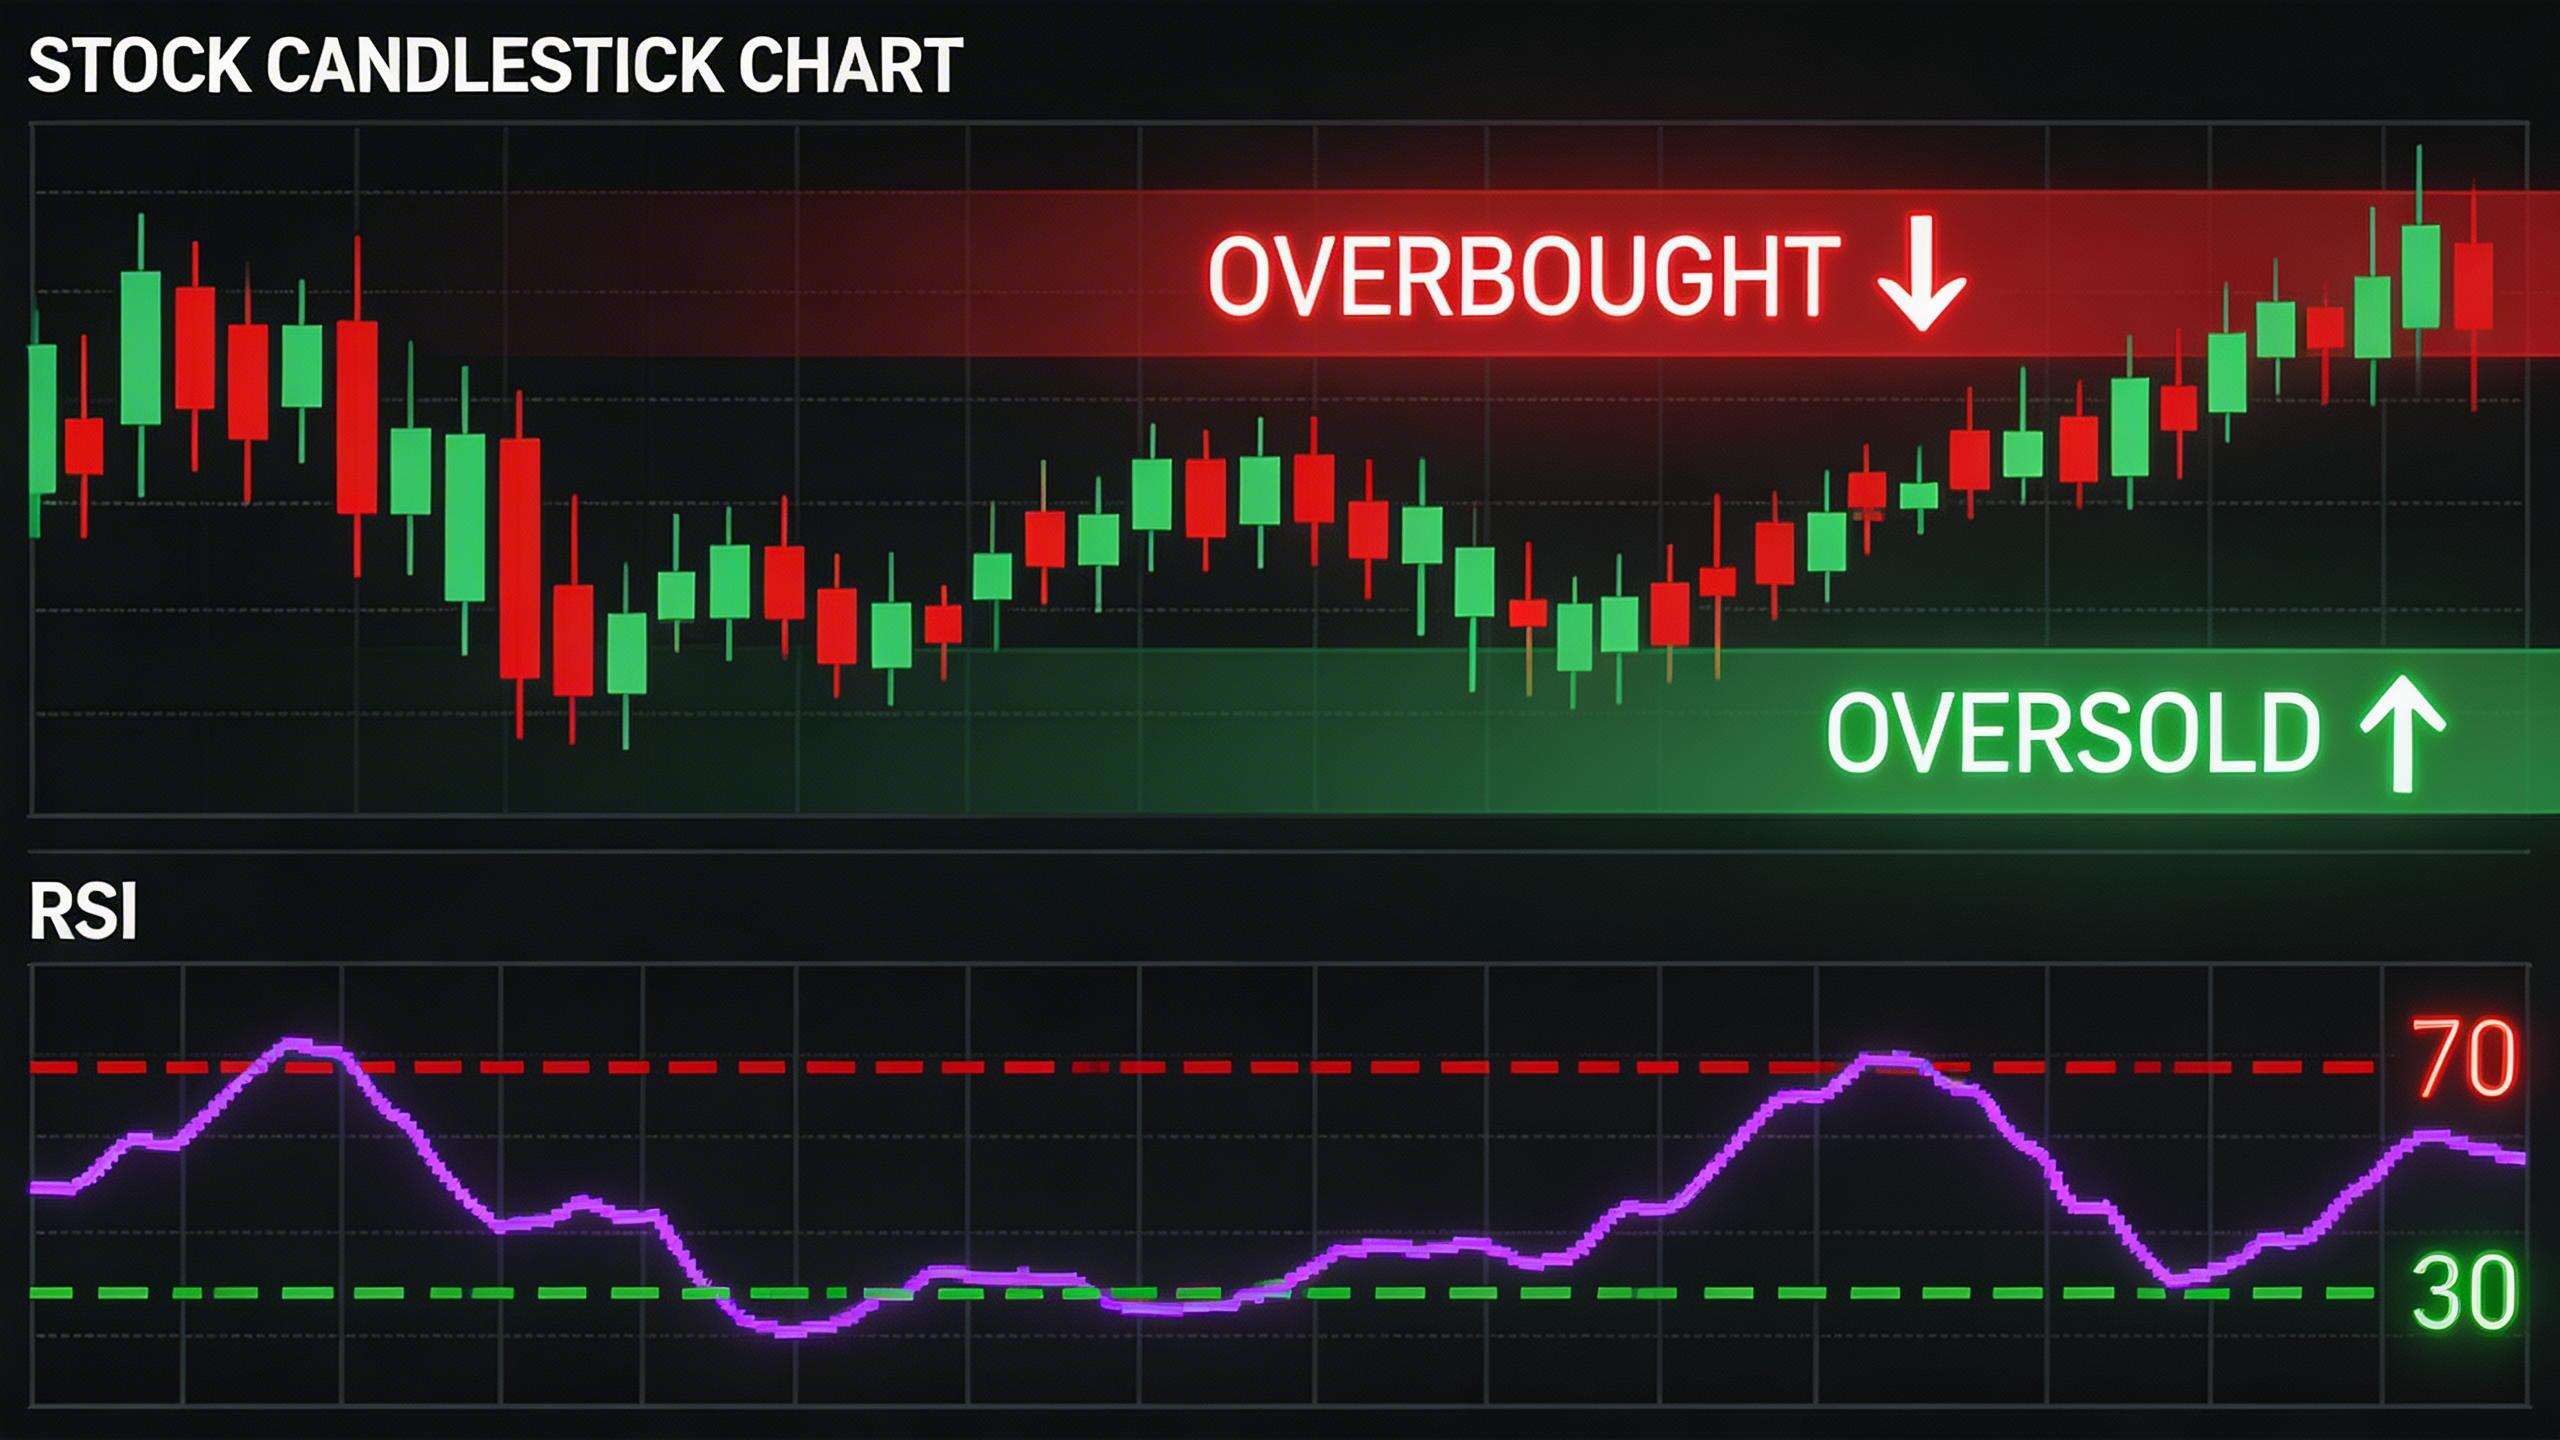
📊 Overbought and Oversold Meaning:
Overbought
A stock that has risen too much in a short time due to strong buying pressure and may be due for a price pullback.
Oversold
A stock that has fallen sharply due to heavy selling pressure and may be ready for a price bounce.
📈 RSI Guide: Above 70 = Overbought | Below 30 = Oversold
What is Overbought?
The term “overbought” itself carries the meaning of it, it indicates a situation in which the demand for a specific asset pushes the price and has enjoyed a prolonged period of rising prices. However, determining the degree to which an asset is OB is very much subjective and can differ among investors.
What is Oversold?
On the other hand, “oversold” indicates a phase when investors try to sell their stocks to book a profit. The price of an asset has fallen drastically because of the market overreaction or panic selling. In that case, the asset has suffered a short-term or prolonged period of falling prices.
Overbought and Oversold Meaning in Bengali
Identifying Overbought and Oversold Levels with Indicators:
The price can’t move in one direction forever; it will definitely turn around at some point. The OB or OS situations sometimes consider the market correction. There are a number of technical analysis methods by which one can identify the situations. But among these RSI (Relative Strength Index) and the Stochastic Indicators are generally and effectively used by the investors. Therefore, let’s move on to the methods of identifying the phases by applying these two indicators.
RSI (Relative Strength Index)
The relative strength index also refers to the momentum oscillator, developed by J. Welles Wilder. It is a range-bound oscillator that fluctuates between 0 and 100 depending on the market performance. The higher the RSI, the stronger the bullish trend, and vice versa. RSI movements above 70 or 80 are considered overbought, and when RSI moves below 30 or 20 indicates an oversold situation. The default setting for the RSI indicator suggested by Wilder is 14 periods.
Overbought Example
Here, the Bitcoin price has entered the overbought zone as suggested by the RSI indicator. Once the oscillator comes out of the overbought zone, it marks the sell zone.

In the above chart, we can see the RSI indicator breaks 70 levels and creates an overbought phase. It is advisable not to sell immediately, as we don’t know how far the price could continue to rally. Traders should wait till the RSI falls back below 70. This can give a good entry point with a profitable trade.


Oversold Example
Suppose Reliance stock falls from ₹1300 to ₹1100 within a few days due to panic selling. The RSI drops below 30. This indicates the stock is oversold. Traders may expect a bounce as buyers enter at lower levels.
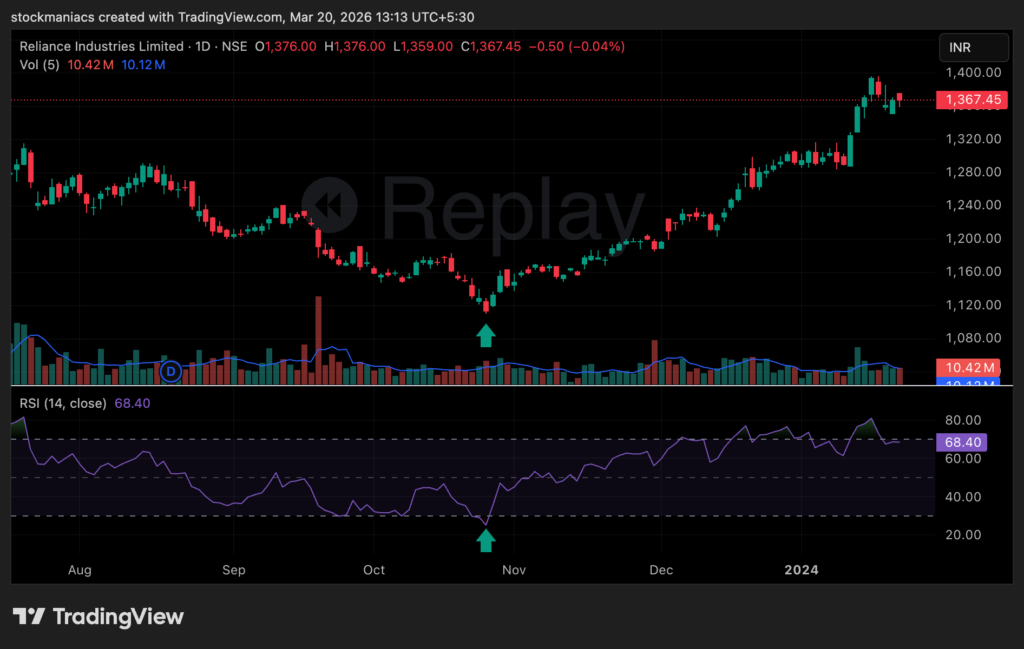
The above chart shows clearly that RSI drops below 30, known as the oversold situation. Investors are advised to wait until the RSI crosses back above 30.
Stochastic Indicator
The stochastic oscillator is also a range-bound oscillator like the RSI. There is a slight difference between them. Stochastic indicators compare the current price level to its range over a specific period of time, while RSI is measured based on the average gains or losses. A stochastic value above 70-80 is considered an overbought situation, and values below 30-20 show oversold status.
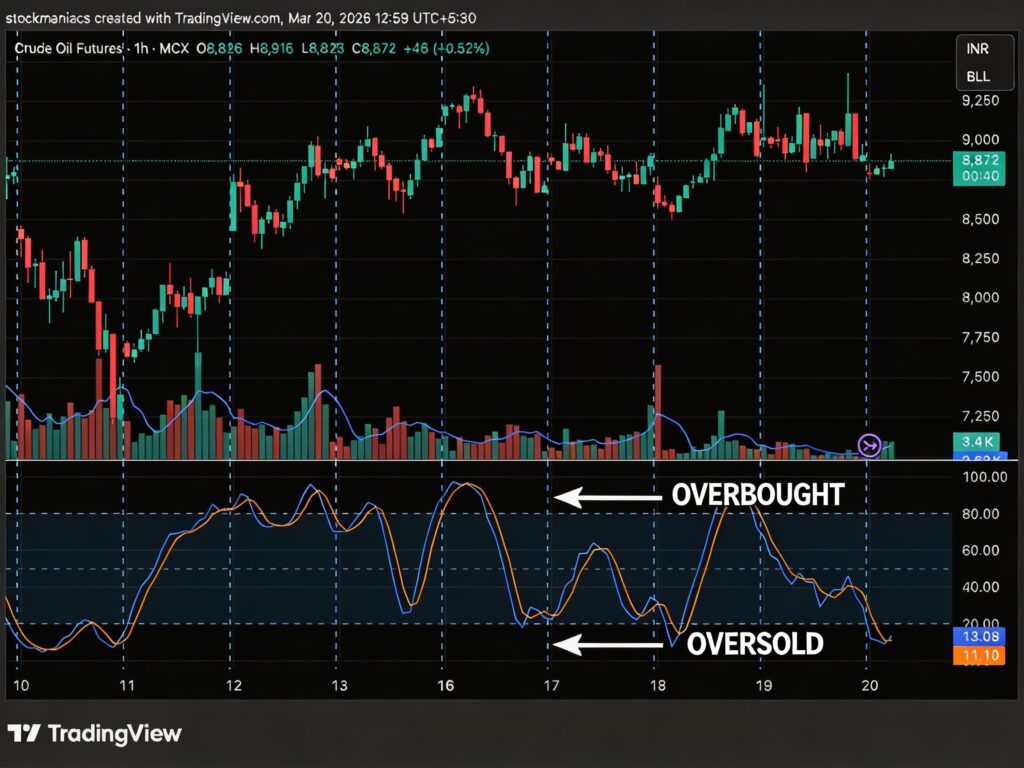
The chart shows the stochastic indicator with the overbought and oversold situations. Here, the stochastic indicator breaks the level of 80 to create an overbought phase, and when it crosses the 30 levels, an oversold situation appears.
However, overbought and oversold meaning carries a significant role in trading. Investors must be aware of these situations to make a proper entry for a profitable return. The overbought or oversold situation does not tell us to enter the trade immediately. Rather, it warns traders that a possible reversal is likely to occur.
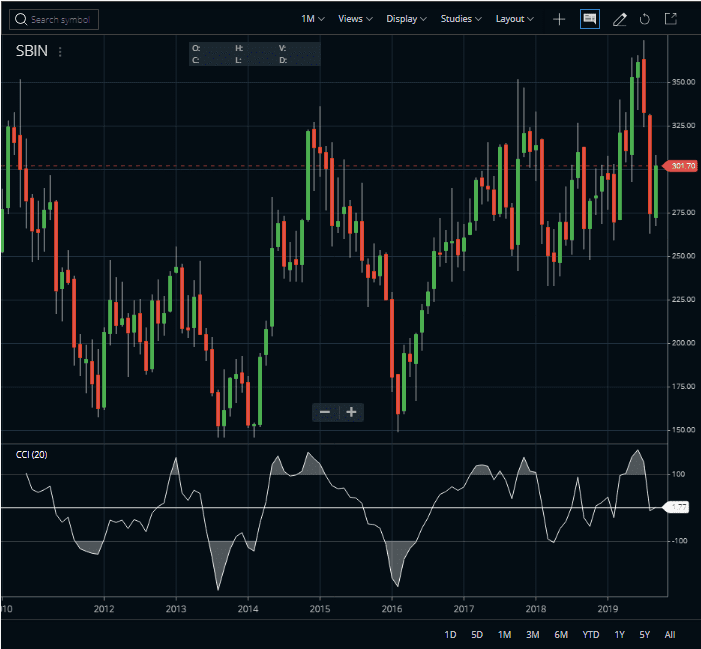
CCI Indicator (Commodity Channel Index)
The CCI, or Commodity Channel Index, was introduced by Donald Lambert, a technical analyst. It basically measures the current price level relative to an average price level over a specific period of time. The strategy is quite simple: CCI is relatively high when prices are far above their average. And, on the other side, CCI is relatively low when prices are far below their average.
One of the thumb rules for the commodity channel index is that oversold is – 100 and overbought +100.
Basic Strategy for CCI Overbought or Oversold
- If the CCI moves above +100, a new, as well as strong, uptrend is beginning. This provides signals to buy.
- Conversely, if the CCI moves below −100, a strong downtrend is beginning, which signals a sell.
- The above chart is taken from Zerodha Kite, here default levels are overbought above +100 and oversold levels below -100. These CCI levels can also be adjusted depending on the volatility of the asset. For instance, for more volatile security, you can use +200 and -200.
William % R Indicator
William % R, also referred to as the Williams Percent Range, is a kind of momentum indicator that moves between 0 and -100. It is a dynamic technical indicator that determines whether the market is overbought or oversold. The indicator is similar to the Stochastic Oscillator. The only main difference is that %R has an upside-down scale while the Stochastic Oscillator has internal smoothing.
Here, readings from 0 to -20 are overbought, while readings from -80 to -100 are oversold.
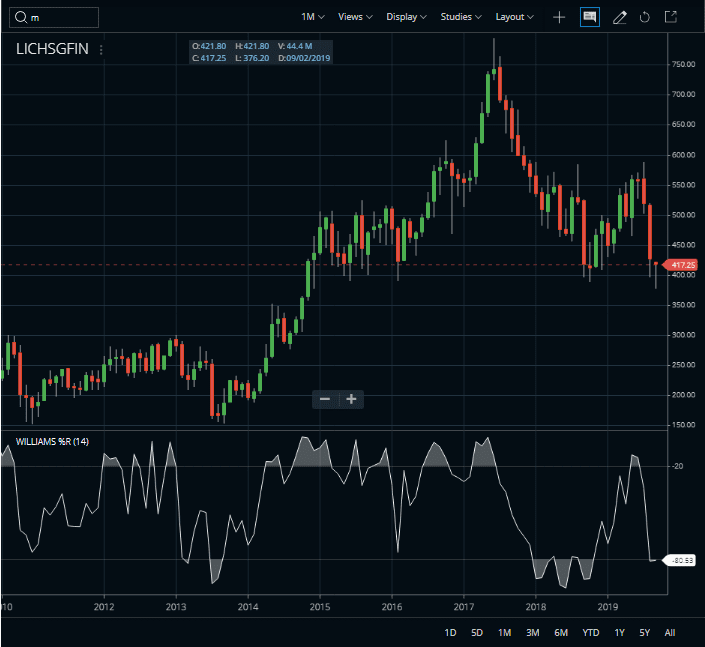
Normal Patterns
- If crossing the overbought boundary from above, the indicator signals a possible sell opportunity;
- If crossing the oversold boundary from below, the indicator signals a possible buy opportunity.
Divergence Patterns
The indicators also show disparity with price. This is what we know as the divergence patterns.
- If the price climbs to a new high, but the indicator does not, this can be a sign of the weakness of the uptrend.
- If the price falls to a new low, but the indicator does not, this can be a sign of the downtrend’s weakness.
Overbought vs Oversold
| Factor | Overbought | Oversold |
|---|---|---|
| Market Condition | Too much buying | Too much selling |
| RSI Level | Above 70 | Below 30 |
| Signal | Possible Sell | Possible Buy |
How to Identify Overbought Stocks
- RSI above 70
- Sharp price rise in a short time
- Resistance level nearby
- Volume spike during rally
How to Identify Oversold Stocks
- RSI below 30
- Sharp price fall in a short time
- Support level nearby
- Volume spike during decline
Importance of Overbought and Oversold
Previously, I mentioned that being overbought can be a signal of the sellers’ entry point. On the other hand, oversold can be the position of buyers’ entry. But sometimes the scenario may not be true. Overbought/oversold can be a long-term scenario. So, make sure you make an entry in the correct position.
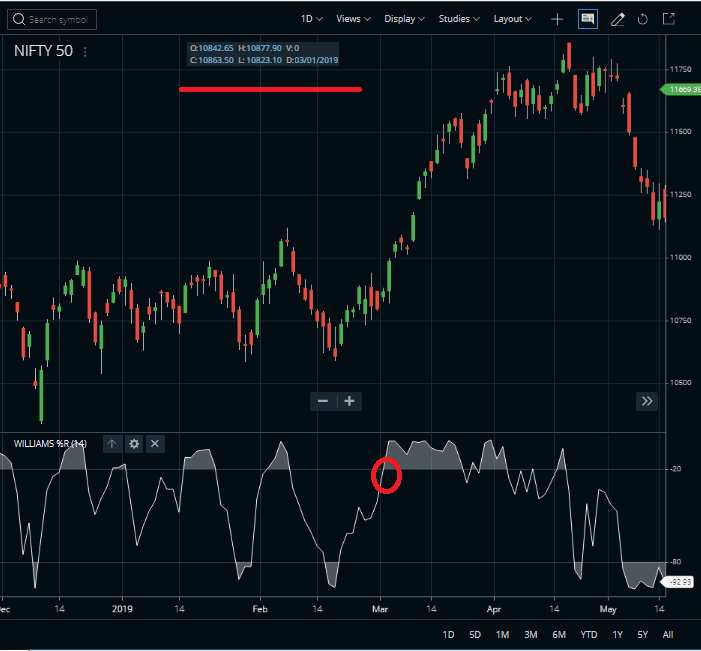
Like here, the overbought level starts on March 1, then it stays on that level for almost a month. This is a daily chart. Let’s see how long it stayed.
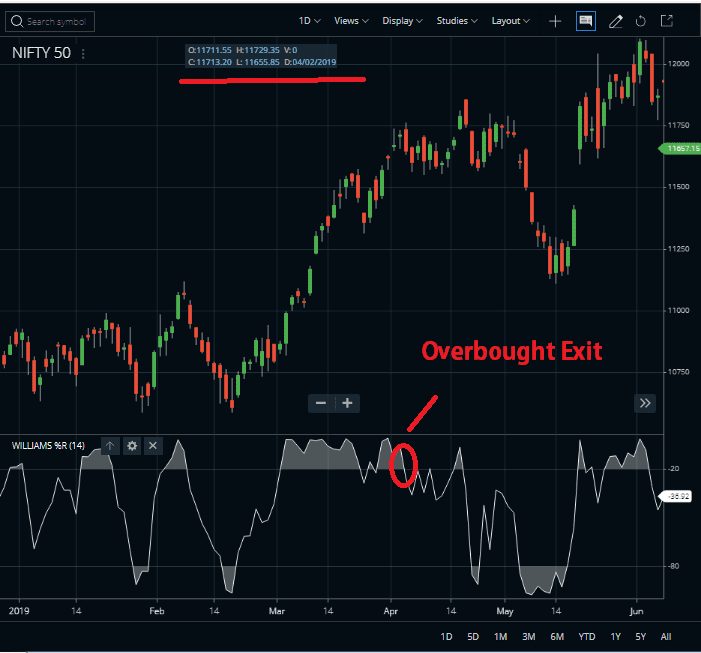
So, it is not necessary to make entries once a stock price reaches the maximum overbought/oversold level. Analyse the script properly first, then take the decision.
FAQ on Overbought and Oversold
It is a price state where sellers’ activities are the highest. Basically, the term oversold refers to a condition where a security has traded at a lower price. It has the potential for a price bounce. When the price is about to leave the oversold position, buyers become active at that level. And push the price toward the overbought zone.
When a stock price is overbought, that means buyers’ demand reaches its highest peak. And, there is no room for any more buyers. Now, the market is preparing for sellers. An overbought level can be the entry point for sellers. So, it is advisable not to enter with a buy position there.
There are many indicators or oscillators which indicate the most accurate overbought/oversold level. Among them, there are RSI (Relative Strength Index), Stochastics, CCI, and William % R is the most popular indicators.
In order to know if a stock is overbought or oversold, you need to set indicators in your chart. By analysing indicators like RSI, CCI, Stochastics, etc., overbought and oversold levels can easily be defined.
Conclusion
So, we have learned the meaning of overbought and oversold and found that they are such important concepts in the field of technical analysis. Traders get help by identifying these levels. Many oscillators have these levels. If you want to know more about the oscillator, follow our blogs daily and get new updates.


