Statistically speaking, we say two sets of data or two variables as correlated if there exists a statistical relationship (linear interdependence) between them. If two data sets or variables have a strong statistical relationship between them, we identify them as highly correlated. The Correlation Coefficient summarizes these two data sets into a single number between +1 and -1.
Correlation Coefficient FAQ
This is a popular method of summarizing a set of numbers into one single number between -1 and +1. Say we will find a relation between four movies. If we represent graphically, say we plotted the length of the movie in the X axis. And in the Y axis, we have plotted their ratings. Now, we will fit a straight line to the data. Now we will check if the straight line is pointing upwards or downwards. So is it positive or negative? In our example we saw that the straight line is positive, so the correlation coefficient is also positive. It is between 0 and +1.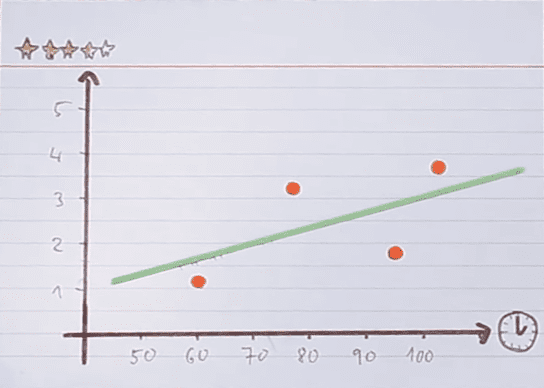
Similarly, if we find the line is sloping downwards it is a negative relation. Check the image below. Here the line is sloping downwards indicating a negative correlation. The correlation coefficient is between 0 and -1 here.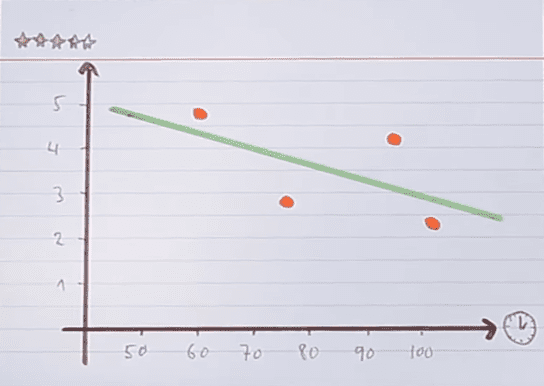
In case we get a horizontal line without any significant slope we tell it as a neutral correlation.
This is actually a method of summarizing a set of numbers or data sets into one single number between +1 and +1. We can find the mutual relation of any data sets like movies, cars, cities anything and find how they are mutually related. We can use this method in the stock market too, to find the correlation between two or more stocks.
The correlation coefficient can be between -1 to +1. The more it is close to +1 the more correlated or strongly correlated the data are.
What is the Correlation Coefficient indicator?
Investopedia defines this indicator as a measure of the degree of correlation between two stocks. The value of the coefficient varies from -1 to +1. For pairs trading, we should choose a pair of different stocks with a positive correlation. That means the value of the correlation coefficient indicator will be between 0.00 to 1.00. The closer it is to 1, the better. We use this coefficient in the pairs trading strategy.
How to set up the Correlation Coefficient Indicator on your Chart?
- If you are using Zerodha Kite, follow the below-mentioned steps.
- Select the stock you will trade from your MarketWatch.
- Open the chart of that stock.
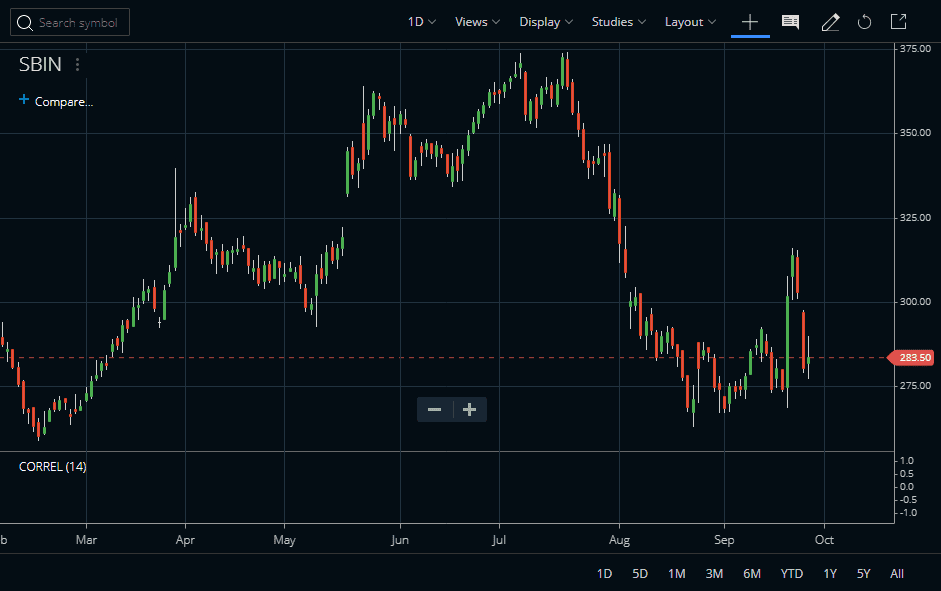
- From the Studies section go to Correlation Coefficient and click on it.
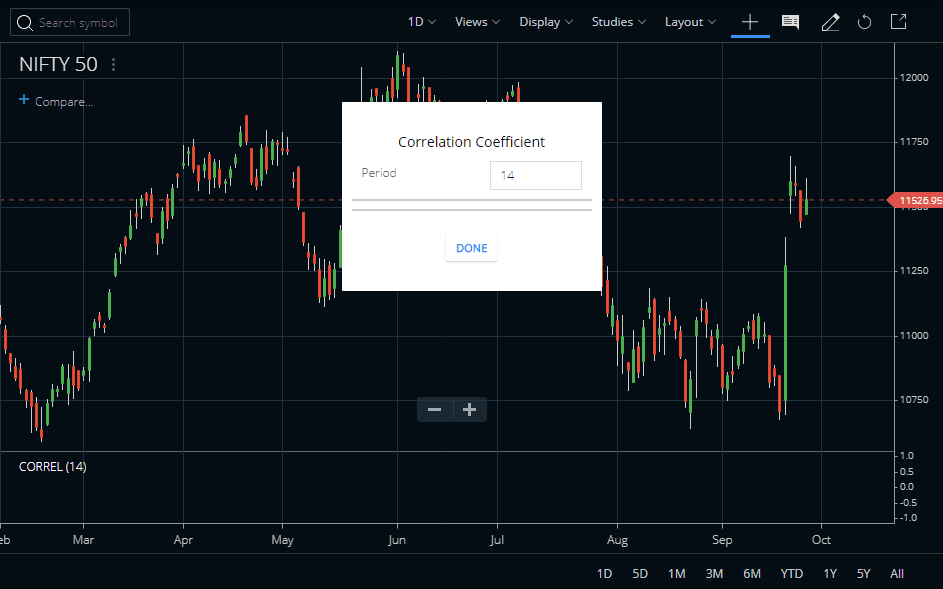
- The default parameter window will open showing 14 as the default period.
- Click the DONE button and the indicator will plot on the charts.
- But you can only see a blank window on the chart because this indicator will only be activated if you compare one stock with another.
Usage of Correlation coefficient Indicator
For Health Checkup of Diversified Portfolio by Comparing Stocks Side-by-Side
Time needed: 1 minute
How to compare stocks side by side in Zerodha?
- Click the 3 vertical dots
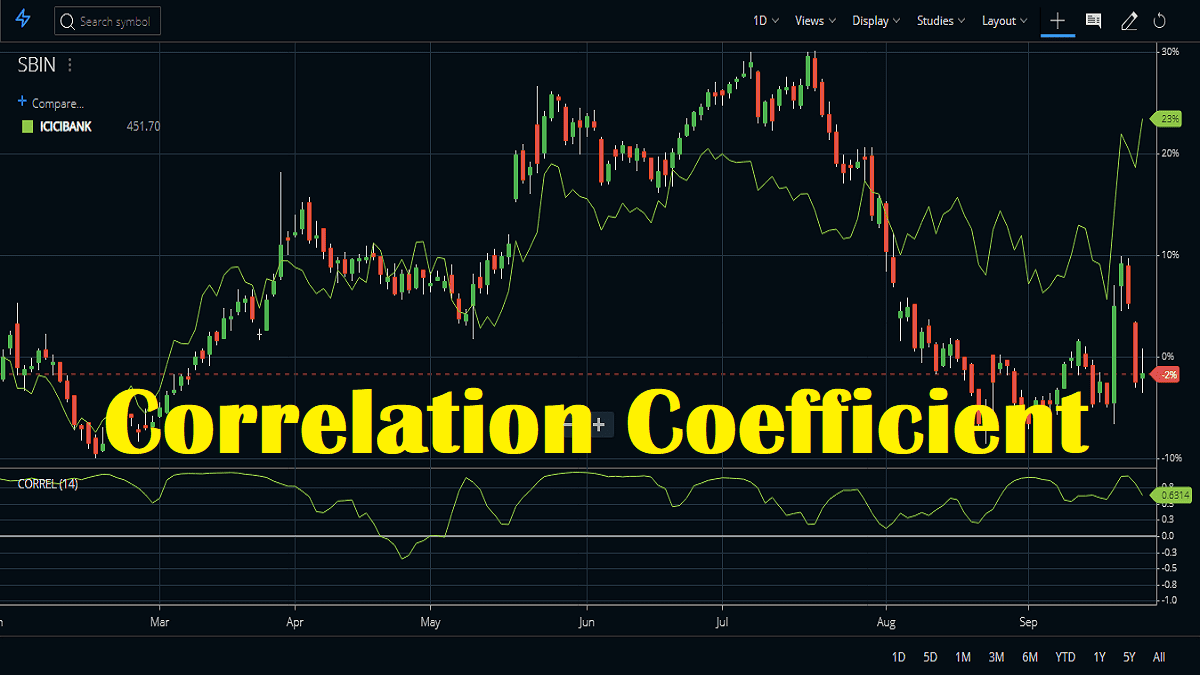
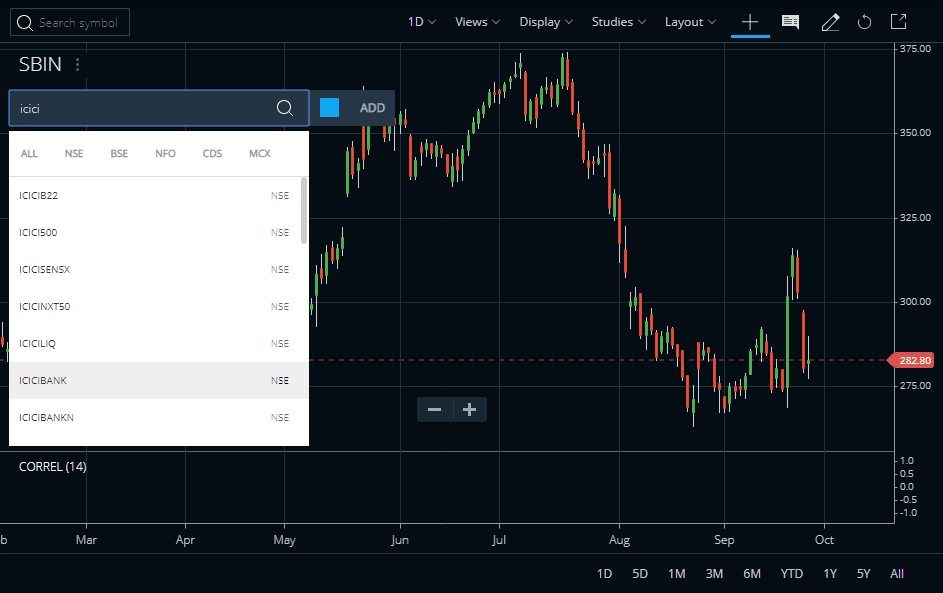
The picture below shows the correlation between SBIN (State Bank of India) and ICICI Bank. To compare two stocks open the chart of one stock (here State Bank of India) and click the three vertical dots beside the name. This will bring up the Compare option.
- Select the stock you want to compare
Now click on the Compare option. This will open up a drop-down list. Select the stock you want to compare from this drop-down list. Here we selected ICICI Bank.
- Add 2 stocks side by side
This will add the two stocks side by side. If you have the Correlation Coefficient indicator attached to the chart you can see now the indicator is visible and ready to correlate these two stocks.
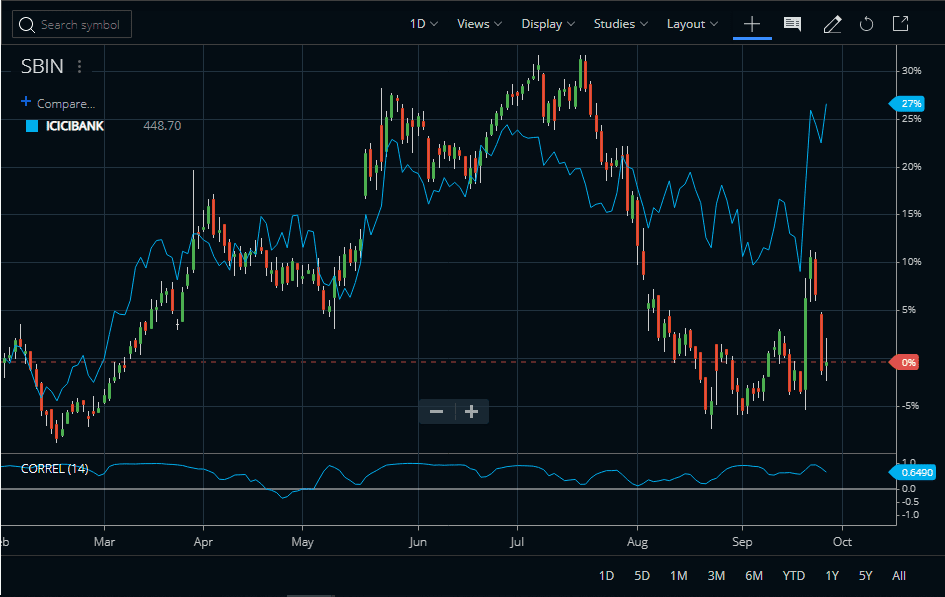
Correlating Two Stocks
As we know the Correlation Coefficient indicator can compare two stocks side by side. Here if SBIN and ICICI Bank move in the same direction with the same magnitude, the indicator will also start moving in that direction. This indicator is an oscillator and it oscillates between +1 to -1. When the indicator is close to +1 it means these stocks are perfectly correlated. If SBIN rises by 5%, ICICI Bank will also tend to rise by almost 5%. And when the indicator is in negative territory, it indicates the stocks are not well correlated. We can find the winner or laggard in our portfolio in this way by correlating them.


The Correlation Coefficient indicator can also be used to determine the correlation between a stock and an index or a stock with an exchange-traded fund (ETF). This indicator is positive when both securities move in the same direction, either up or down and it’s negative when both securities move in an opposite direction. A reading above 0.5 denotes a strong correlation while any reading below -0.5 denotes a very wide divergence.
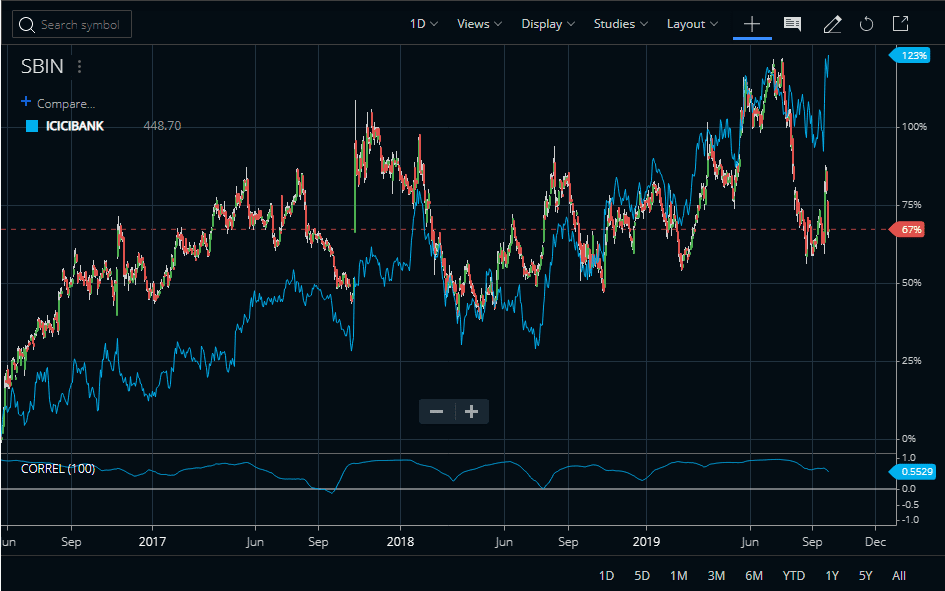
Tweaking the default parameter
To monitor the correlation over a long period of time, we may change the default settings of the indicator. Let us make it 100 from 14. This will make the indicator smooth and can find the correlation between two stocks over a long period of time. Watch the image below.
Pair Trading using Correlation Coefficient indicator
We can do pair trading in two stocks using this compare option and correlation coefficient indicator. Create a short sell in SBIN and a long position in ICICI Bank when the correlation is above 0.5 and closer to 1. Make the trades simultaneously. Exit when the price reverses and the correlation goes below zero. Both the exits have to be done simultaneously. The pairs trading strategy follows the mean reversion theory.
The indicator works well in the daily time frame creating buying and selling opportunities simultaneously. For pairs trading, other indicators are also used in conjunction with this indicator.
Conclusion
The correlation coefficient indicator correlates to two stocks or indices. It is now available in major Indian trading platforms like Zerodha Kite etc. The indicator oscillates between a reading of +1 to -1. A reading close to +1 means the stocks are closely correlated and a reading close to -1 denotes the stocks are not so well correlated. Last, but not the least, this indicator can also be used for pair trading.


