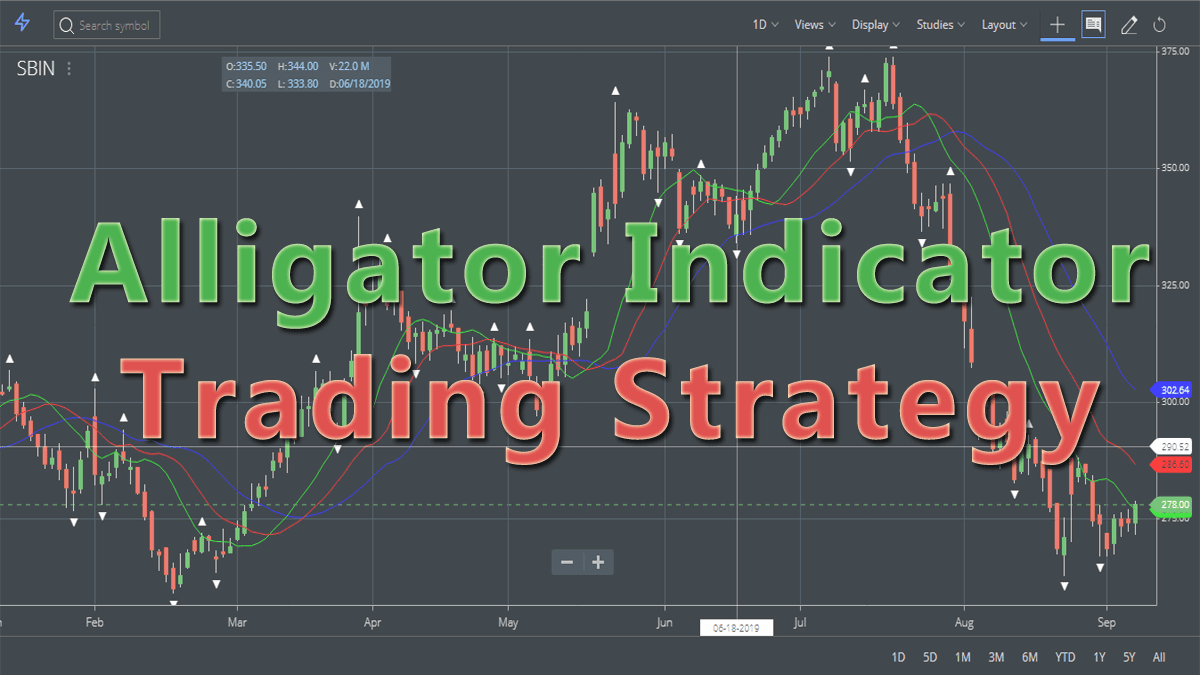
Alligator indicator trading strategy is used by traders to gauge the long and short-term trends of the market/ stock over a specific period of time. This indicator identifies the trend change by using its three constituent components. In this post, I shall discuss the formula or calculation, and trading strategy using this indicator. I will also provide a free PDF to trade using this indicator.
Alligator Indicator Formula
Bill Williams of the Profitunity Trading Group has invented this indicator. Alligator indicator trading strategy uses three components, the 13-day simple moving average (SMA), an 8-day simple moving average, and a 5-day simple moving average. The 13-day SMA is known as alligator jaw and is indicated by the blue line, the 8-day SMA is teeth and colored red and the 5-day SMA is known as lip and has a green colored line. This is now a part of the studies in Upstox trading platforms and also in Zerodha Kite.
How to attach the Alligator indicator to the chart?
In Zerodha Kite
- Login to Kite and open your MarketWatch.
- Choose the stock you want to analyze and open its chart.
- The chart window of the stock opens.
- Click on the STUDIES.
- Select Alligator and click on it.
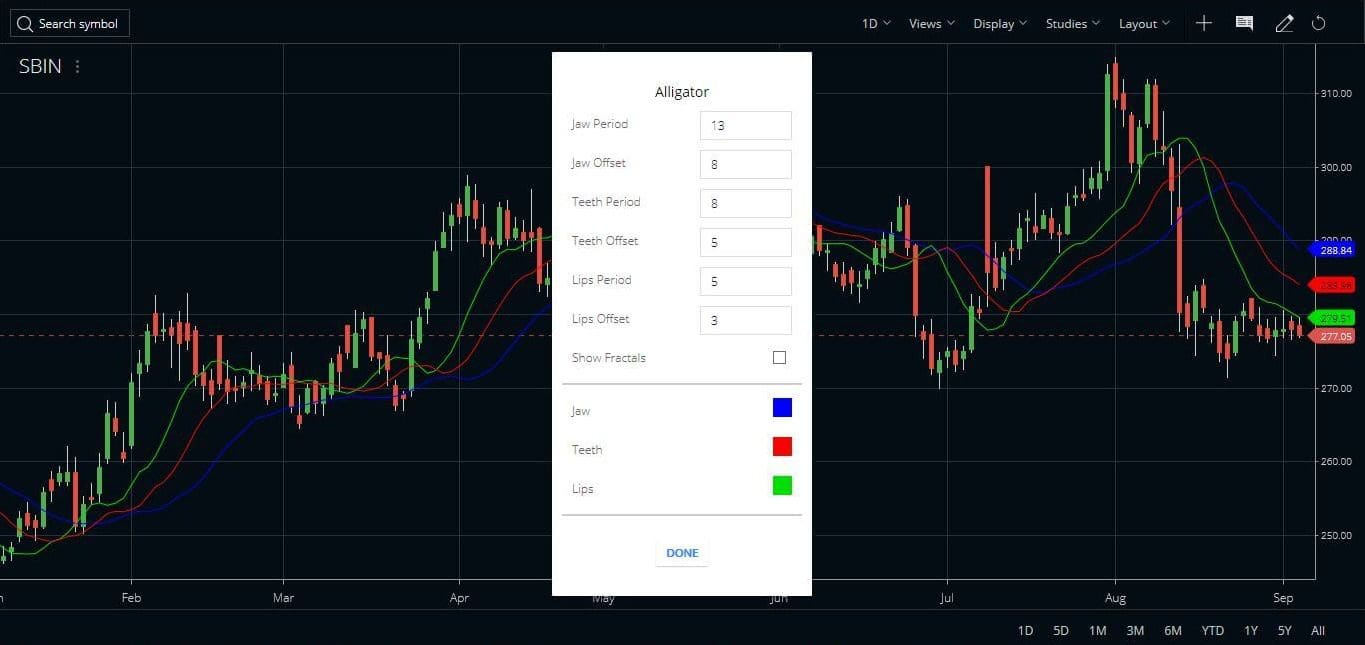
- A small window opens with the default parameters of the indicator.
- The default parameters are Jaw Period 13, Jaw Offset 8, Teeth Period 8, Teeth Offset 5, Lips Period 5, and Lips Offset 3.
- We can change the default parameters as per our own requirements.
- You can also choose Fractals on the chart.
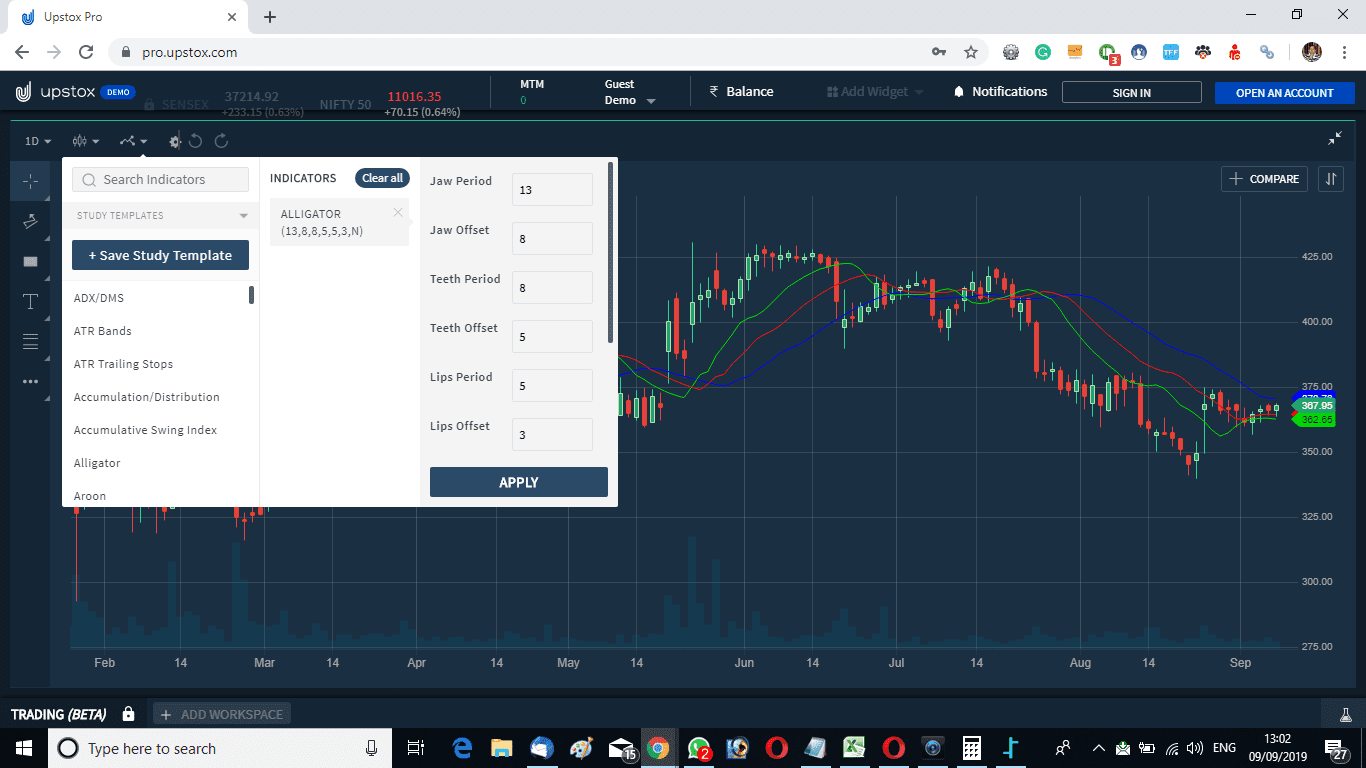
In Upstox Pro
The Alligator indicator is also available on the Upstox trading platform. It has the same parameters as Zerodha. Check the image below to understand what it looks like in the Upstox Pro platform.
Alligator Indicator FAQ
The alligator indicator is invented by Bill Williams of the Profitunity Trading Group. It is actually a combination of 3 moving averages shifted by some variable periods. The default moving averages in the setup are 13, 8, and 5 moving averages. This indicator is particularly good in trend trading.
The alligator is a combination of moving averages or balance lines on the chart. The first balance line is called the Jaw. The second balance line is called the Lips and the third one is called the Teeth. These lines help us to identify when there is no trend in the market. It also helps us in understanding when the trend is forming and in which direction. When these lines are close together it denotes no trend. On the other hand, when these balance lines are far from each other it denotes a strong trend in the market.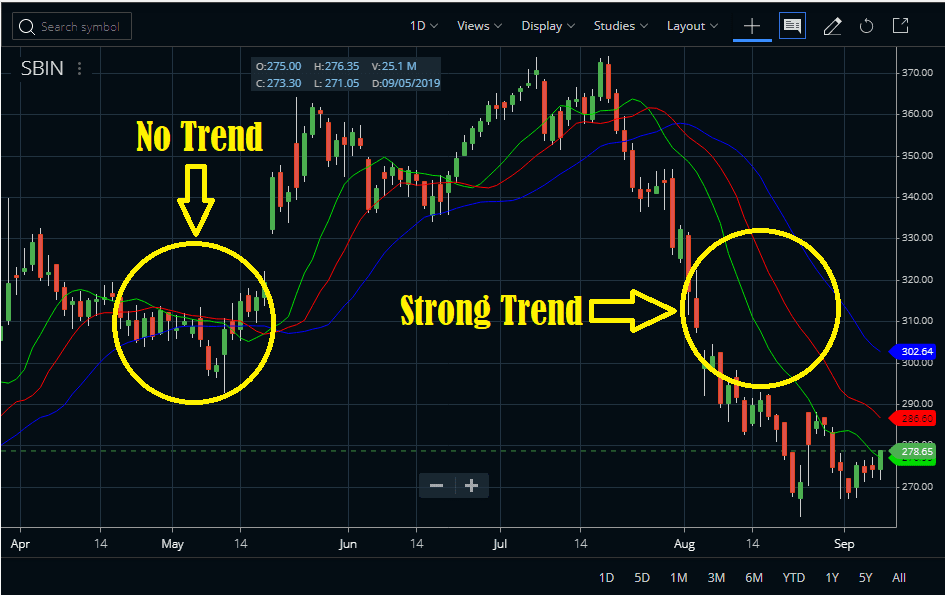
Alligator indicator trading strategy
- The Alligator indicator is best to use on a daily time frame.
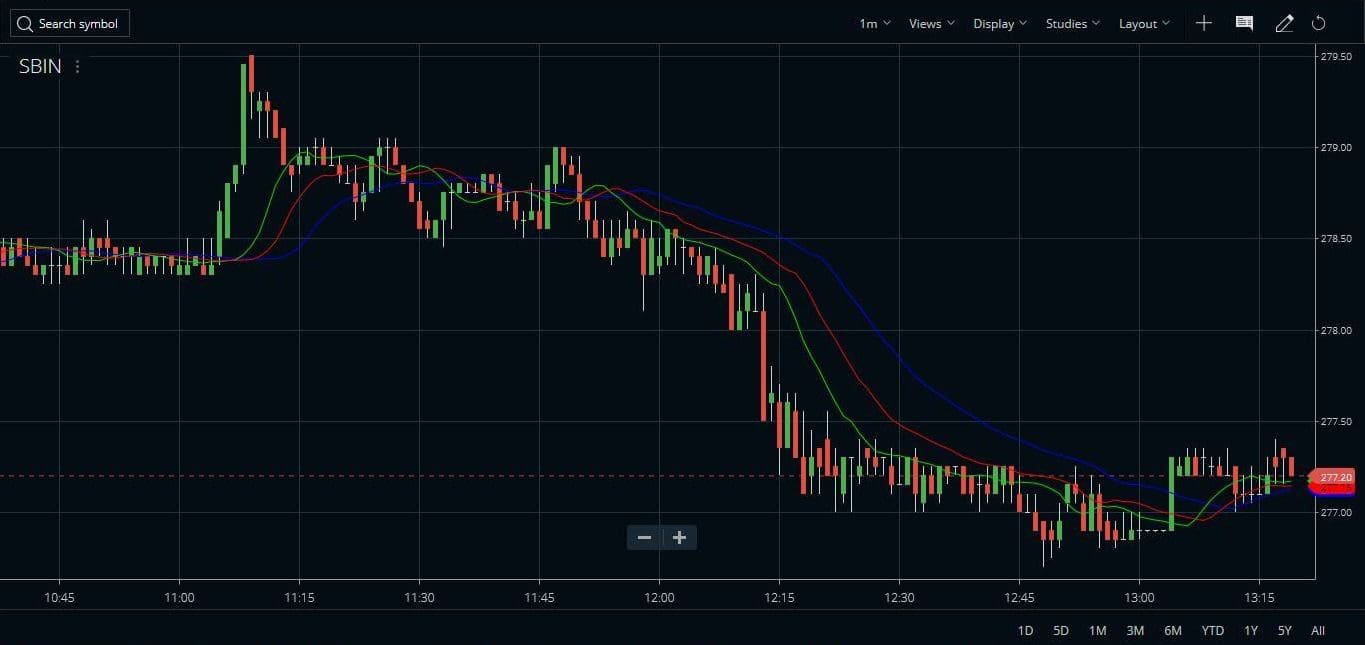
- The picture above shows the State Bank of India (SBIN) stock price movement with respect to the alligator indicator.
- The chart daily timeframe charts.
- In a very simple sense, we can create a short position when the green line or lip crosses teeth and jaw downwards.
- Understanding the correct price trend from the Alligator indicator is important before creating a position.
- We can close the short position when the green line or lip goes up and crosses the red and blue lines, which are the jaw and teeth in an upward movement.
- We can then also enter a new buy position at the same time when we close a sell position.
Traders generally use the Alligator indicator with the Awesome Oscillator or AO, the Acceleration Oscillator or AC, and the Gator Oscillator. The fractal points are also shown on the charts recommended by Bill Williams. Check the image below to understand how the full trading system works.

Advanced trading strategies using the Alligator Indicator
The first wise man candle
This signal is formed only with the Alligator indicator. We need no other supporting indicators. When the price is trading far away from the alligator lines, this setup is very useful to identify probable turning points. We will look for a divergent bar. A divergent bar in a downtrend is a bar having a lower low than the previous bar but closes in the top 50% of the bar. Similarly, a divergent bar in an uptrend is a bar having a higher high than the previous bar but closes in the bottom 50% of the bar.


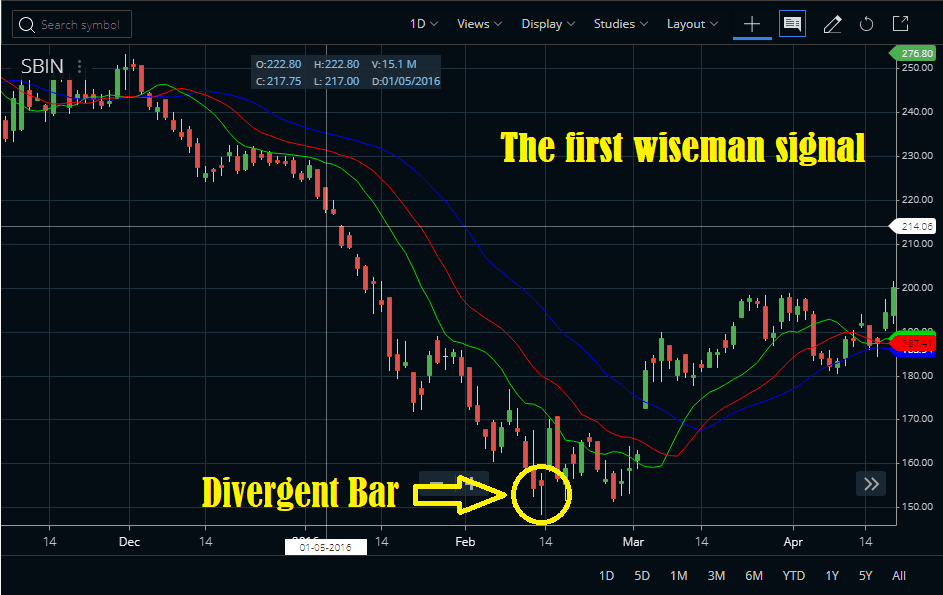
Once a divergent bar is formed in a downtrend look for a break of the high of the divergent bar to enter a buy position. Keep a stop loss of the low of the bar. In case the market is in an uptrend look for a break below the low of the divergent bar to enter a short position. Keep the stop loss of the high of the divergent bar.
The second wise man
The second wise man candle can not be identified using the Alligator indicator alone. Rather you need the Awesome Oscillator to identify the second wise man. Hence, I am not discussing this setup here.
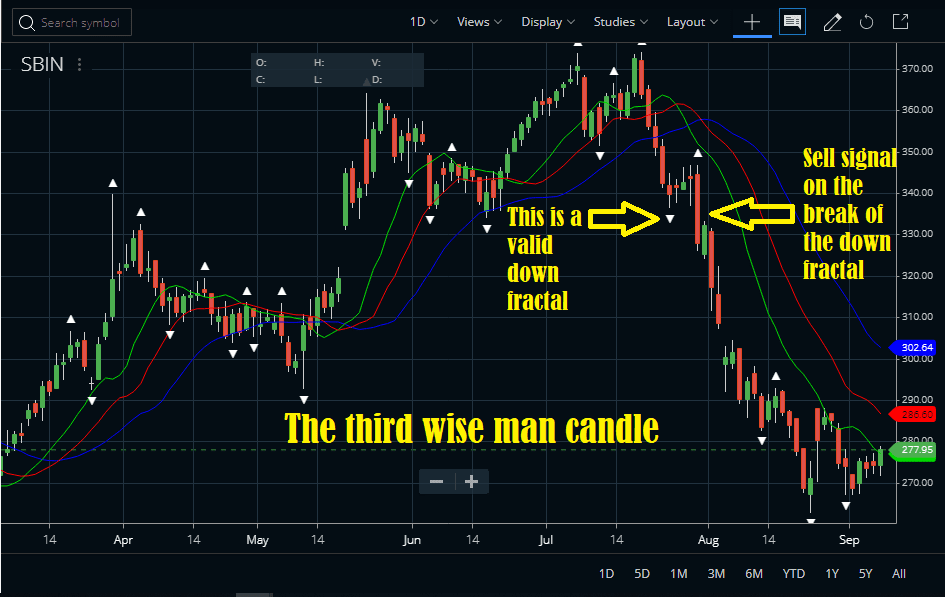
The third wise man candle
We can again identify the third wise man candle only with the Alligator indicator. We must turn on the fractals. When an up fractal is created above the alligator lines it is a valid up fractal. Similarly, when a down fractal is created below the alligator lines, it is a valid down fractal. The buy signal according to the third wise man is when the up fractal breaks on the upside. We can keep the stop loss below the last divergent bar. Similarly, the sell signal is a break below the valid down fractal. We should keep the stop loss above the last divergent bar.
The Alligator indicator trading strategy was vastly used in the Profitunity trading system by Bill Williams. In our other post on the Profitunity trading system, readers can know more about this strategy. Overall this strategy is a trend-following strategy and one can trade it with much accuracy if he considers fractal breakouts in the same direction as the Alligator indicator trend.
Suggested Reading and Alligator Indicator PDF
The best book on this subject is Trading Chaos: Maximize Profits with Proven Technical Techniques (A Marketplace Book) by Bill M. Williams. The book is available in both Kindle and Hard Cover formats.
We here present you a sample chapter eight of this book. The name of this chapter is “Mighty Alligator”. You can also buy the book below.

Conclusion
The Alligator indicator is a trend-following indicator. Bill Williams of the Profitunity Trading Group has invented this indicator. This is a combination of 3 moving averages. Fractal is another important component of this. We can trade this indicator with high accuracy.


Dear Indrajit,
Thank you for the strategy explanation.
“Jaw (Blue Line)- 13 periods SMA (Simple Moving Average) with a future offset of 8 bars.” May I know how to calculate a future offset of 8 bars in Excel?
I am stuck with it. Any kind of help would be much appriciated.
Thanks
Krishna
There is an offset function in excel so far I know.
Dear sir.
Thank you for the Alligator Indicator Trading Strategy Formula.
Sunny, welcome 🙂