The Gator oscillator is a stock or forex trading tool that is developed by Bill Williams. This Oscillator is an auxiliary oscillator to the mighty Alligator indicator. It is most useful in markets that display strong directional action. This oscillator is presented as a histogram with red and green bars. It was originally presented in the Profitunity Trading System (see the image below).

Common FAQ
This is a supplement to the Alligator indicator. This indicator shows the absolute degree of convergence-divergence of the Alligator’s three short-moving averages. This is pointing towards the Alligator’s periods of slumber and awakeness in the trending and non-trending market phases. It also identifies trend changes in securities prices. The main difference between the Gator Oscillator and the Alligator Indicator is that the former uses a histogram while the latter uses moving averages.
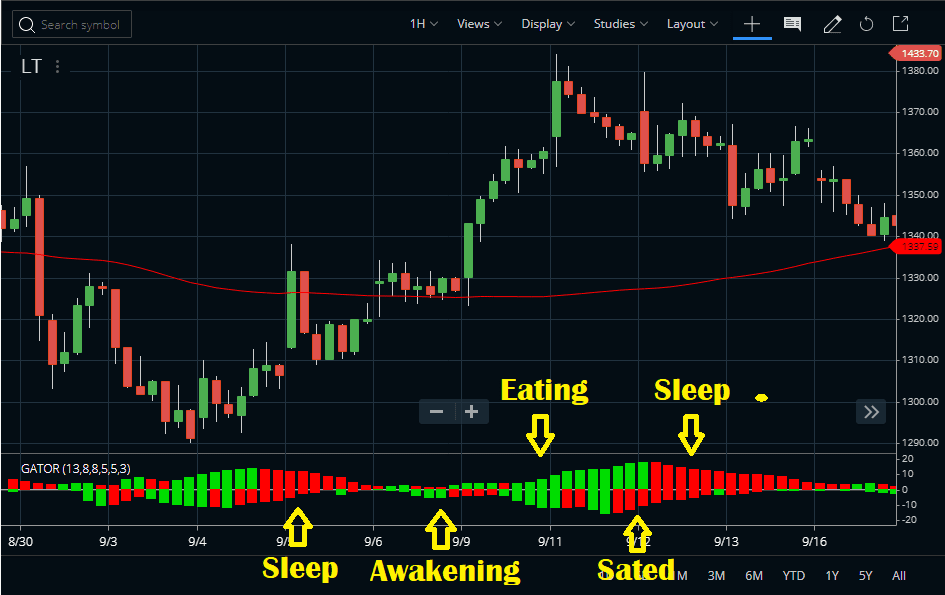
This oscillator indicates that the trend goes through 4 phases. 1) The sleeping or exhausted phase 2) The awakening or forming phase 3) The eating or strengthening phase and 4) The sated or running out of momentum phase. The Gator Oscillator indicator helps to identify these 4 phases in a trend lifecycle. It helps you to enter a trend as it forms and exit before the trend ends.
The Gator oscillator is a technical indicator used in trading. This provides an easy way to spot turning points in markets. Traders use the Gator oscillator to identify potential buy/sell signals as well as long-term market trends by looking for crossovers between different averages. You can adjust parameters such as the timeframes or smoothing techniques utilized when making decisions on positions and risk management strategies.
The Alligator is a trading tool created in 1995 by Bill Williams. He wanted to combine price volatility with longer-range trend movements using three moving averages. It’s effectively an independent self-contained method of analysis. But, it can also be combined with other indicators such as RSI and MACD just like any other technical analysis strategy. By comparison, the Gator Oscillator simply represents two Smart Moving Average values which form dynamic support and resistance levels based upon past movement history. This helps pinpoint areas where buyers are likely to enter/exit positions.
Gator Oscillator Indicator Calculation
First, calculate the difference between the long-term moving average which is the blue line, and the medium-term moving average which is the red line bars above in the 0 (zero). Then calculate the difference between the medium-term moving average which is the red line and the short-term moving average which is the green line bars below in the 0 (zero). In the Alligator indicator, the Jaw is the blue line, Teeth is the red line and Lips is the green line. But the oscillator consists of only green and red bars. Here each time period is represented by 2 bars, on top of the other.
Adding The Gator Oscillator Indicator On Charts
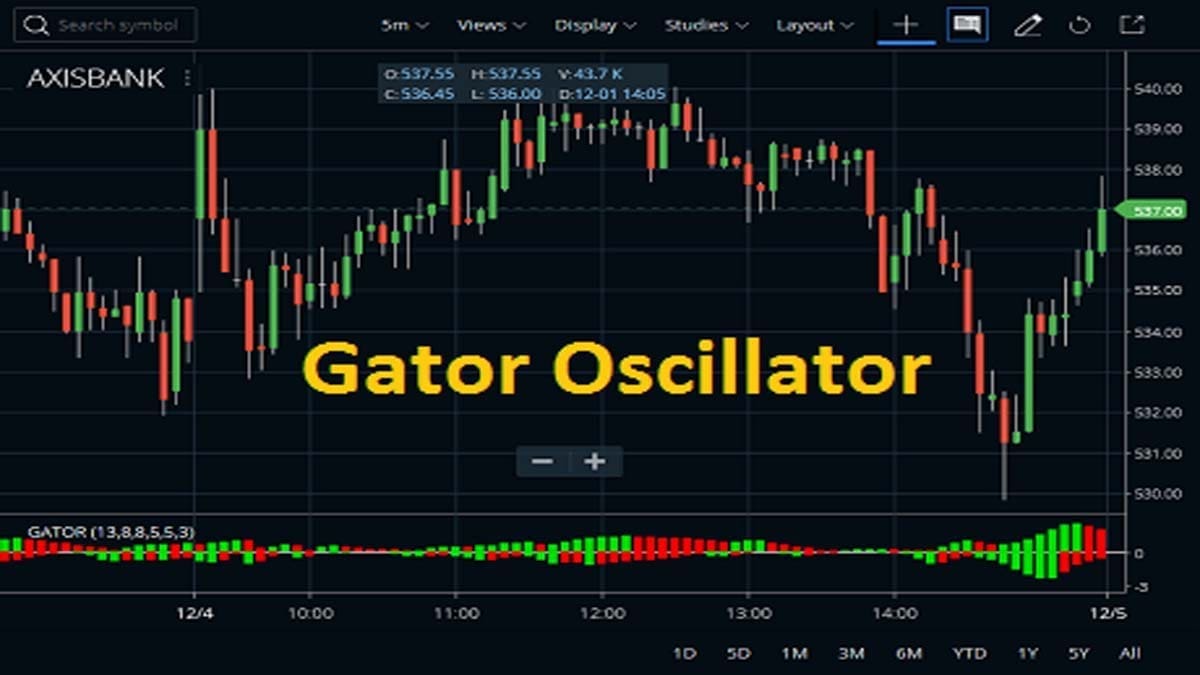
In Zerodha Kite one can attach the indicator from the STUDIES section with the following default settings. Jaw Period is 13, Jaw Offset is 8, Teeth Period is 8, Teeth Offset is 5, Lips Period is 5, and Lips Offset is 3. See the Axis Bank chart image below:

How To Trade With The Gator Oscillator Indicator?
The different stages of the oscillator in “Alligator” with two symmetrical bars. One is above the 0 line and another is below the 0 line. Sometimes both bars are green, sometimes both are red and sometimes they are of both colors. A green bar indicates the trend is stronger than the previous price action. While the red bar indicates that the trend is weaker than the previous price action.


Identifying The Trend Phases
The Gator awakes, when one of the bars above or below the “0” line then it is red, and the opposite one is green. When both symmetrical bars are green then the Gator eats. The gator is sleeping, when both bars above and below the centerline are red. In this Oscillator after an ‘eating’ phase, one of the upper or lower bars around the centerline turns red the Gator is said to be sated.

It does not matter whether the red or green bars are above or below the zero lines as long as there is one of each.
How To Trade With The Gator Oscillator Indicator?
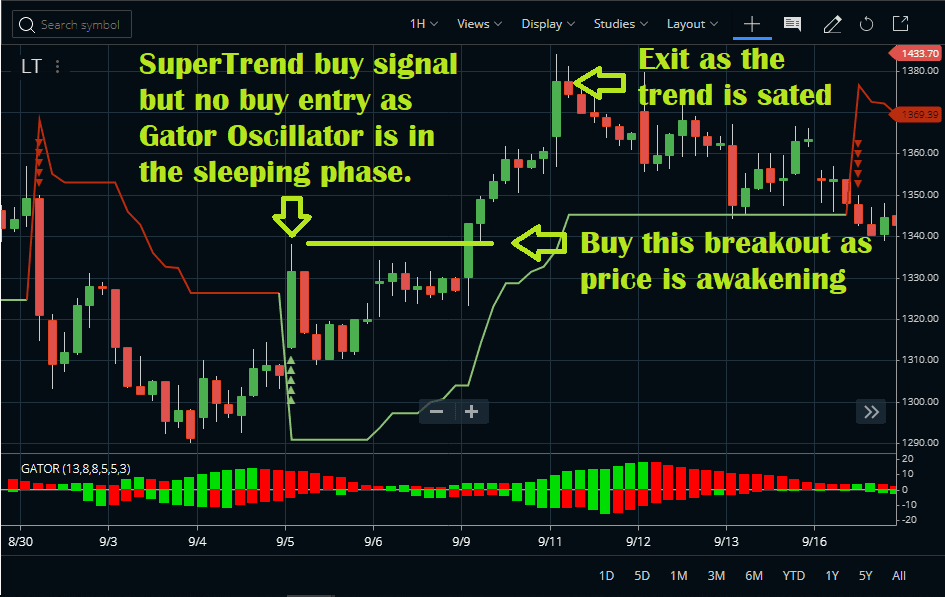
When you are using this indicator you will want to enter when in the awakening phase. You will then hold your position during the eating phase and book the profit by exiting your position in the sated phase as the trend will be near completion. This oscillator is based on a system of moving averages. Hence, you should keep in mind that there can be a time lag between price changes. Also, this oscillator tells you how strong or weak a trend is. It will not give you an idea of the direction. Hence to understand the trend you must use a supporting indicator like the Alligator or the SuperTrend.
In this oscillator when a phase of the trend is at its incipient stages, one of the upper or lower bars will turn green, then a phase of the trend accelerates. The trend reaches its climax increasing the number of ‘double greens’. Here both the upper and the lower bars are green, so this is the eating phase. In this oscillator, the eating phase runs out of energy and begins to slow down. Then one of the previously green bars will turn red, signaling that the gator is sated. In this oscillator when both bars are red, then the phase has ended, anticipating a new cycle.
Pros And Cons
The Gator Oscillator’s advantage is the compactness of its display. Instead of drawing three separate SMAs on the chart the bars below leave enough space for the application of any number of additional indicators into the price data.
This Gator Oscillator’s main problem is its complicated nature. It is essentially a combination of three moving averages. Whether the addition of the graph at the bottom contributes much value or merely complicates the picture will probably depend on your trading style. Its problem of trading with a moving average must be taken into account while a trader is making use of the Gator Oscillator indicator.
Conclusion
The Gator Oscillator indicator is a supplementary version of the Alligator Indicator. This indicator oscillates below the price and identifies the phases of the trend. It identifies when the trend is sleeping, awakening, eating, or the sated phase. Based on the identification of trends traders can also plan entry in the market. But using this oscillator with some trend-following pointer is necessary for correct entries.


