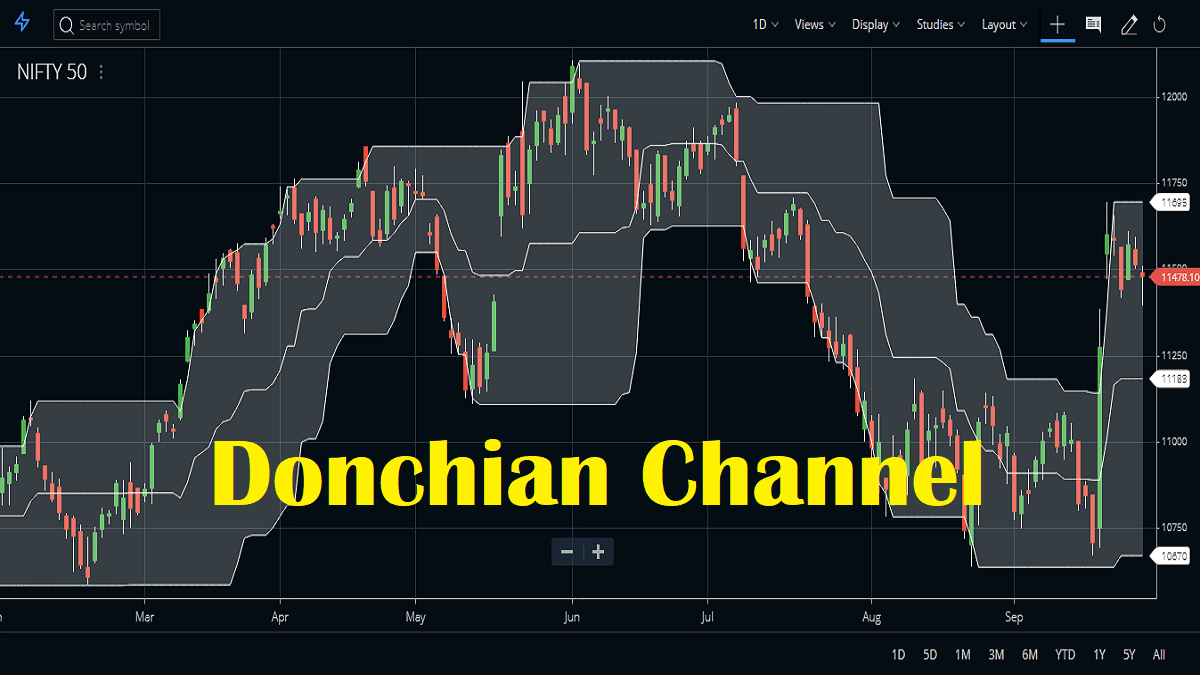
The Donchian Channel indicator was developed by Richard Donchian. It is a technical momentum pointer that calculates the higher highs and lower lows of a specific period of time forming a channel around those values with upper and lower bands. When the traders use this indicator, generally 20-period highs and lows are considered. Also, a middle line is formed around the midpoints of the channel indicating the average value. The channel also shows immediate bottoms and tops of the security price indicating the important support and resistance zones.
Donchian Channel FAQ
The Donchian strategy was developed by Richard Donchian. This strategy uses a 20-period high or 20-period low as support and resistance. When this support or resistance breaks that can be considered as a trading signal.
The price channel indicator surrounds the price and then moves with the price. In general, the price channels are volatility indicators. They change their shapes with the change in volatility. There are different types of price channels, eg. Bollinger Bands, Donchian Channel, Keltner Channel, etc.
The Donchian Channel uses a 20-period high or 20-period low to form a channel around the price. This can identify the trend. When the channel is moving upwards, the trend is up. On the other hand, when the channel is moving down, the trend is down. When the channel is thin, that is a strong trend condition. Similarly, when the channel is very thick, it denotes there is little or no trend.
If the price closes above the Donchian Channel top it is a breakout on the upside. And when the price closes below the channel bottom it is a breakdown on the downside. We can trade this breakout theory with a suitable stop loss.
Donchian Channel indicator Formula:
- Channel High = High over selected periods
- Channel Low = Low over selected periods
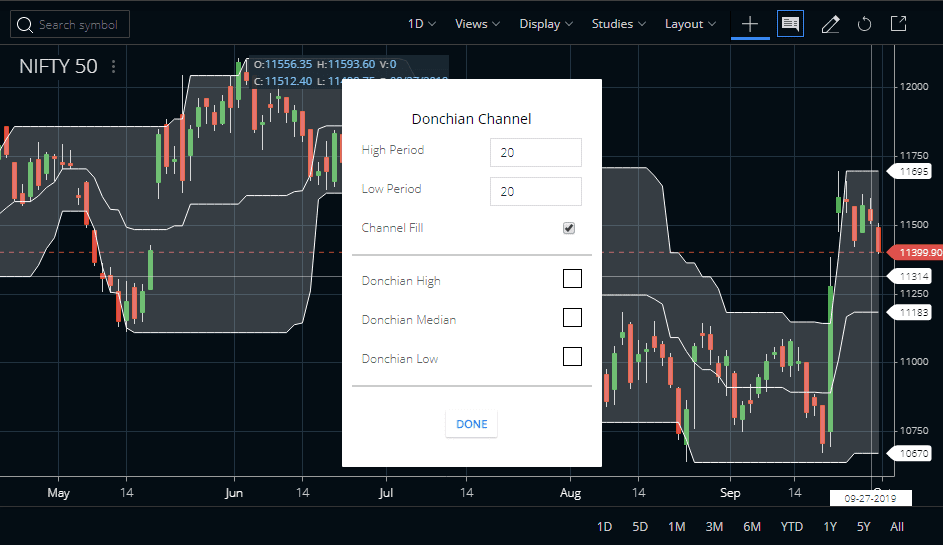
How to Setup Donchian Channel Indicator on Charts?
On Zerodka Kite
- The indicator is available in the Studies section in Zerodha Kite.
- Traders can access it from here and attach it to their charts.
- By default, the indicator uses 20-period highs and lows for calculations which we can change for performance optimization.
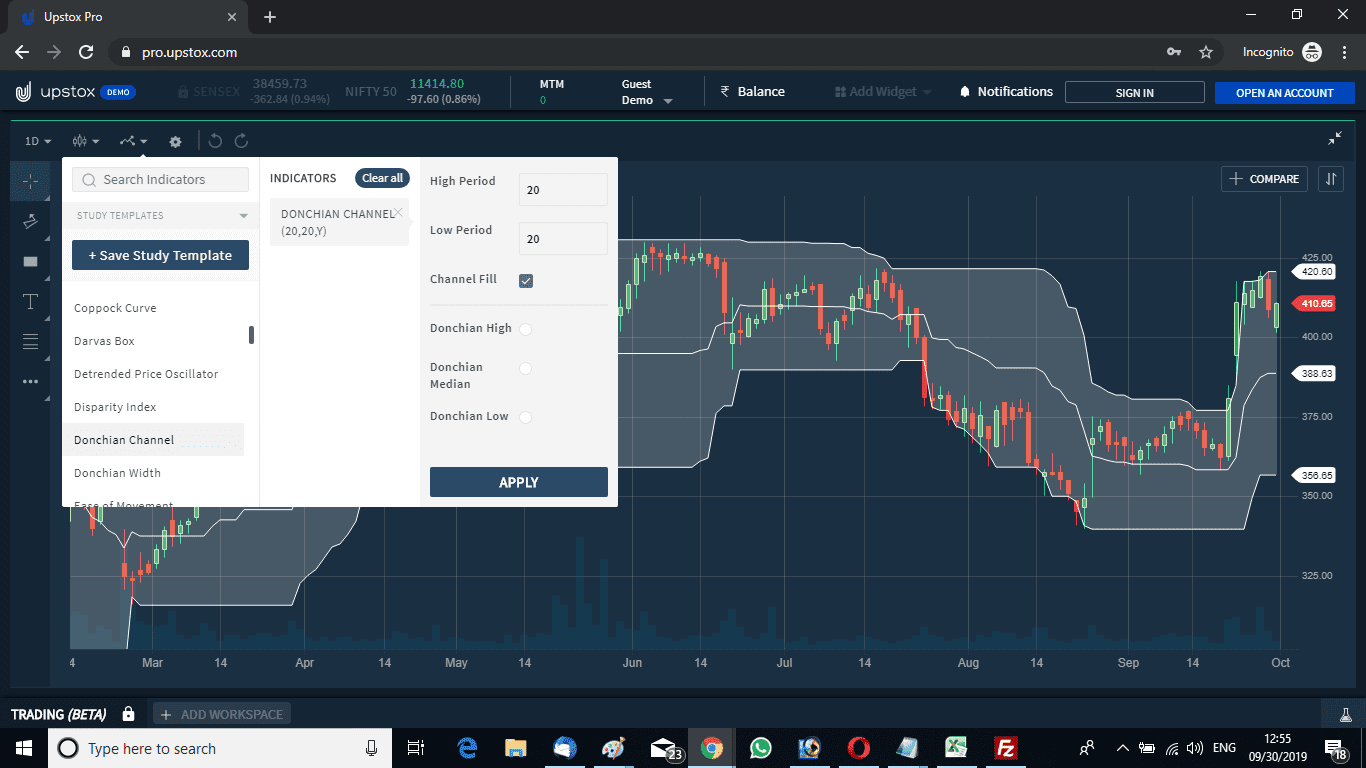
On other stock brokers
Few other stock brokers also provide this indicator in their trading terminals. Upstox also provides this indicator with similar settings on their Upstox Pro terminal.
Donchian Channel Trading Strategy
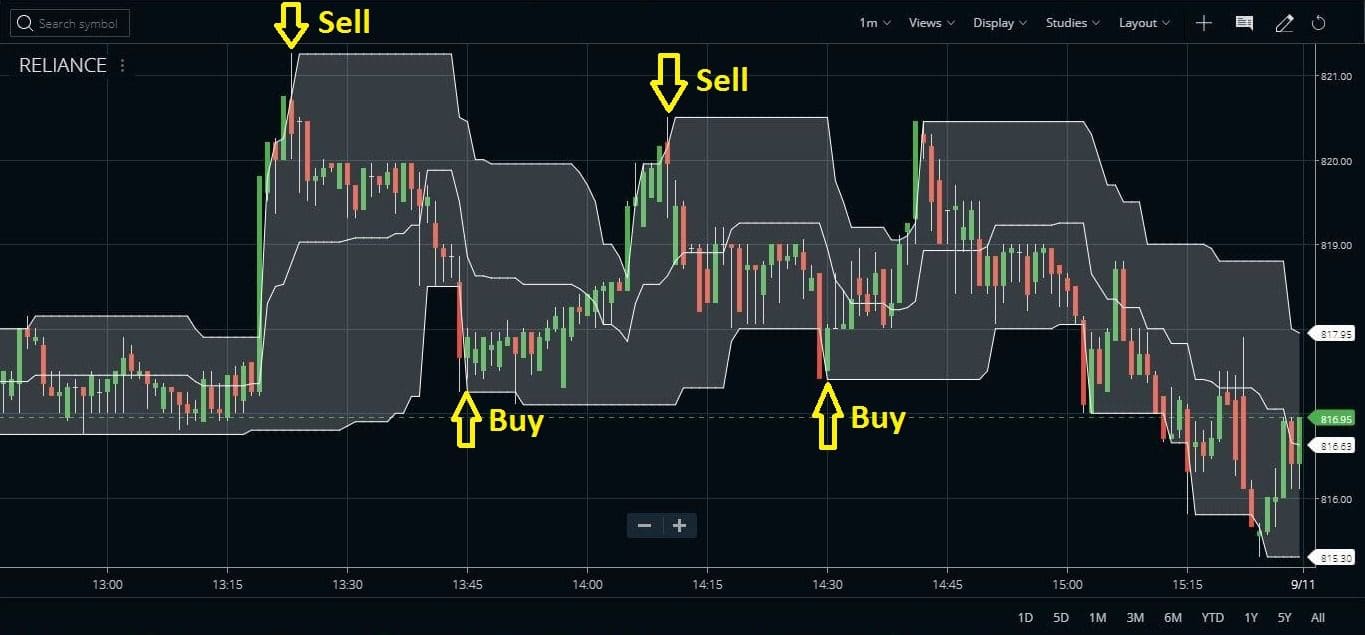
#1 The simple trading strategy
- The indicator generally works on all time frames.
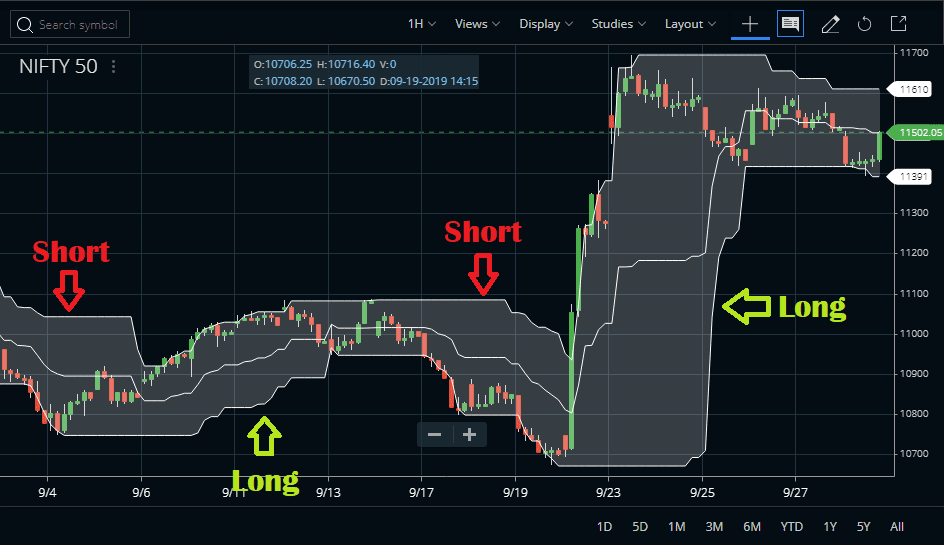
- The image below shows the Reliance share price movement with the indicator.
- Enter a short sell position when the stock price breaches or touches immediate tops shown by the channel.
- Exit from the selling position or enter a fresh buy position when the stock price breaches or reaches the immediate bottom indicated by the channel.
- In lower time frames 1-minute or 5-minute charts, traders may find many whipsaws which will be eliminated in longer time frames. However, scalping traders can trade in lower time frames using this indicator.
#2 Advanced Trading Strategies
The Donchian Channel indicator can be used as a perfect trend indicator. You can see the channel moves in steps. It moves up step by step and again it moves down step by step. So how can we identify the trend using this indicator? When it is bullish or when it is bearish? When the indicator is making upper steps that is bullish and we will play the market long only. Similarly, when the indicator is making lower steps that is bearish and we will play short only.


When the indicator is making higher steps the market is bullish, so we will enter only long trades in declines. Similarly, when the indicator is making lower steps the market is bearish, and we will enter only short trades in rallies. For judging whether the market is in decline or in a rally we will use an oscillator like the Relative Strength Index. If we consider a short variant of the RSI, like the 2-period setting, we can use 90 and 10 as the overbought or oversold zone for the entry.
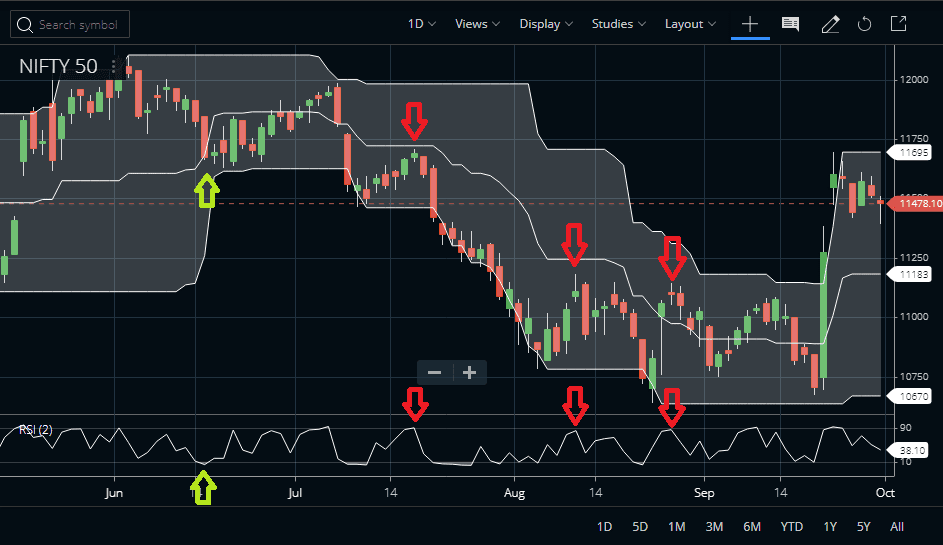
Watch the image above, when the steps were on the upside, we will use the RSI dips to enter long. Similarly, when the steps are on the downside we will use the RSI rallies to enter a short.
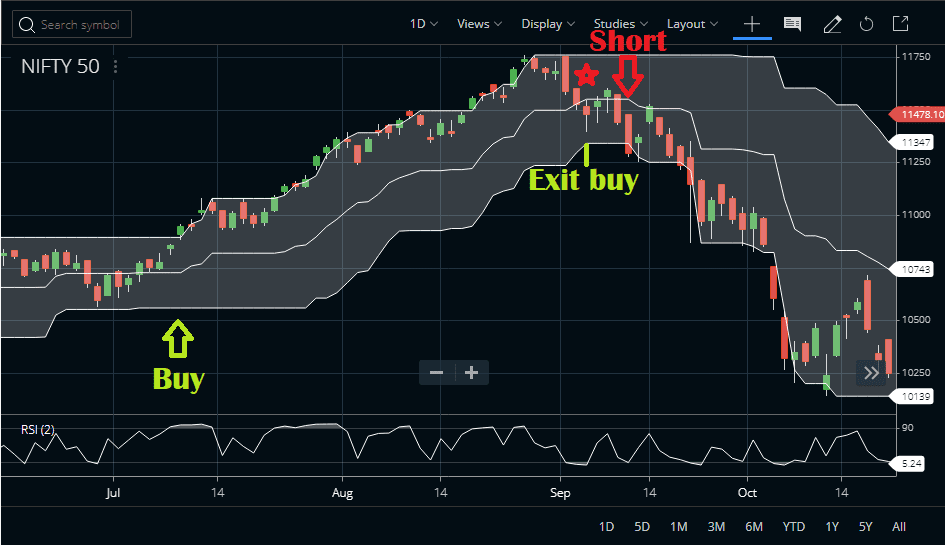
#3 Usage in the Turtle Trading System
The Donchian Channel can be used in developing a trading system similar to the Turtle Trading System. Whenever the price closes above the channel top it is a buy signal. In case the price closes below the middle line, it is an exit from the buy signal. Just like the buy signal, a sell signal is generated when the price closes below the channel bottom. We can enter a short trade with a closing basis stop loss above the middle channel.
Suggested Reading
To know more about this indicator you can read Volatility Indicators: Techniques for Profiting from the Market’s Moves.
Conclusion
Traders can use this Donchian Channel indicator to find out the peaks and troughs of the price pattern. This indicator moves up or down in steps. You can also understand the trend of the market very clearly using this indicator. When the indicator is making steps upside the trend is up and when it is making steps downside the trend is down. A typical usage of the indicator is shown in this trade setup.


