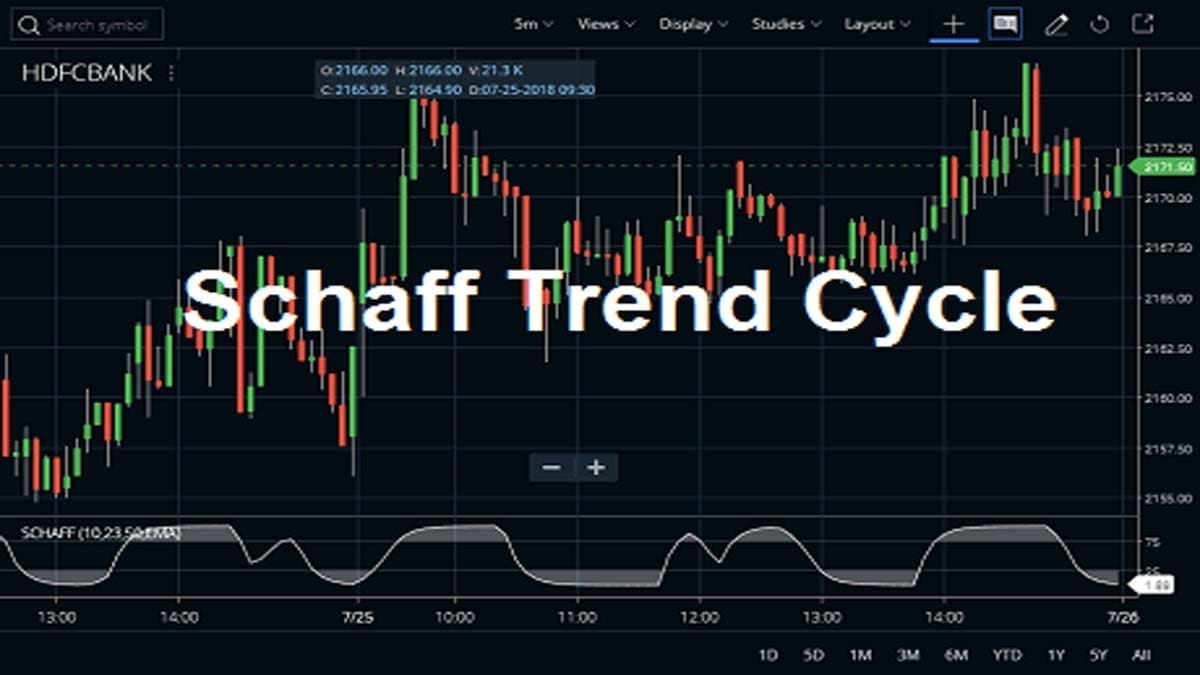
The Schaff Trend Cycle indicator is a cyclical oscillator. This indicator is based on the assumption that currency trends accelerate and slow down in a cyclical pattern. Doug Schaff developed The Schaff Trend Cycle indicator in 2008. This indicator is the product of the moving average convergence/divergence (MACD) which is popular as a trend indicator. But this MACD is also notorious for lagging due to its slow responsive signal line. The STC indicator is relevant as an early warning sign to detect currency trends which gives an improved signal line.
What is the Schaff Trend Cycle?
So, this is a modified MACD line that runs through a modified stochastic algorithm as well as smoothed with Wilders’ smoothing to measure the final Schaff Trend Cycle (STC) indicator. The main purpose is to determine the direction, in which a trend cycle is moving along with possible peaks and bottoms within this cycle.
The Formula of the Schaff Trend Cycle
First of all, the 23-period and the 50-period EMA and the MACD values are calculated:
EMA1 = EMA (Close, Short Length);
EMA2 = EMA (Close, Long Length);
MACD = EMA1 – EMA2.
Secondly, the 10-period Stochastic from the MACD values is calculated:
%K (MACD) = %KV (MACD, 10);


%D (MACD) = %DV (MACD, 10);
Schaff = 100 x (MACD – %K (MACD)) / (%D (MACD) – %K (MACD)).
How to Attach the Schaff Trend Cycle Indicator?
Now let us learn how to attach the indicator on various stockbroker platforms.
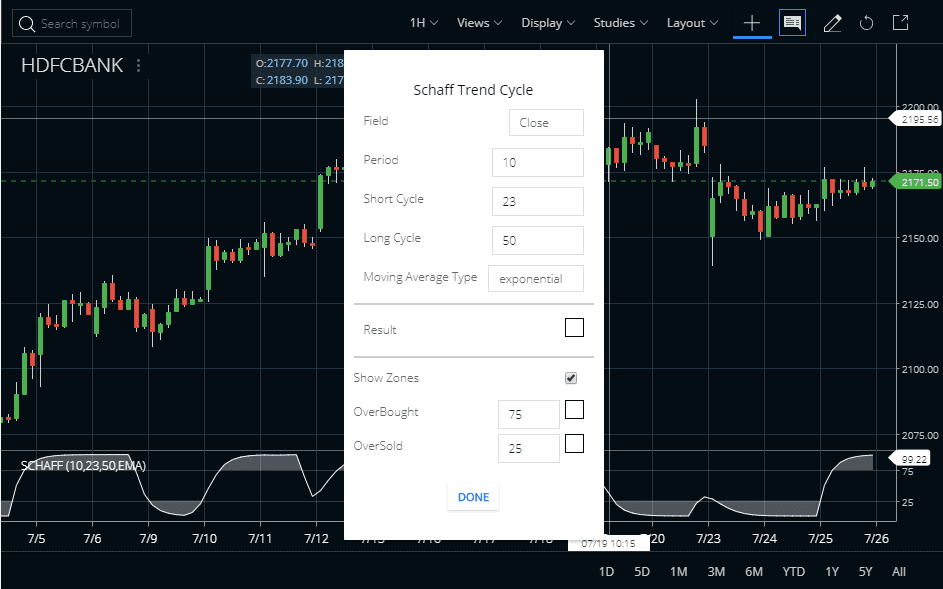
On Zerodha Kite
If traders want to know more about and also use the Schaff Trend Cycle Indicator, then they can find it in the STUDIES section of Zerodha Kite and they can also find out on the mobile application of Kite. The Field is Close you can change this. The Period is 10 and you can change this value to high and low. The Short Cycle is 23 and the Long Cycle is 50. You change the Short and Long Cycle values to high and low. Check the image below to understand how to attach the Schaff Trend Cycle indicator in the HDFC Bank share price chart. You can attach this indicator to any charts like daily, weekly, monthly, or intraday.
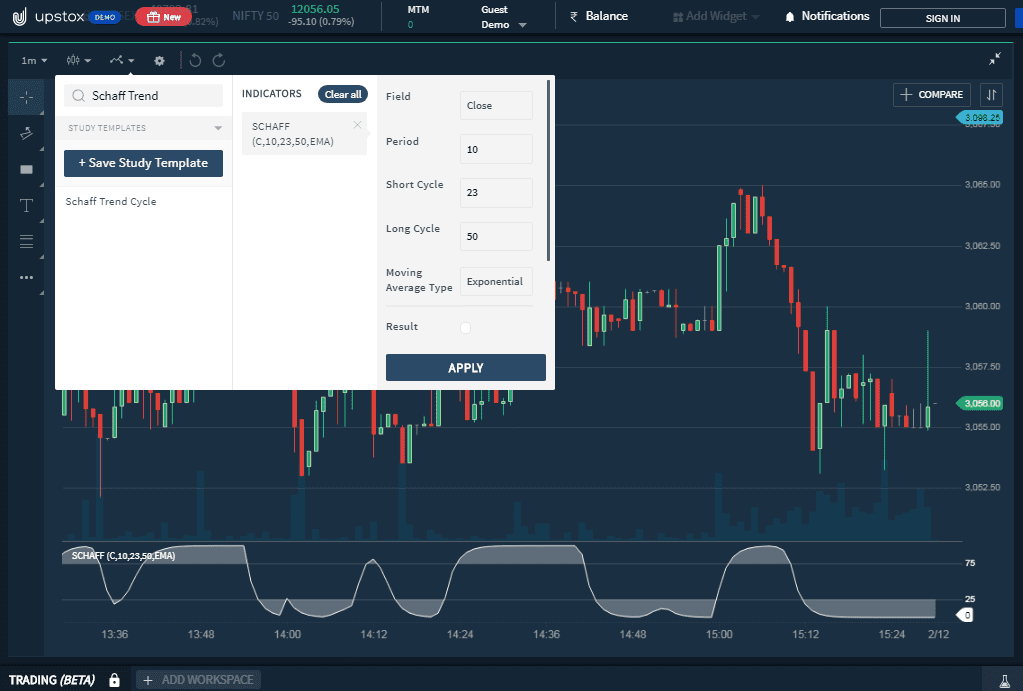
On Upstox Pro
In Upstox Pro, first, log in to an account like Zerodha Kite, then open the chart. After that, type down the name of the indicator and click on apply.
Features of the Schaff Trend Cycle Indicator
- The Schaff Trend Cycle indicator is basically a trend indicator that is run through a cycle oscillator.
- The indicator is also ideal for entry as well as exit signals for trading. Doug Schaff is the developer of the indicator. This indicator is the outcome of his over 20 years of experience in the forex markets.
- The STC basically developed to improve the existing MACD to identify market trends.
- The Schaff Trend Cycle is very much popular among traders due to its simplicity as well as a high level of accuracy.
- As per the information, the STC is more accurate than the MACD. And it also helps in representing forthcoming price movements, quicker than the MACD.
- The strategy of this indicator is quite simple. The indicator seeks to identify trends that happen in a sine wave cycle.
- On any currency pair, the strategy of STC can be used.
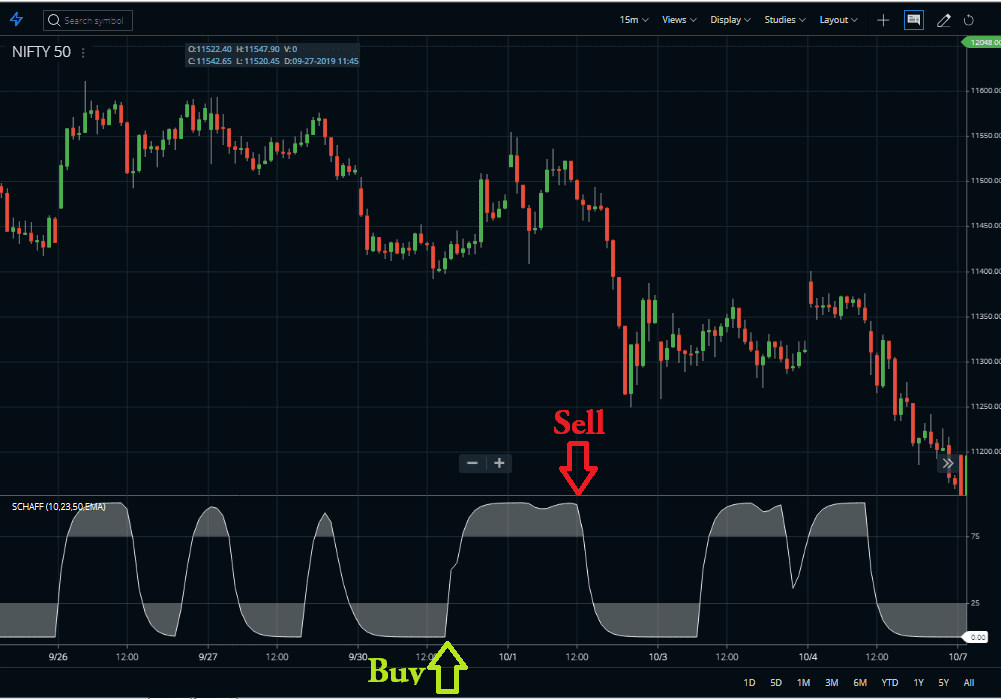
- Basically, Buy and sell points are mainly set at 75 levels upward (buy) and 25 levels downward (sell).
How Does the Schaff Trend Cycle Indicator Work?
Here, I explain, how to understand the readings of the indicator. We can trade this indicator in multiple ways.
Identification of Trend
There are two thresholds present, 25 and 75. When the indicator crosses above 25 lines from below, that is an uptrend. When the indicator crosses below 75 lines from above, a downtrend begins. Once the indicator is between the 25 and the 75 lines, that means the trend is developing in one of the two directions or currently in range.
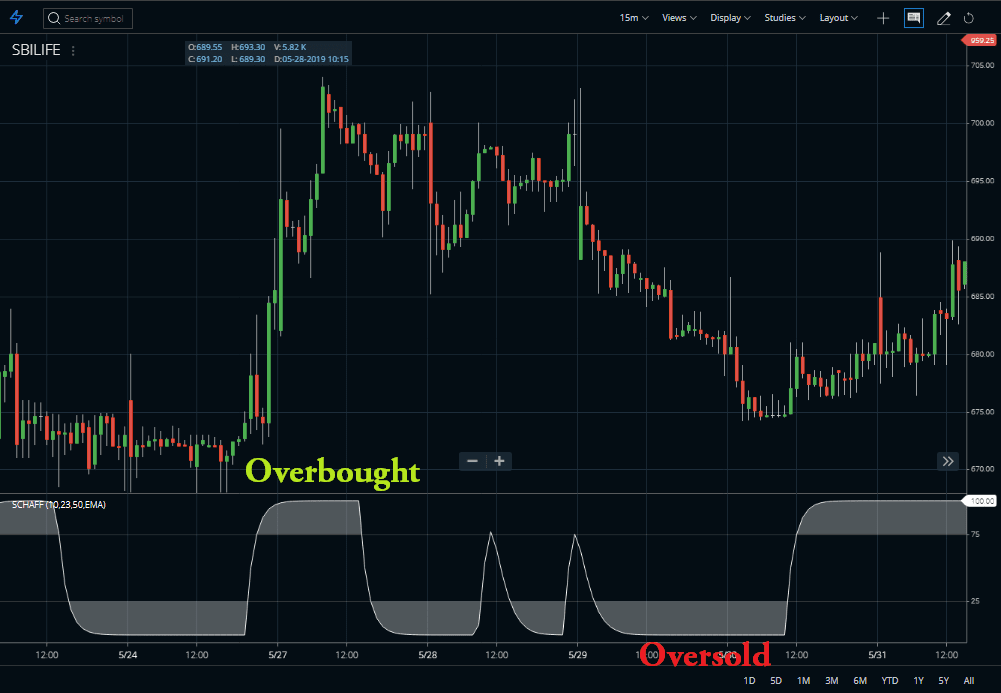
Identifying Overbought and Oversold Levels
The chaff Trend Cycle can also identify overbought and oversold levels. If the indicator turns into a straight line (that only occurs in its uppermost and lowermost points). The asset is either overbought when it is above the 75 lines. Oppositely, oversold once below the 25 lines. In both cases, a trend reversal can happen, but there is no exact timeline.
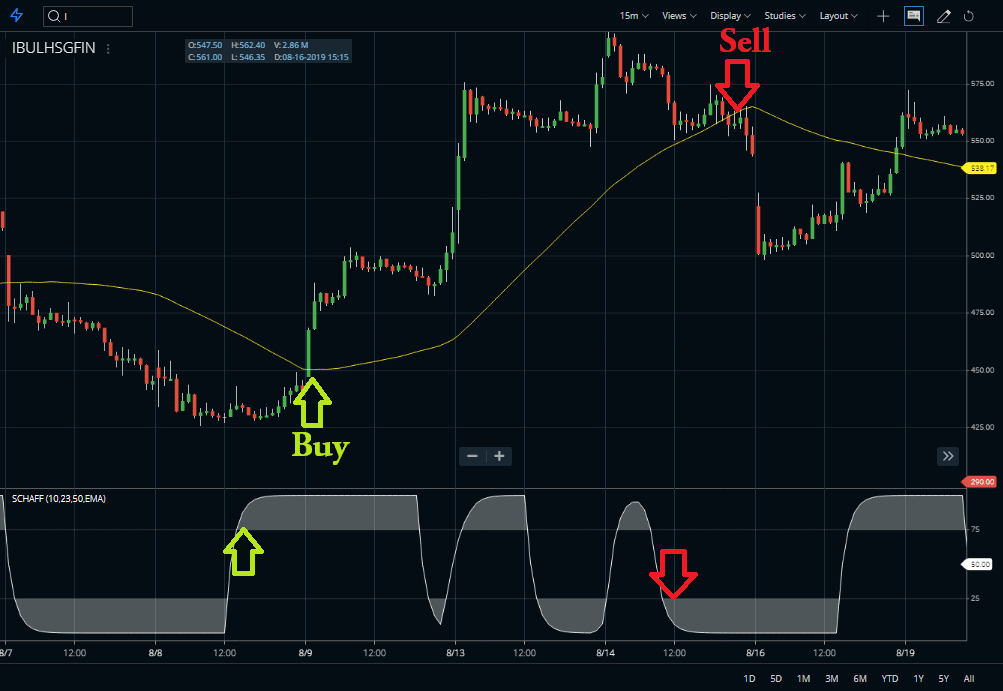
Avoiding the False Signals with Additional Indicators
Now, I will discuss how you can avoid the false overbought-oversold signal. Here, I add 50 SMA (moving average) along with the indicator. Let’s have a look at the chart below. As you can see that once the price crosses the moving averages from below and goes above. You can buy the stock at the crossover. Reversely, when the price crosses the MA line from above and goes below, the downtrend is coming. In this way, you can ignore the extra noise of the STC indicator.
You can also note that, although STC was developed mainly for fast currency markets, traders can use it across all markets, just like MACD. You can apply this to intraday charts, like five minutes or one-hour charts, as well as daily, weekly, or monthly all time frames.
Limitations of the Schaff Trend Cycle
While the particular indicator seems to boast higher reliability in comparison to MACD, it has certain flaws. Like, it can linger in overbought and oversold levels for extended periods of time. Due to this, the indicator is most often used for its specific purpose of following the signal line up and down. And also taking profits when the signal line hits the top or bottom.
FAQ
The Schaff Trend Cycle (STC) indicator combines moving averages and oscillators to measure trends. It’s best used in combination with a momentum or volume indicator for increased accuracy.
The STC consists of a variety of customizable parameters such as fast/slow time periods, fast/slow exponential moving averages, and oversold/overbought levels which can be used to fine-tune the trading signals given by the STC.
Thinkorswim users have access to the powerful analysis tool set up by TradeStation Securities’ IntelliCharts on their platform. This includes an installable version of Michael Streibmuller’s popular Keltner Channel, Volume-Weighted Average – Relative Strength Index (VWAP-RSI)-Stochastic-Schiff Trend Cycle composite charting system available in MT4 format from Forex Factory.
A Scanner helps traders identify entry points based on preset criteria using Technical Analysis methods like Chart Patterns, Support & Resistance Levels, Bollinger Bands, etc. Scanning tools built into the most popular stock market analysis software packages like MetaStock or InvestorRT allow automated scanning on stocks which fulfill certain conditions set out according to custom indicators or proprietary systems algorithms like Schiff Trend Cycle.
Conclusion
Schaff Trend Cycle is a popular oscillator to learn and add to the portfolio of useful indicators. Just remember one thing STC, just like any other technical indicator, is not capable of providing accurate signals 100% of the time. Hence, will return false signals from time to time.
However, STC is a leading tool, which means it sends a signal just before the price move has occurred. It also defines that it lacks the proper accuracy of lagging studies. And should be used in conjunction with other technical analysis indicators.


Nice, but what does the V stand for in the formula
%KV is written on the right hand side to distinguish it from %K