On our site, we have already discussed some of the most applicable chart patterns like head and shoulder, double top pattern, W-shaped or double bottom pattern, etc. Today’s subject is the Symmetrical Triangle Chart Pattern, also known as “coil” or “Isosceles Triangle” because of its appearance. Before moving on to Symmetrical Triangle Chart Pattern Formation, let’s define the symmetrical triangle first. It is one of the most common patterns in the stock market.
What is a Symmetrical Triangle Chart Pattern?
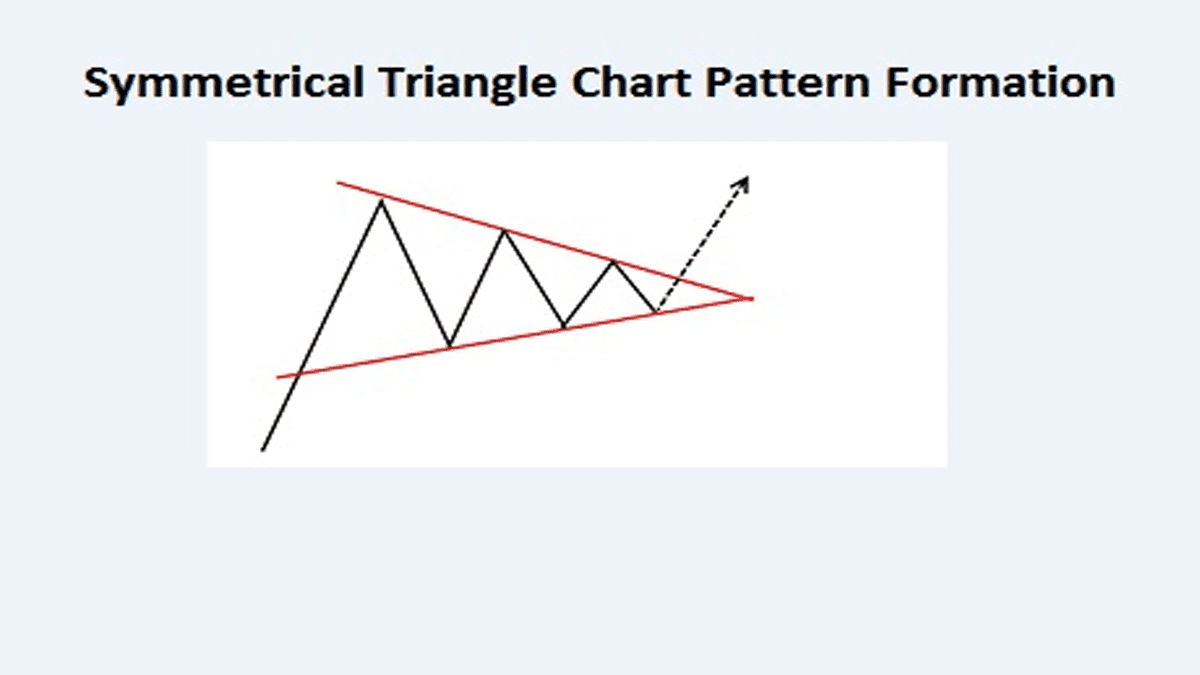
The symmetrical pattern basically forms in a period of prolonged consolidation. It is comprised of price fluctuation and the movement of price creates a pattern like a triangle. In the pattern, there must be two lower highs and one or two higher lows. When these points are connected by creating two converging trendlines, form this conical shape. The pattern forms during indecision in the market. Though it may be in both a reversal or continuation pattern, it more often marks a continuation pattern.
Graphical Representation of a Symmetrical Triangle Chart Pattern Formation
In order to clarify this in an easy way, a proper chart is necessary.


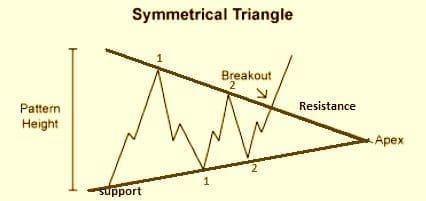
Every investor must remember a point that the future direction of the breakdown can be determined only after the breakdown has occurred. The above figure is an example of a symmetrical triangle bullish breakdown form. Every chart indicates the target of trade. Most of the time according to the size of the pattern, investors set the target. Now, come to the point of stop-loss, it is advisable to set your Stop loss limit below the breaking point or near the bottom line.
Real-Life Example of a Symmetrical Triangle Chart Pattern
I am coming up with another symmetrical chart pattern of United Spirits (Symbol code: MCDOWELL-N).
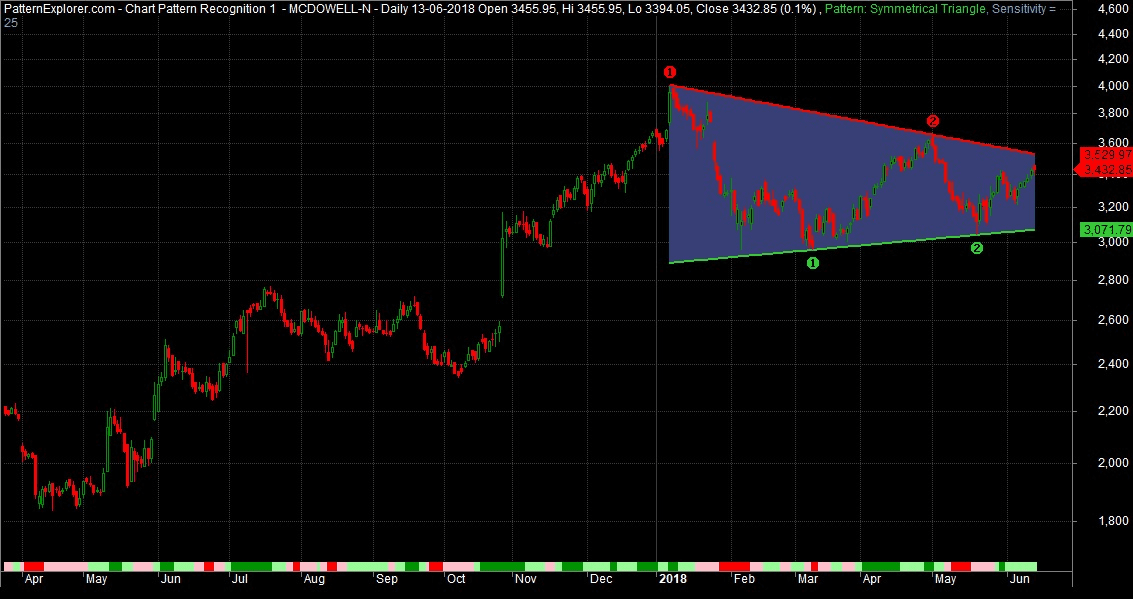
You can see that the triangular pattern did not break out yet. The last closing price was 3432.85 on 13th June 2018. and we expect the breakout will happen above 3529.97. The breakout price will be in dynamic form with time. As I have mentioned earlier that we can determine the future direction only after the breakout.
In this bullish continuation pattern, the 1st target will be near 3700 after a breakdown, and the second target may be near 3850. The stop loss is suggested to be set near the bottom line of the pattern. According to our research, the stock could be beneficial for investors if they are ready for mid to long-term investment.
FAQ
Yes, a symmetrical triangle pattern typically indicates that the stock is likely to move higher. The price movements gradually narrowing toward the apex of the triangle pattern further supports this bullish sentiment.
The direction associated with a triangle pattern depends on whether it’s a symmetrical or asymmetrical one. While a symmetrical triangle depicts generally bullish sentiment, an asymmetric one could point towards either bearish or bullish sentiments. This needs more investigation before jumping into trading decisions.
Traders usually look for revenue opportunities when prices break out from their consolidation phase near the apex area of the triangular formation. If prices break out decidedly above resistance levels then traders can take long positions in anticipation of increased volatility in future price movements and vice versa if prices break down distinctly below support levels indicating bearish reversal potentials.
Asymmetric triangles are more complex as compared to their symmetric counterparts since they depict both bull and bear indications within their formations which require closer observations using technical indicators like MACD and RSI etc, so as to conclude whether it’s probable that the market will trend up after forming this type of cases or not during the certain time frame.
Conclusion
Most investors widely use the symmetrical triangular pattern. You can trade effectively by applying the pattern at the right time. Also spotting this pattern is much easier and you can even spot it with a candle or bar graph. The accuracy of this pattern is quite high and you can easily fix a target and a stop loss. However, like every other pattern, you must confirm the pattern with other indicators before jumping into the trade.


