Aroon oscillator (ARO) was also developed by Tushar Chande. It actually an oscillator version of the same named Aroon indicator. The name is taken from Sanskrit. In Sanskrit, the Aroon means morning dawn. Like the indicator, the oscillator too identifies a trend and determines how strong the trend is. It also identifies a probable trend reversal.
More on Aroon Oscillator
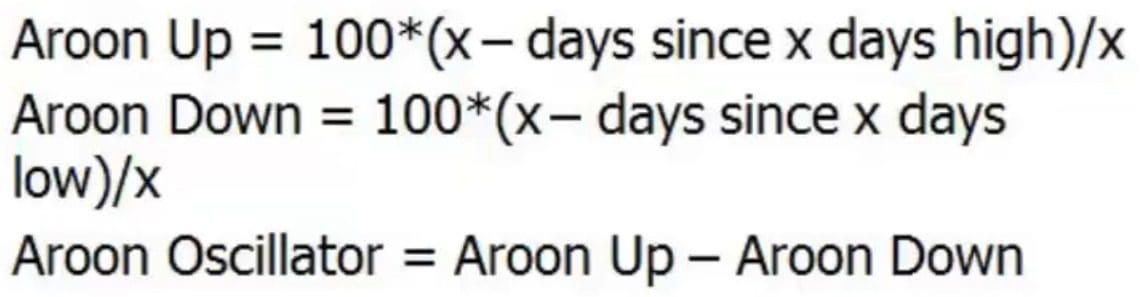
In this oscillator, Aroon Down is subtracted from Aroon Up to reach the oscillator value. The oscillator value ranges from +100 to -100. Usually, a trader creates a short position when the oscillator crosses the zero mark below and creates a long position when the oscillator goes above zero marks. Zerodha Kite and Upstox Pro charts plot this ARO indicator for traders.
Aroon Oscillator Formula and Calculation
How to set up Aroon Oscillator on Charts
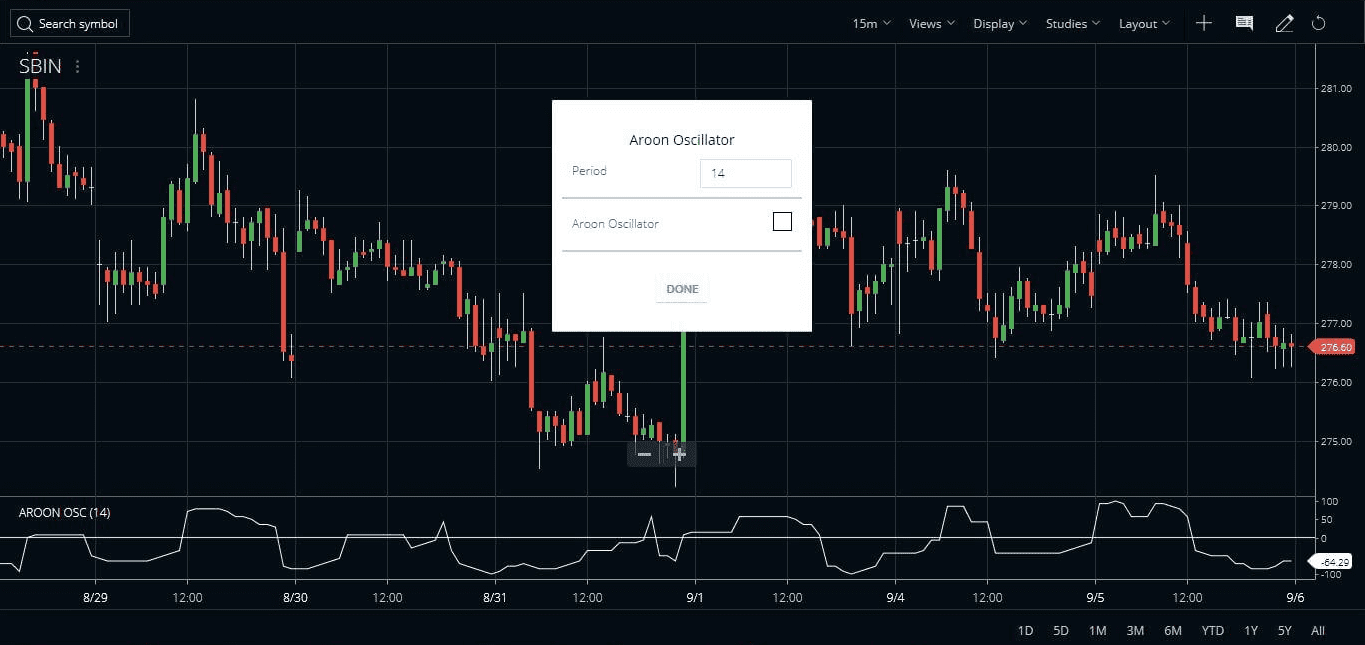
On Zerodha Kite
- ARO indicator is available in Zerodha Kite under the studies section.
- Go to Aroon Oscillator and click on it.
- A small window will open that contains the default parameters of the indicator.
- Once we select or change the parameters and click the Done command, the parameter window fades off the screen, and the indicator is plotted on the stock price.
- The default values can be changed as per your own requirements. The oscillator has a 14-period as default for plotting the chart.
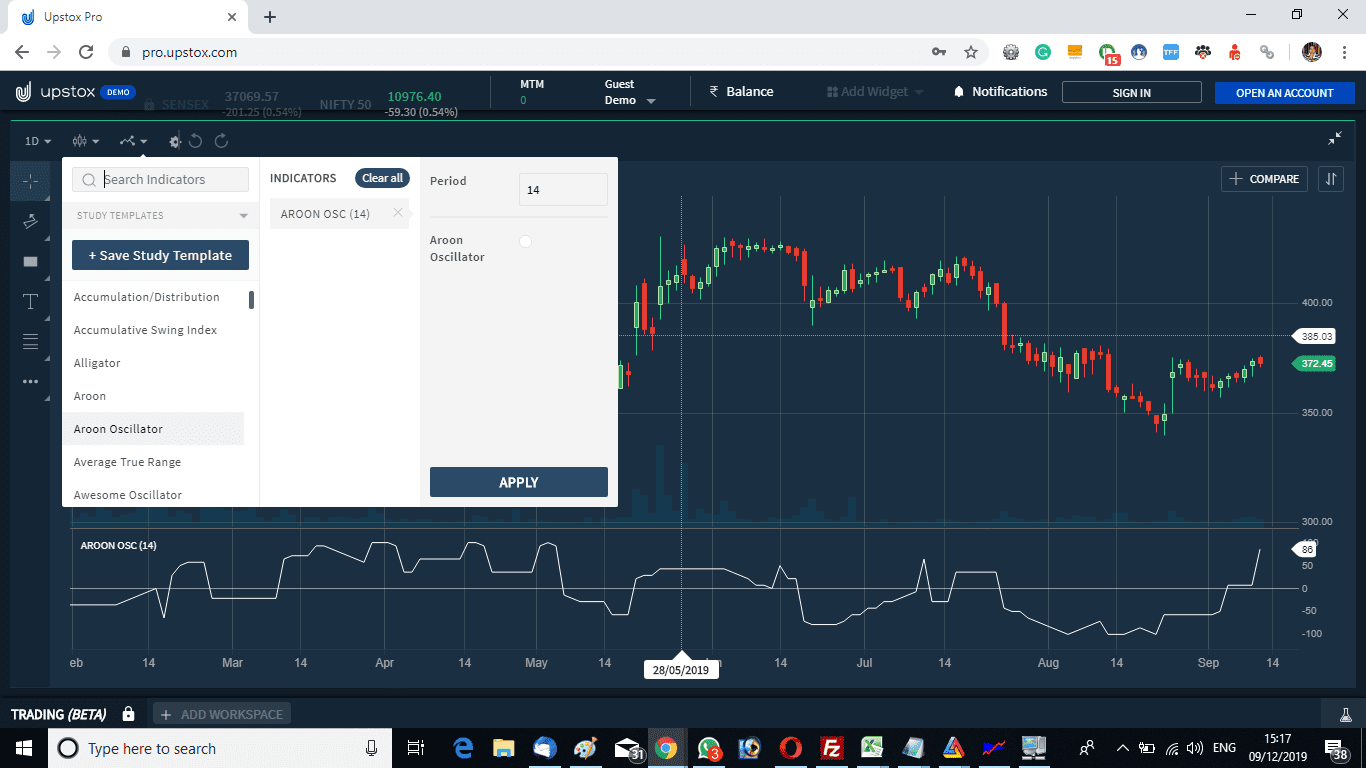
On Upstox Pro
This indicator is also available on the Upstox Pro charts. The setup instruction is the same as Zerodha Kite.
How to Trade the Aroon Oscillator?
In general, the oscillator value above 40 means an uptrend and the value above 70 means a strong uptrend. Similarly, a value below -40 means a downtrend and a value below -70 means a strong downtrend. Any value above or below the 90 or -90 value means a highly strong trend.
The oscillator crossing the zero line marks a trend change. When it crosses above zero it is an indication that the trend can change to up. On the other hand, when it crosses below the zero line it indicates the trend can change to the downside.


When the oscillator reaches the +100 mark bulls can book their long positions or trail with a stop loss. Similarly, when the oscillator reaches the -100 mark, bears can book their short positions or trail using a stop loss.
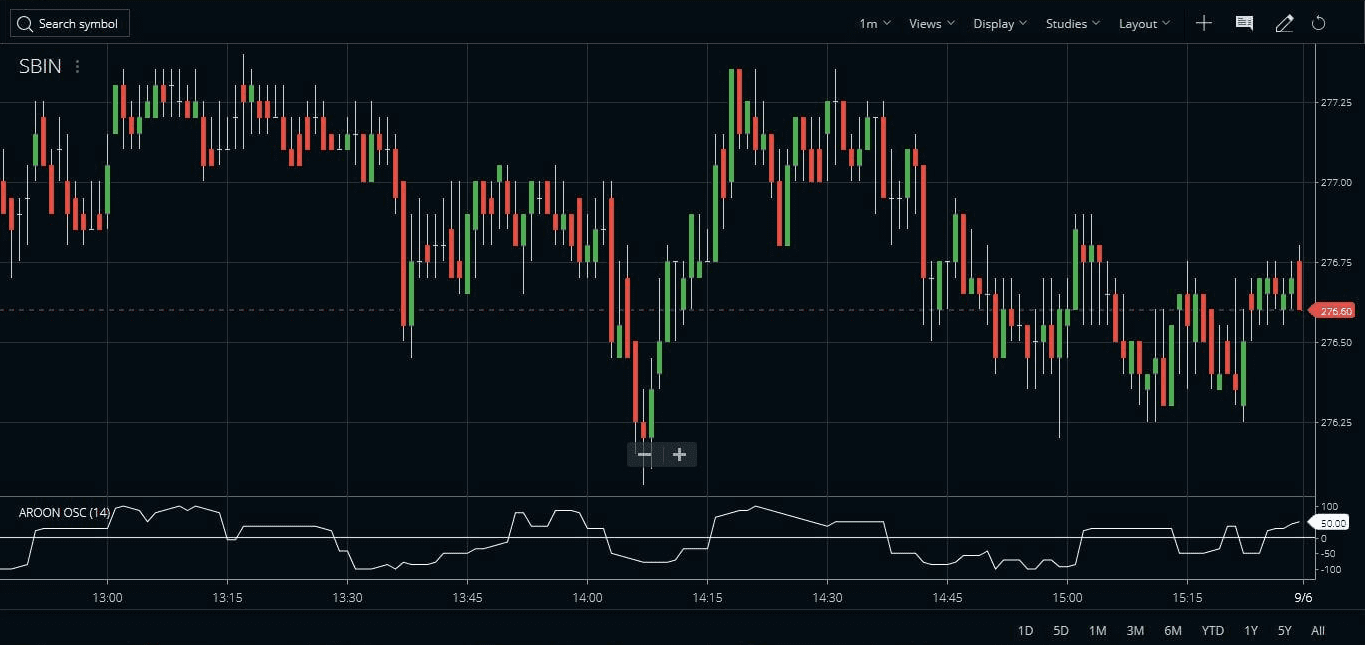
- The ARO indicator works well in all time frames.
- You can see the image above shows the State Bank of India (SBIN) stock price movement with respect to the indicator.
- The image above is of a 1-minute timeframe.
Changing the default parameters
I have also tested changing the default parameters. It has been found that changing the period to 25 instead of the default 14 gives much more stable signals. I have also used the Aroon Oscillator along with the Aroon Indicator. This can create a much more stable trading system. Check the image below to understand how it works.
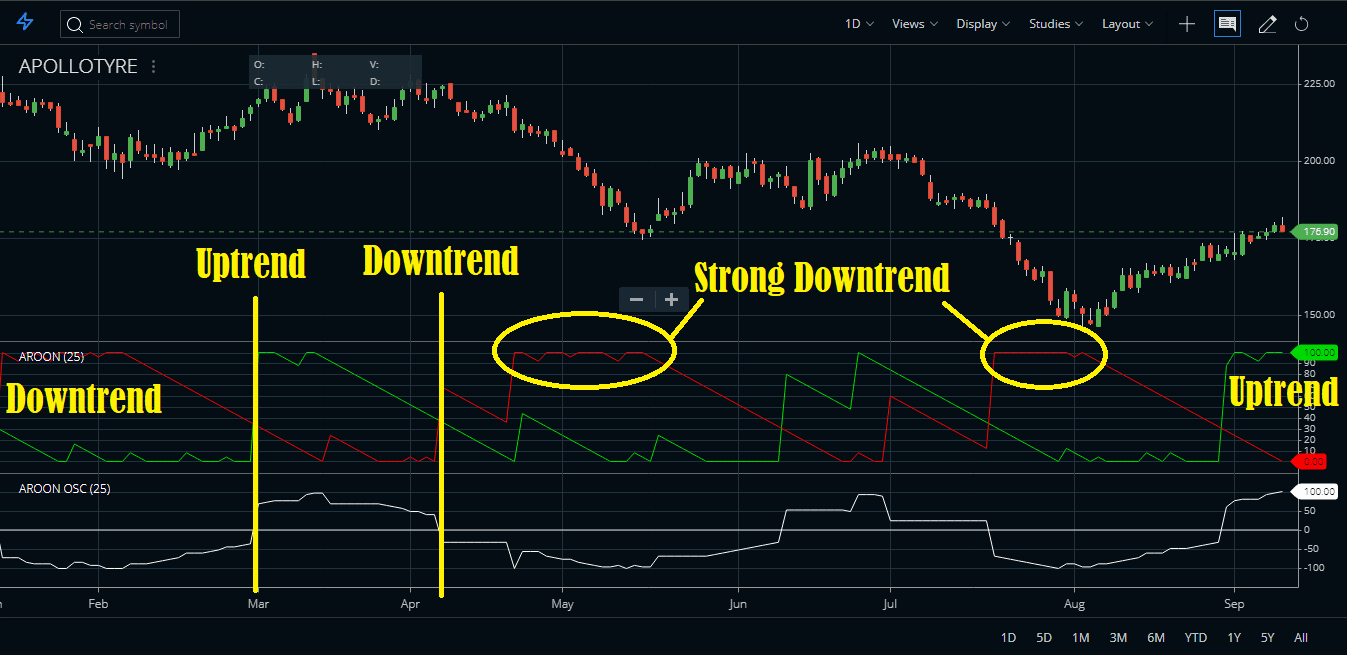
We have seen that when the Aroon Up crosses the Aroon Down, the oscillator also crosses the zero line. This denotes the start of a new trend. The oscillator crossing certain thresholds denotes the strength of the trend on either side.
Example of Aroon Oscillator in Zerodha Pi
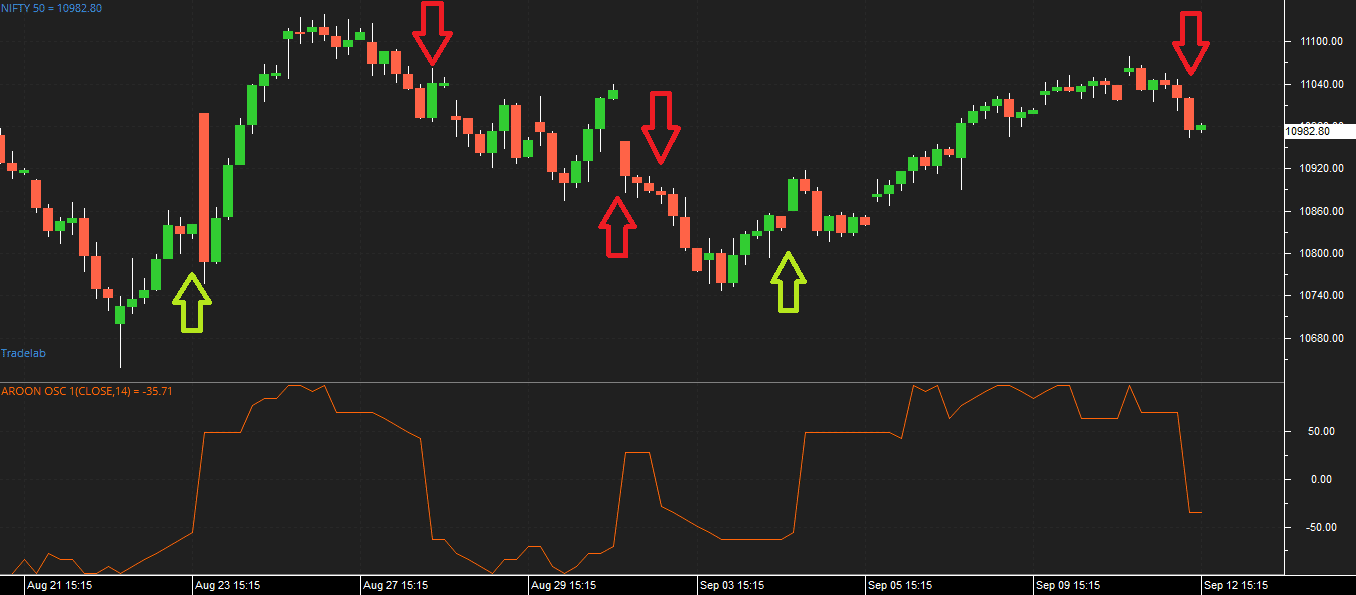
The ARO can be used in the Zerodha Pi platform as well. Check the image below to understand how to trade simply using the zero line crossover in the ARO indicator. We will simply create a buy position when the ARO crosses the zero line from upwards. And we will short-sell when the ARO indicator crosses the zero line downwards.
Creating a Scanner
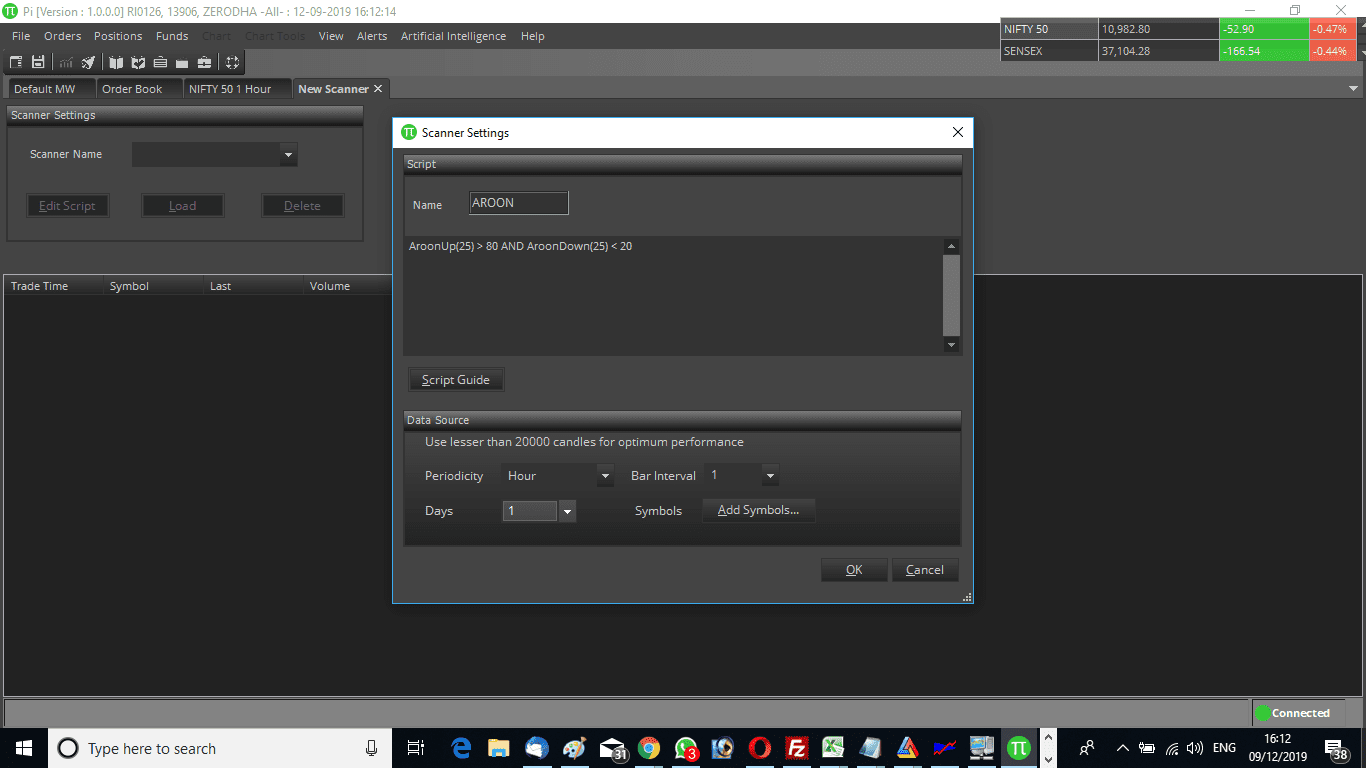
Zerodha traders can create a scanner on the Pi platform using the Aroon. Suppose you want to scan for a strong uptrend. Your logic is 25-Period AroonUp is greater than 80 and the 25-period AroonDown is less than 20. So you can write the following code in the Pi platform to create the scanner.
AroonUp(25) > 80 AND AroonDown(25) < 20
You can create the scanner, save it by a name and scan your stocks that pass the criteria. You can create scanners on other strategies as well. We can create a scanner for the ARO crossing the zero line. These scanner outputs can also be fired in automated trading. You can create scanners on other platforms as well.
Suggested Reading
I suggested reading the following book by Tushar Chande the inventor of this indicator. The name of the book is Beyond Technical Analysis: How to Develop and Implement a Winning Trading System (Wiley Finance).
FAQ
The Aroon indicator is a technical analysis tool that illustrates the strength of a trend, direction, and duration of price movement. It measures two trends; the Aroon Up line represents growth while the Aroon Down line shows any negative movements in prices. The values are plotted on a graph which makes it easy to identify bullish or bearish signals.
The accuracy of the Aroon indicator depends largely on how well traders interpret its signals and how they incorporate them into their trading strategy. As with any other technical indicators, combining them with other analysis tools increases its accuracy rate significantly.
Generally speaking, when both lines cross above 50 (the overbought region), it indicates an uptrend or strong buying pressure for a stock that can be bought by traders looking for profits from rising prices. Conversely, if both lines dip below 50 (in oversold regions,) this suggests a sell signal and suggests that the current trend may soon reverse downwards as selling pressures increase and investors sell out from long positions leading to a drop in prices.
One key advantage of using the Aroon Indicator compared to many others is it has a relatively low level of lag associated with it. This makes it user-friendly at providing quick signals potentially helping to capitalize on certain market moves early before bigger players get involved in pushing prices even higher/lower than expected prevailing entrant ones’ expectations & plans.
Conclusion
The Aroon Oscillator is an extended oscillating version of the Aroon Indicator. is a quite reliable indicator of trading the trend. Using the two indicators side by side can create a robust trading system. However, I shall advise traders to confirm the trend with a few more trend-following indicators.


