Introduction
If you have been trading stocks, indices like Nifty or Bank Nifty, or even commodities, you will often notice that sometimes the market moves very slowly and sometimes it becomes extremely volatile. Understanding this volatility is extremely important for traders because volatility determines how far the price can move within a certain period. One of the most useful indicators for measuring market volatility is the Average True Range, commonly known as the ATR indicator. The ATR indicator helps traders understand how much a stock or index typically moves during a specific period.
Many traders focus only on entry signals and ignore volatility. However, volatility often determines whether a trade survives or fails. A stop loss that works perfectly in a low-volatility stock may get hit repeatedly in a highly volatile stock.
The Average True Range indicator was introduced by J. Welles Wilder. In simple terms, the ATR indicator measures volatility.
A rising ATR denotes that volatility is increasing, and a falling ATR denotes that volatility is dying down.
Generally, ATR is calculated on a 14-period or a 21-period basis.
What Is Average True Range (ATR)?
Average True Range (ATR) is a volatility indicator developed by J. Welles Wilder that measures how much a market typically moves over a chosen period.
Range means today’s high minus today’s low.
True Range is the highest of:
- Today’s range
- Absolute value of today’s high minus yesterday’s close
- Absolute value of today’s low minus yesterday’s close
The Average True Range is the moving average of the True Range.
Average True Range Meaning
ATR shows the average range of price movement of a stock over a specific period of time.
Though it is similar to historical volatility, ATR shows the average range of price movement of a stock over a specific period of time, whereas the historical volatility of a stock is always calculated annually.
With the ATR known for a particular period of time, we can presume whether the stock is topping or bottoming out.
The ATR line slope also indicates whether the stock is more volatile or not.
A low ATR indicator value indicates very low volatility and a sideways trend.
On the other hand, a high ATR value indicates the price is volatile and is definitely trending.
When the indicator bottoms out and starts going up sharply, it shows price is going to break out from the existing range with a definite trend. Watch the video below to know how to use the indicator properly on TradingView.
Trader Tip (Compare ATR to price using ATR%)
Raw ATR values can’t be compared across instruments with different price levels. TradingView explains why absolute ATR values differ naturally with price and offers ATR% for screening.
Average True Range Formula
The ATR formula is based on True Range (TR).
True Range = Maximum of:

Current High − Current Low
Absolute value of Current High − Previous Close
Absolute value of Current Low − Previous Close

ATR = Moving average of True Range
Most traders use ATR(14).
This means the ATR indicator calculates the average volatility of the last 14 periods.
How Does the Average True Range Work?
A low ATR indicator value indicates very low volatility and a sideways trend.


On the other hand, a high Average True Range value indicates the price is volatile and trending.
When the indicator bottoms out and starts going up sharply, it shows price is going to break out from the existing range with a definite trend.
ATR works well when combined with other indicators.
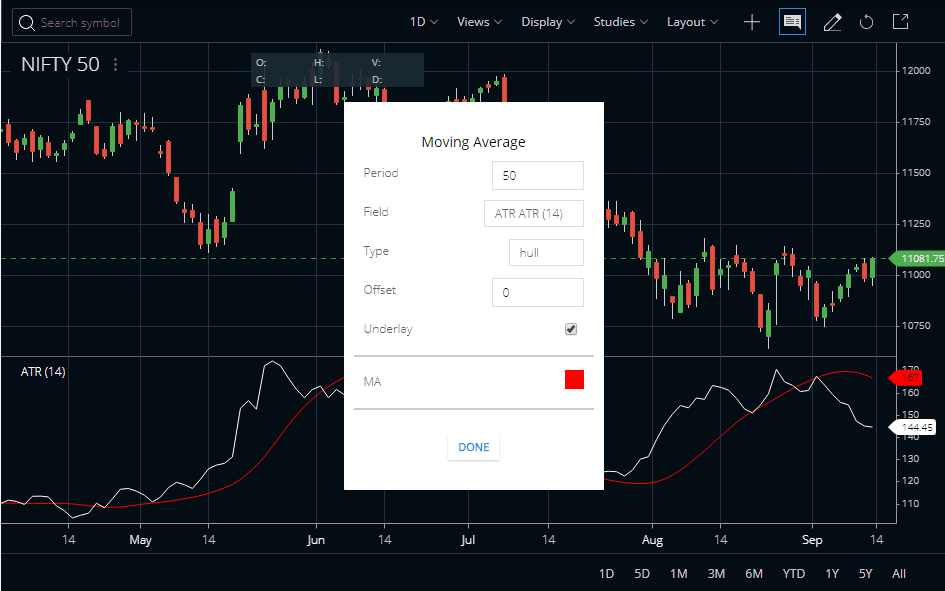
Using a Moving Average of the ATR Indicator
To judge whether the volatility will fall or rise we can use a moving average of the ATR indicator.
When the Average True Range crosses the moving average from below, it is a signal that volatility will start to rise.
Watch the image below where we have used a Hull version of the Moving Average of the ATR.
How to Set Up the Average True Range Indicator
ATR Indicator on Zerodha Kite
- Open your MarketWatch on Zerodha Kite
- Choose your stock or commodity.
- Right-click on it and open its chart.
- Go to Average True Range in the Studies section and click on it.
- The parameter window opens with the default parameters of the ATR indicator.
- Once we choose the default parameter or change it as per our need, the Average True Range is plotted on the screen.
- By default, the indicator parameter is 14 periods, but we can always change it.
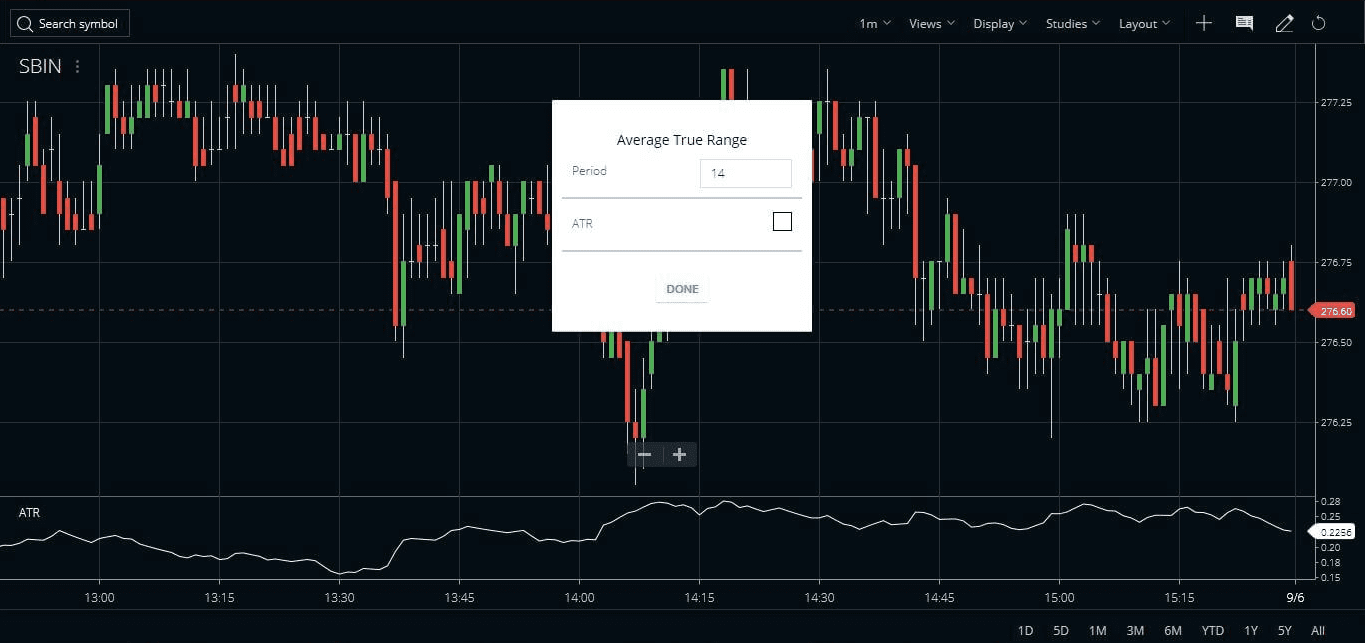
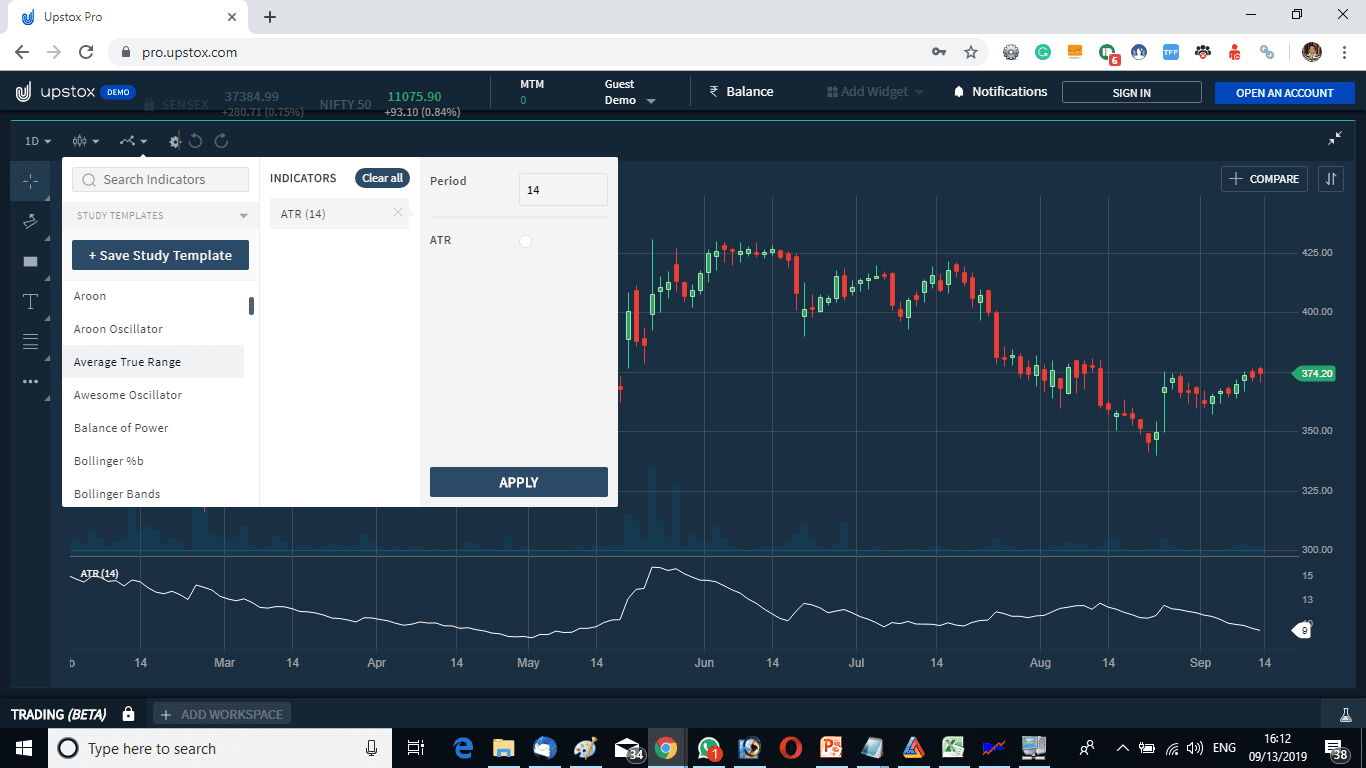
ATR Indicator on Upstox Pro
- Similarly, you can plot the Average True Range on the Upstox Pro platform.
- Here, too, you can change the default parameter as per your needs.
Best ATR Indicator Settings for Intraday Trading (Nifty & Bank Nifty)
For intraday traders in Nifty and Bank Nifty, ATR can help estimate how much the index may move during the day.
Common ATR settings used by traders:
| Trading Style | ATR Period |
|---|---|
| Scalping | ATR(7) |
| Intraday Trading | ATR(14) |
| Swing Trading | ATR(21) |
Example:
If Bank Nifty ATR = 350 points, the index may move roughly 300-350 points during the session.
This helps traders:
- Avoid chasing extended moves
- Set realistic targets
- Plan volatility-based stop losses
Using ATR to Identify Stop Loss
The Average True Range is also used to predict correct stop loss.
Many traders keep the stop loss at certain multiples of the ATR.
A common usage is:
- Stop Loss = 1 × ATR
- Stop Loss = 1.5 × ATR
Example:
If a stock price is ₹1000 and ATR is ₹20
Stop Loss = ₹1000 − ₹30
This allows the trade to survive normal volatility.
Trader Tip (Stop placement reality check)
If your stop is less than ~1× ATR away (on the timeframe you trade), you’re often not “tight”—you’re just placing it inside normal noise.
How to Catch the Exact Top and Bottom of the Market with the ATR Indicator
Can you catch the exact top or bottom of the market? Do you know there can be a strategy that can tell you on an intraday basis that the market has reached an extreme?
Suppose you are seeing that Nifty has suddenly fallen by 60 points OR Crude Oil has risen by 40 points. Do you think that the assets will go more extreme? If your answer is YES, then you are wrong.
At maximum times, the market will reverse back from an extreme instead of moving further into the extreme. But how to identify that the market has reached an extreme? There comes the use of a technical indicator called the ATR indicator.
Using the Daily Volatility to Predict the Probable Range
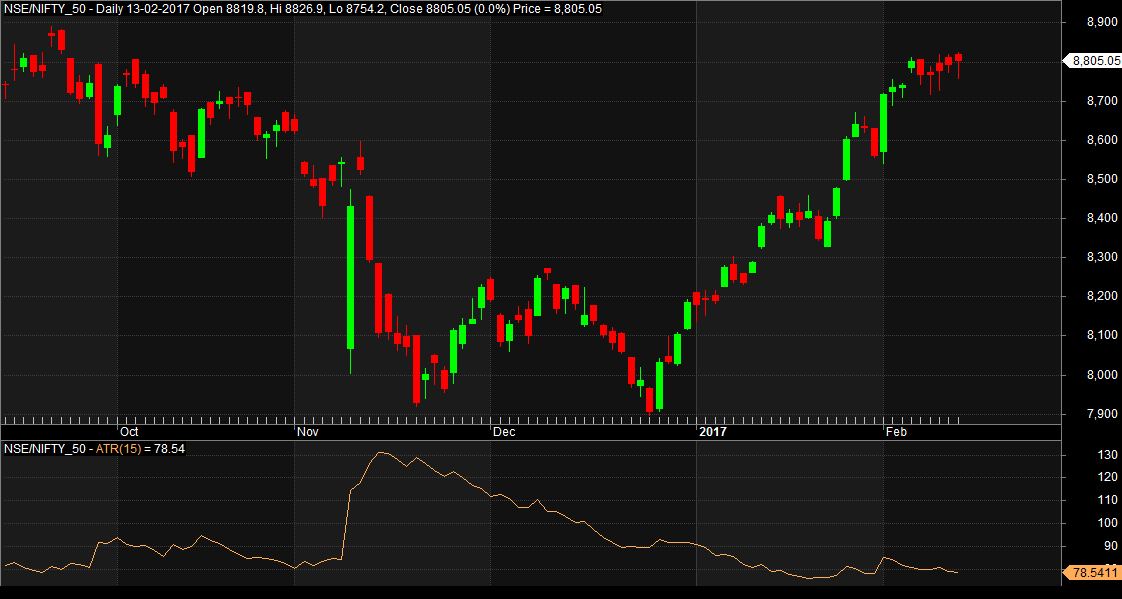
Watch the image below. There, I have shown the Nifty index chart with a 14-day ATR indicator.
- Check the 14-day ATR of the Nifty index is 78.541.
- This means that the average true range of the Nifty index is 78.541.
- Now say the next day Nifty starts falling since the open and is almost 70-80 points down.
- Shall you open a new short or hold any existing shorts in Nifty?
No.
- As Nifty has almost fallen the total length of its average true range, there is a high chance that Nifty will bounce back.
- So we will open up a BUY order with a suitable stop value.
The ATR Bounce Trading System
I named this trading strategy the ATR Bounce Trading System.
The idea of the ATR Bounce Trading System is very simple.
- Just watch the daily reading of the 14-day ATR indicator of a particular stock or index or commodity.
- Suppose the last traded price today is X and suppose today’s ATR reading is Y.
- Then tomorrow’s range can be calculated as:
- Maximum high next day = X + Y
- Maximum low next day = X − Y
This helps traders find probable reversal zones.
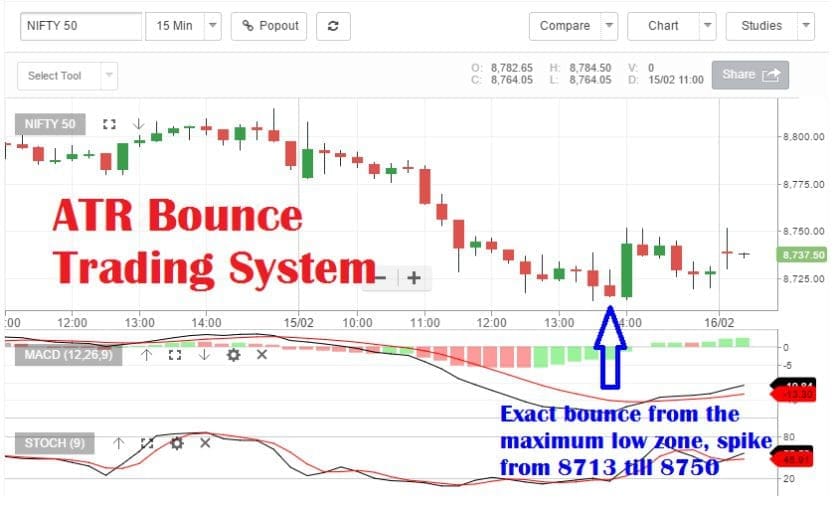
Practical Example of the ATR Bounce Trading System
A classic example of the ATR Bounce Trading System was seen in the Nifty index on 15th February 2017.
On 14th February, Nifty closed at 8792.30 and the 14-day ATR value was 76.
So the next day’s levels were:
- Long level = 8792 − 76 = 8716
- Short level = 8792 + 76 = 8868
The market opened and moved toward the 8716 zone.
Nifty bounced near 8713 and moved sharply to 8750, giving a very profitable intraday trade.
Trader Tip (Targets must respect ATR)
If today’s move already covers most of the ATR, reduce expectations. Chasing late often means buying the end of the day’s fuel. StockManiacs shows this logic using Nifty’s ATR to avoid chasing after a big part of range is done.
ATR Calculator (Interactive Tool)
Enter the High, Low, and Previous Close to calculate the True Range and an ATR estimate.
ATR Formula
- R1 = High − Low
- R2 = |High − Previous Close|
- R3 = |Low − Previous Close|
- True Range = max(R1, R2, R3)
- ATR ≈ True Range (single candle estimate)
Conclusion
The Average True Range indicator works well in judging the volatility of the markets.
Traders can use this technical indicator to understand market trend strength and volatility.
The common way of understanding whether the volatility is rising or dying down is to use ATR with one of its moving averages.
Another common usage of ATR can be in predicting the exact top or bottom in intraday trading.
It can also help predict the oscillation range of the market beforehand.
Used properly, ATR becomes a powerful tool for volatility analysis, stop loss planning, and risk management.
Average True Range FAQ
ATR in the stock market means Average True Range. Range means today’s high minus today’s low. True Range is the highest of today’s range, today’s high minus yesterday’s close, or today’s low minus yesterday’s close.
The ATR indicator measures volatility. If ATR moves up, volatility increases. If ATR moves down, volatility decreases.
ATR is calculated by taking the moving average of True Range values. True Range considers high-low movement and price gaps.
ADR measures only daily high-low movement. ATR considers price gaps and true volatility, making it more accurate.
Because range-bound markets trigger frequent stop-and-reverse signals. StockManiacs warns about this and suggests trend filters like ADX/Aroon.
Suggested Reading on ATR Indicator
I will suggest you read this book: Average True Range: Your Step-by-Step Guide to Profitable Forex Trading with Average True Range. To read this book, CLICK HERE.


Read this ATR indicator blog and I have a query. For intraday trades of Crude the ATR values observed are: 3.95 on 5 minutes, 7.45 on 15 minutes, 18.69 on 1 hour & 101.81 on Daily time frames. If I normally trade using 5 minutes candles then which values are to be used and how to apply them to find tops & bottoms in this time frame? Shall be obliged to receive your valuable feedback. Thanks. – Vivek Nirody ([email protected]).
Vivek, when you try to find the day’s high or low you need to consider only the daily ATR value.