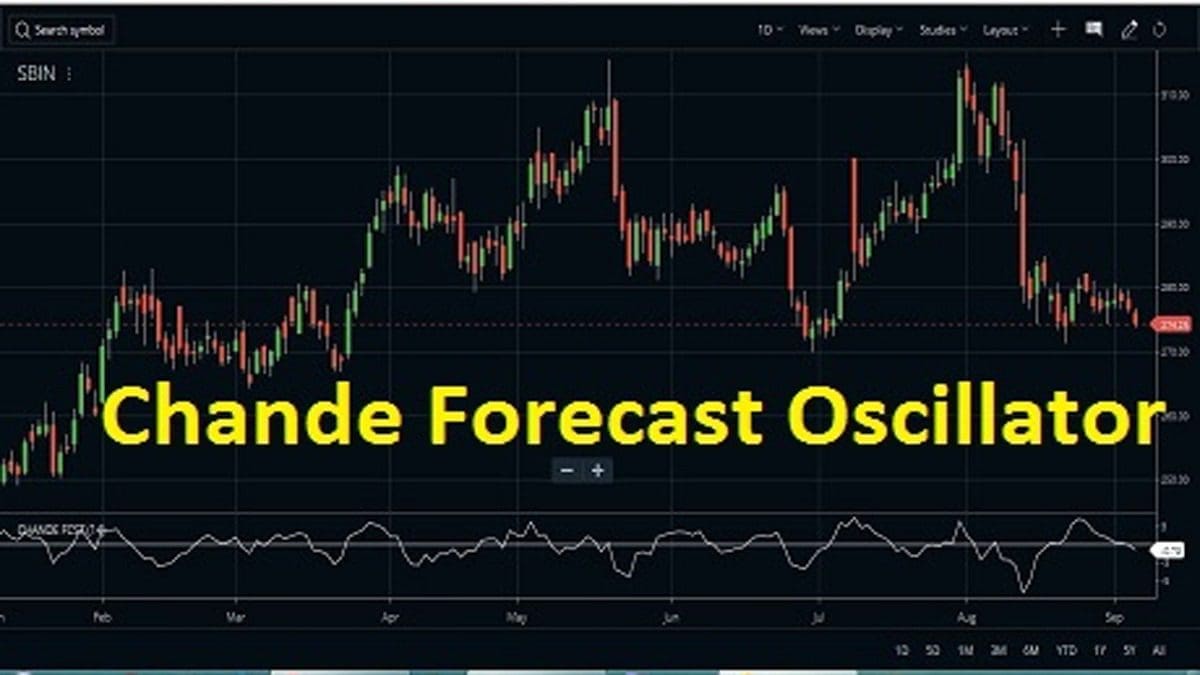
Chande Forecast Oscillator (CFO) was developed by Tushar Chande. This oscillator can be said to be an extension of linear regression-based indicators. This oscillator plots the difference between the closing price of the stock and the linear regression-based price forecast over a specific period of time.
We can attach this indicator very easily to the Zerodha Kite charts.
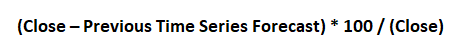
The Chande Forecast Oscillator Formula
How to set up Chande Forecast Oscillator in Zerodha Kite?
- First, you need to open your MarketWatch and select the stock that you want to analyze.
- Open its chart by right-clicking on the stock and selecting the chart menu.
- The chart window of the stock will open.
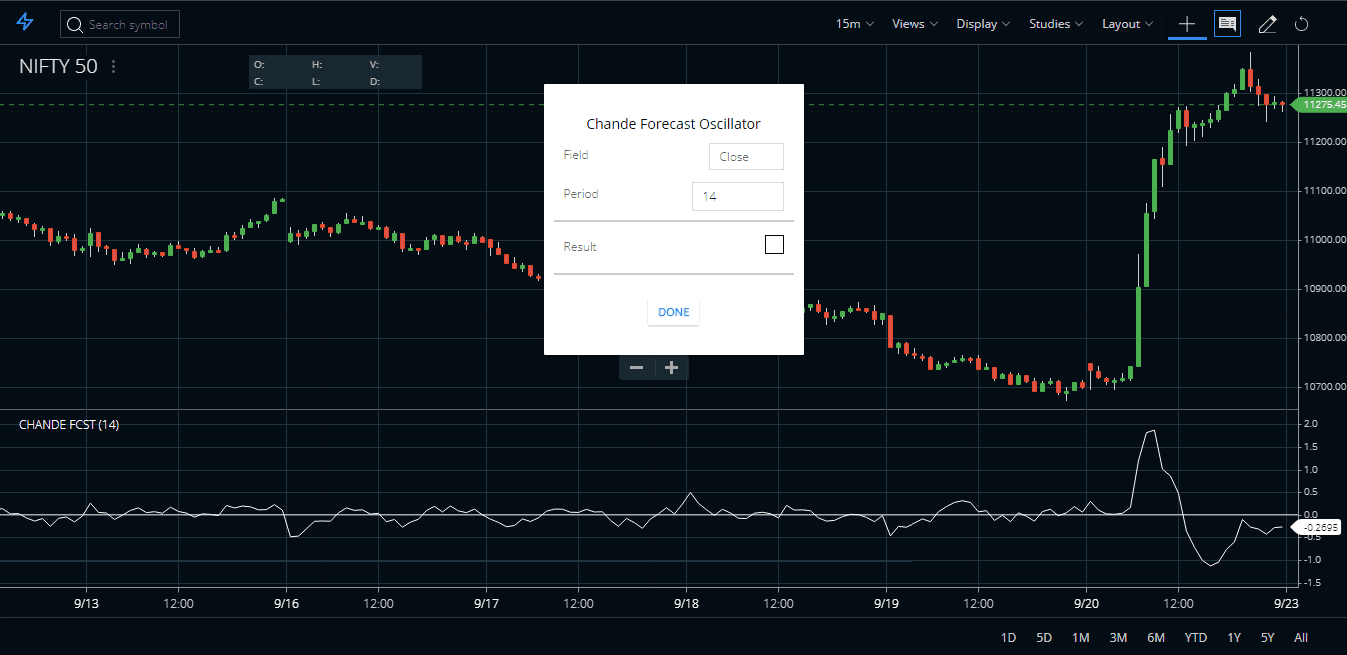
- From the Studies select Chande Forecast Oscillator and click on it.
- A small window opens with the default period of 14-period.
- You can change the default parameter or keep it as it is and click on Done. The parameters window vanishes and the CFO indicator is plotted on the stock price.
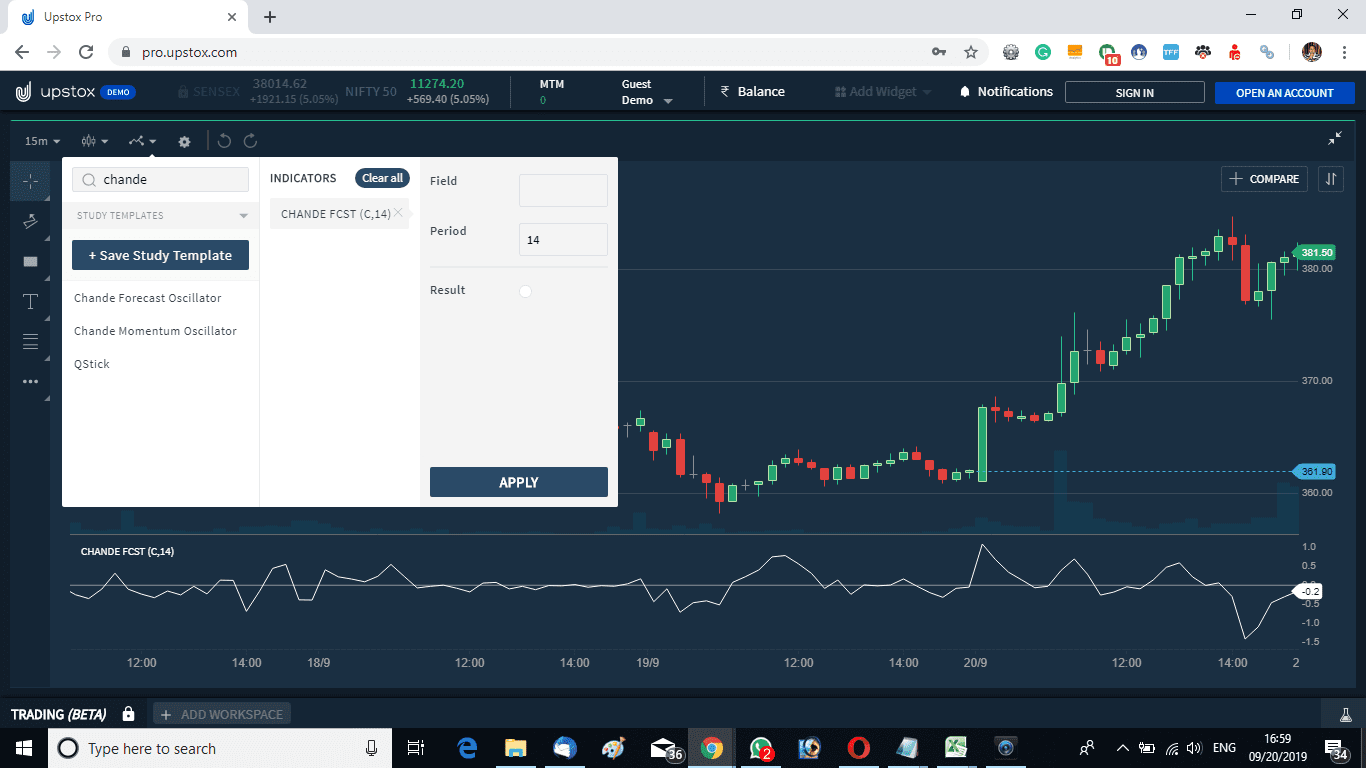
Attaching CFO in other trading terminals
In the same way, Upstox clients can attach the Chande Forecast Oscillator to their Upstox Pro terminal. 14 is also the default period here.
How to trade with Chande Forecast Oscillator?
For a simple explanation, when the forecast price is greater than the closing price of the stock. the oscillator goes above the zero line. On the other hand, if the linear regression forecast is below the closing price, the oscillator goes below the zero line.


#1 Simple trading strategy: Zero Line Cross
As the name suggests this is an oscillator, so it oscillates around some point. In the CFO indicator, the zero line is of utmost importance. When the indicator goes above the zero line, it suggests that the forecasted price is above the current price. So this is a bullish situation On the other hand when the indicator goes below the zero line, it means the forecasted price is below the current price.
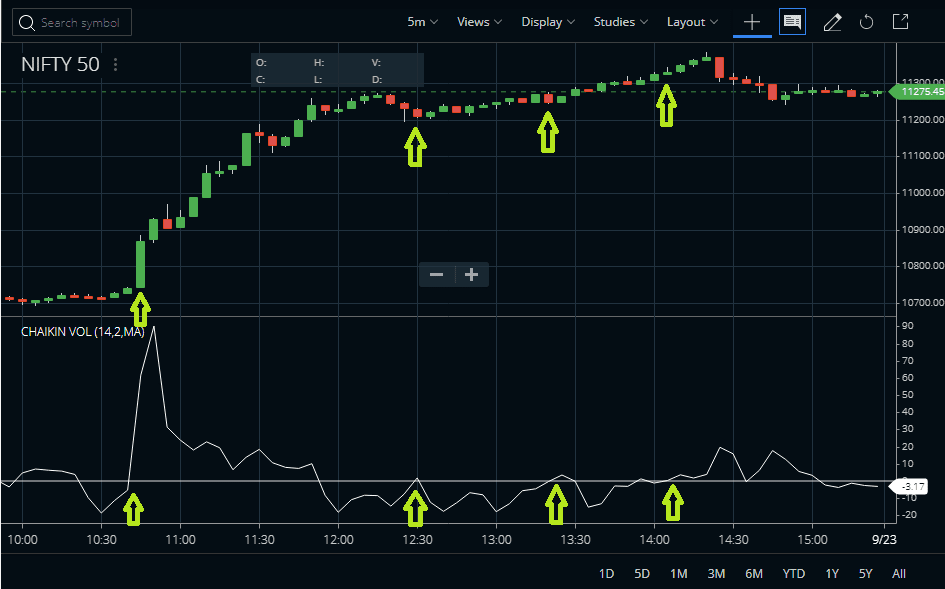
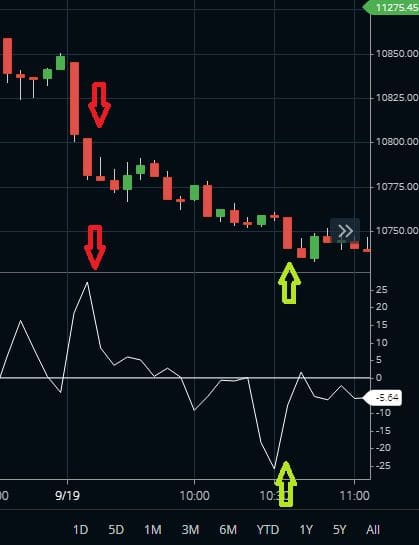
#2 Simple trading strategy: Reversal from extreme
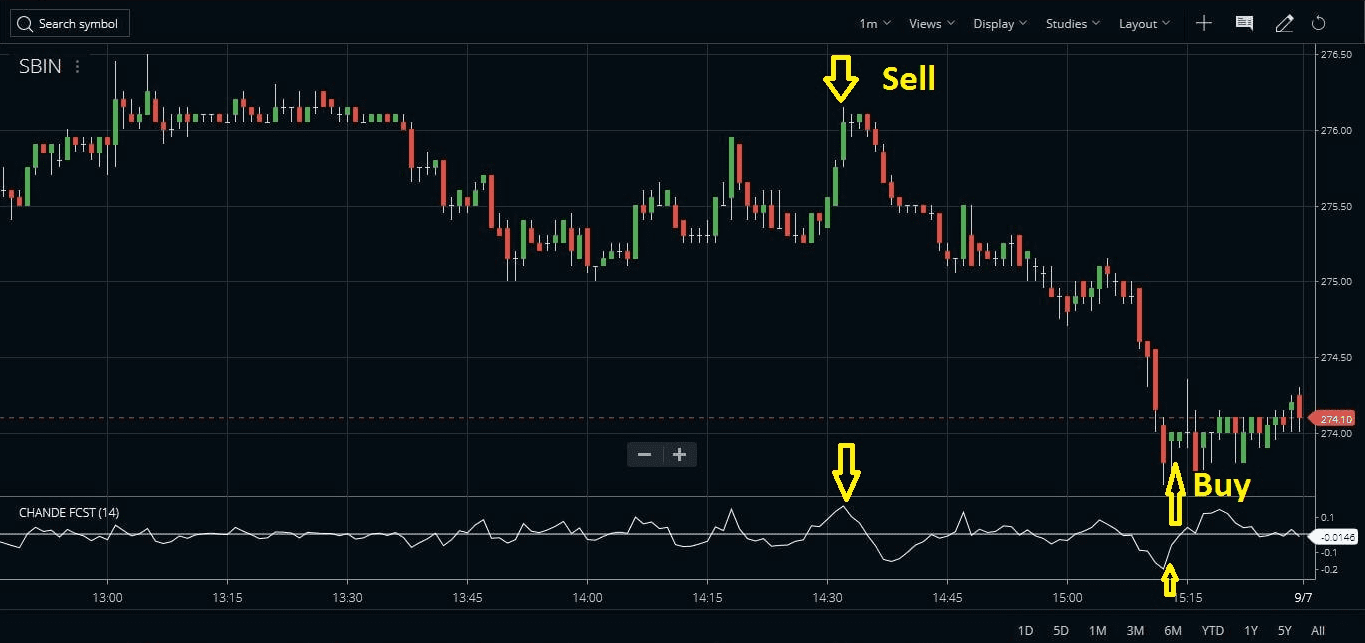
- Exit long positions and create short positions when the oscillator starts coming down after reaching the top.
- Exit from the shorts or create a fresh buy once the oscillator goes up after bottoming out.
#3 Advanced trading strategy: Using support and resistance
Watch for visible support or resistance line on the indicator. If that breaks we may see a single-sided move in the market. Here in this example, this is the Nifty index 5 minutes chart. Check the CFP could never cross the +30 mark. So when it spiked way above the 30 mark it triggered a one-sided buying.
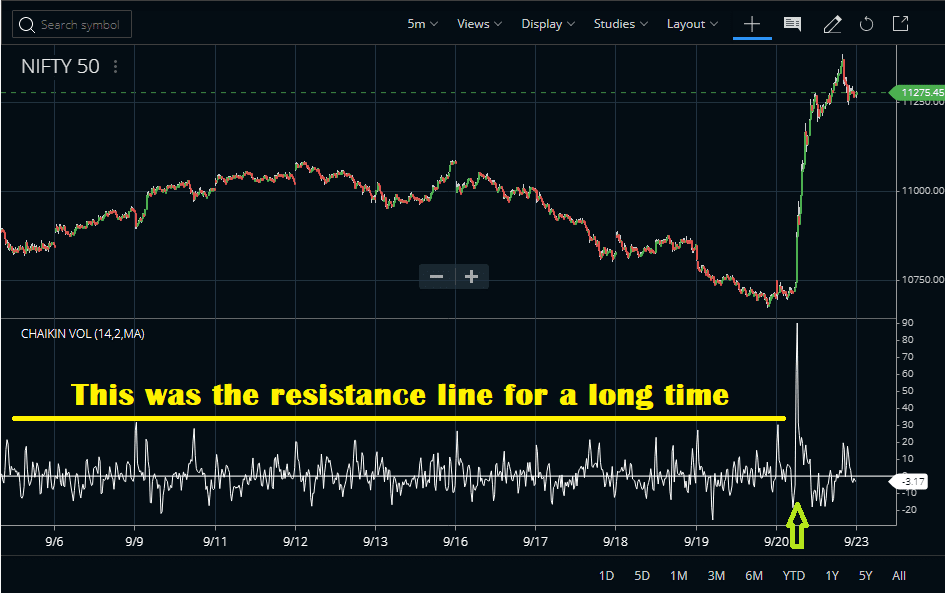
If you are following this advanced strategy remember sometimes this can be a trap too. You can be caught in a single bar movement. Hence in the case of taking a buy position buy only if the price crosses the trigger candle high. Similarly, in case of taking a sell make sure that the price breaks below the low of the trigger candle.
Suggested Reading
I will suggest the following book. The New Technical Trader: Boost Your Profit by Plugging into the Latest Indicators (Wiley Finance). This book is also being written by Tushar S. Chande.

FAQ
The Chande Forecast Oscillator strategy is a technical analysis technique that attempts to identify the direction of long-term price movements in order to generate trading signals. It works by plotting both a single line and two red/blue parabolic lines based on momentum data. When the lines are moving up, it indicates bullish trends and vice versa for bearish trends.
The Chande Forecast Indicator (CFI) is an oscillator that can measure strength or weakness in a particular market trend over time. This indicator was developed by Tushar S. Chade as part of his Total Momentum Trading System (TMTS). The CFI will move in tandem with price fluctuations over specific ranges, indicating too low or high levels of momentum commonly used for detecting swing points and providing buy/sell signals at optimal times.
Chande Momentum Oscillators display bull/bear indications along with upper leveling regions between 0 and 1 values when plotted against pricing data, allowing one to easily identify possible reversals shortly before they take place. Users look at these readings alongside various chart patterns such as double elusive reversal charts which could result in higher accuracy forecasting along with adjusting their strategies accordingly depending on current market trends at play.
The actual value represented by this indicator varies greatly depending on what type of analysis one applies; however, typically values below 0 indicate bearish while numbers above 0 signify bullish markets making it an extremely useful tool accessible even for novice traders interested in better understanding future movement within respective markets.
Conclusion
The Chande Forecast Oscillator is mainly built on the theory of linear regression. It is an extension of the time series forecast and measures the difference between the actual price and the time series forecast. It is available on major trading terminals in India. We can trade this indicator in various ways. Among these, the zero line crossover and the reversal from extreme are two popular strategies. However, the support and resistance break on the indicator can really trigger a single-sided move.


