The idea of volume spread analysis was originated by Richard Wyckoff, a famous personality on wall street. Though he is not the only developer of VSA, there are others two, Jesse Livermore and Tom Williams. The core point of the analysis is the relationship between volume and price. The main idea of the analysis is to follow the demand and supply of trading. Here, you will have a basic guide on the topic Volume Spread Analysis Indicator for Amibroker, India’s one of best charting tools.
Volume Spread Analysis
The first and foremost topic you need to understand is what do we mean by the term “spread”. Spread is nothing but the difference between high and low. Broadly, there are three types of spread we can observe in the stock market, Widespread, Narrow Spread, and Average Spread. When the spread is high, consider it widespread and low as the narrow spread. In VSA analysis there are three main points to which you have to pay attention:
- Volume
- Closing Price
- Spread/Range
The VSA fits in almost all the financial market segments like stocks, futures trading, forex, etc. Here is the list of basic data regarding VSA, taken from Tom William’s book Master the Markets.
Volume Spread Analysis Basic Concept
First, the demonstration is given, after that, we will move on to the examples.






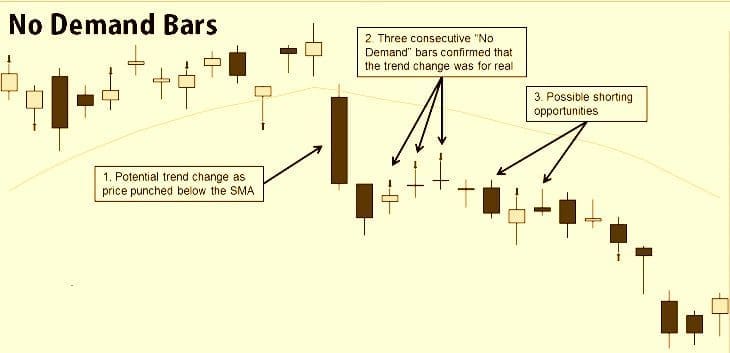
No Demand Bar
When the market shows a contracting relationship between spread and volume, it suggests the demand is low. This means it is not likely to rise. To find the demand bar, we need to confirm some points such as,
- The Price close higher than the previous candle bar.
- Volume is lower in comparison to the previous two bars.
- Narrow Range
No Selling Pressure
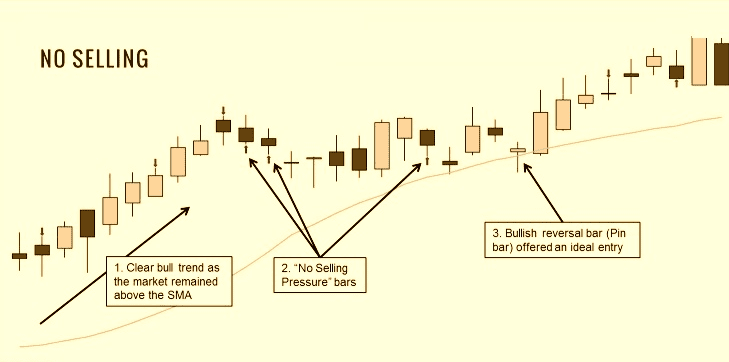
When the market falls with decreasing volume and spread range, the market is less interested in selling activity. The selling pressure is low here. Thus, it is not likely to continue falling. Like no demand, no selling also certain points:
- Price close lower than the previous bars.
- Volume is lower in comparison to the previous two bars.
- Narrow Spread range.
VSA Indicator for AmiBroker
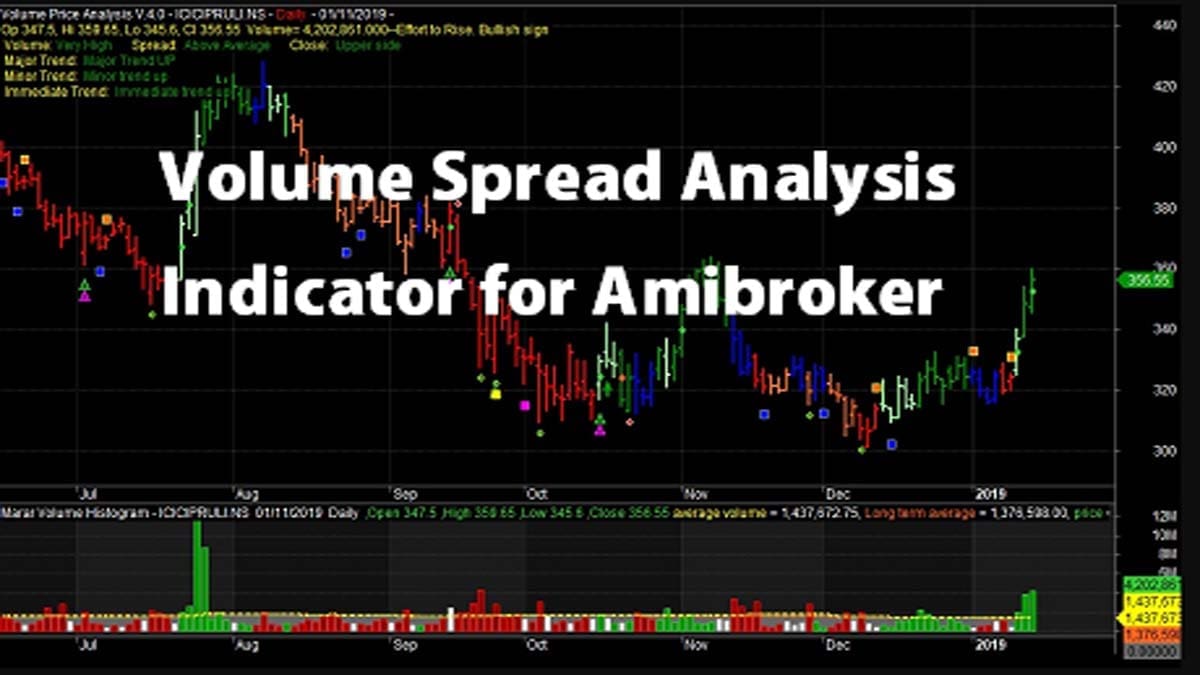
So this was the basis of VSA. Karthik Marar has done a lot of experiments on VSA and has published the Volume Spread Analysis indicator for AmiBroker. Marar has created quite a few versions of his indicators and the current version is version 4. Check the image below to understand how the indicator works.
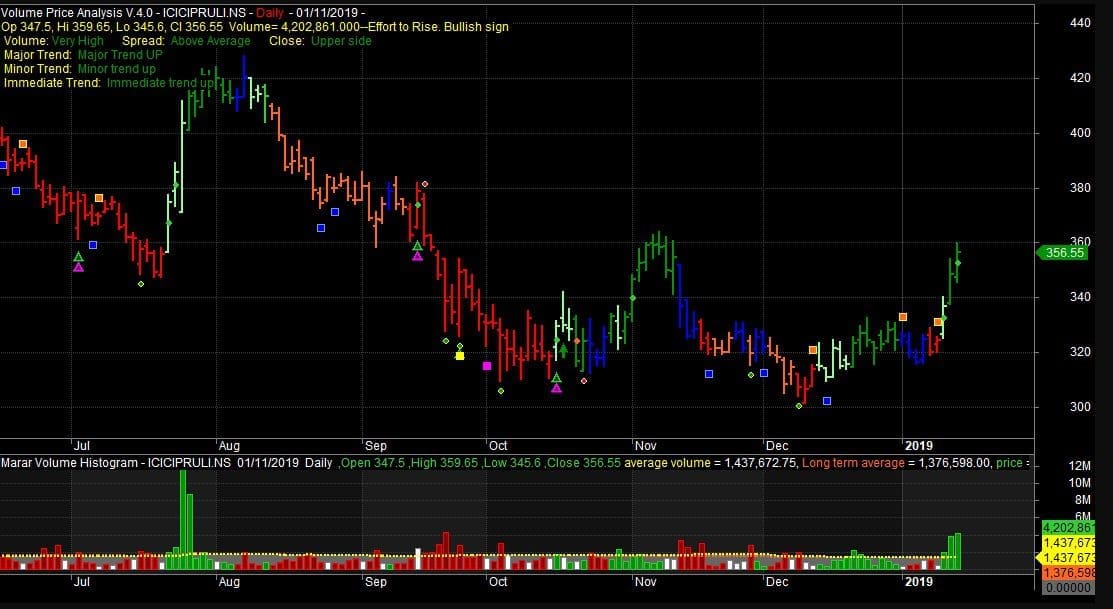
You can download the Volume Spread Analysis indicator for AmiBroker from here. Use this indicator as an insider’s guide on what smart money is doing in the market.
FAQ
VSA stands for Volume Spread Analysis. Traders use it to compare a stock’s trading activity with its actual price. By locating supply and demand imbalances, one can determine whether a stock is likely to go up or down in value. To use the VSA indicator, compare the volume during each period with that of previous periods and identify any anomalies in patterns over time.
Depending on your individual investment style there are several indicators that could be considered ‘the best’ when analyzing trading volume. The most common indicators include Volume-Weighted Average Price (VWAP), On-Balance Volume (OBV), and Accumulation Distribution Line (ADL). Each of these takes into account different elements of volume analysis such as momentum or accumulation/distribution trends. Hence they may be better applicable to specific goals or strategies.
Volume Spread Analysis involves looking at both current volumes alongside historical price movements for an instrument to detect discrepancies between present prices versus expected ones based on prior performance – specifically how much buyers vs sellers have entered into trades over time. This helps analysts build strong trend indications by correlating changes in prices against buying/selling power and spotting potential reversals before they happen.
It depends on factors such as information accuracy regarding past transactions trend identification abilities of the analyst concerned, market liquidity, etc., but generally speaking, it can be quite accurate in predicting upcoming trends if done properly by experienced investors due to its detailed nature. Plus using other technical indicators increases overall accuracy even further. However, no strategy should ever rely solely upon a single source alone regardless of how effective it might be initially perceived as being!
Conclusion
I am not claiming that the VSA indicator is easy to master. There are various concepts of VSA from different analysts. It’s not an overnight learning process. In order to be a master’s in VSA, years of practice and market observation are required. However, by knowing the basic VSA concept traders can improve their analytical ability. I hope this article has provided you with the simple as well as basic VSA concept.