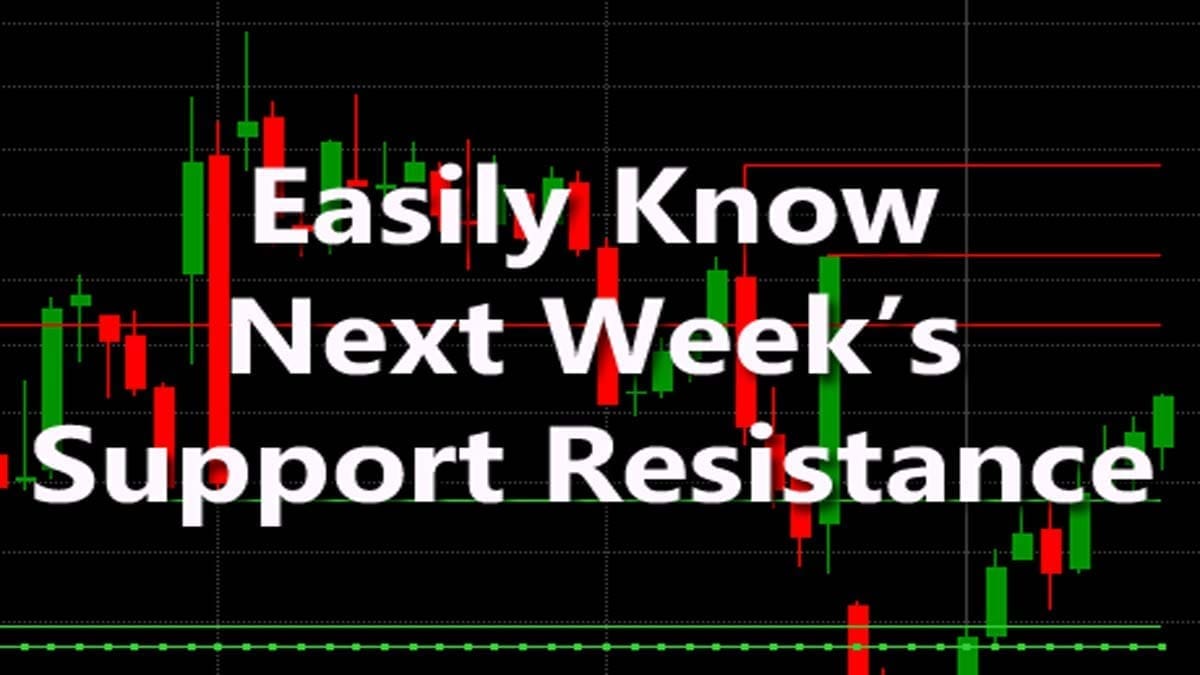
As a commodity trader in gold, you might be wondering what the gold price forecast and prediction will be for the coming week. It’s important to know the support and resistance levels for gold in order to make informed trading decisions. In this post, we will show you how to find the gold price next week’s support resistance using a simple pivot calculator and how to use this information to trade effectively.
Finding the Gold Price Next Week Support Resistance
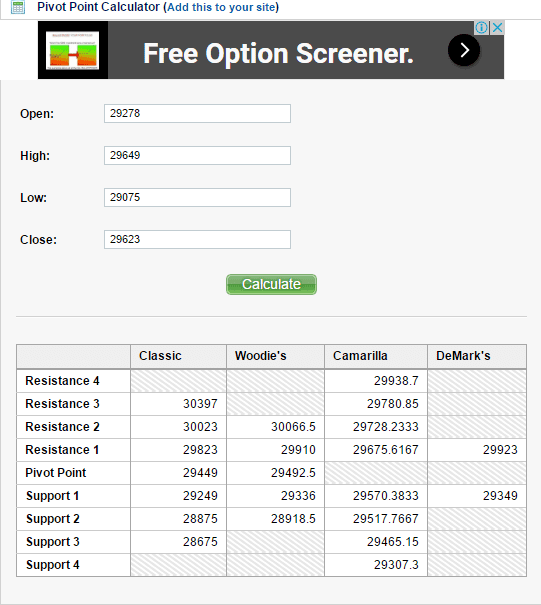
To find the gold price next week’s support resistance, we will use a simple pivot calculator. You can find many pivot point calculator pages on the web. If you don’t know any, click here to access our free pivot point calculator.
Before visiting this pivot point calculator page, note down the last week’s open/high/low and close for gold. You can access this information on Zerodha Kite by clicking here. Once you log in to Zerodha Kite, add Gold’s nearest month’s future in the market watch. For example, GOLD APR FUT. Now open the chat window by clicking on the chart icon. This will open the gold future chart in Kite. Change the chart time frame to weekly, and this becomes Gold’s weekly chart. Now you are all set to take the readings.
Next, put your cursor on the last candle and note down this candle’s OHLC value. Enter the same OHLC value on the pivot point calculator page. Use classic pivots to get one pivot point, three resistances (R1, R2, R3), and three supports (S1, S2, S3).
Gold Price Forecast and Prediction
Now that we have the gold price next week’s support resistance, let’s analyze the gold market and make some predictions.






One of the most common questions asked by traders is whether the gold rate will decrease in the coming days. It’s important to note that the price of gold is affected by a variety of factors such as political and economic events, interest rates, and inflation. Based on these factors, it’s difficult to predict the gold rate with certainty. However, by analyzing the support and resistance levels and using technical analysis, traders can make informed trading decisions.
Gold Analysis Today
To analyze gold today, we can look at the support and resistance levels. If gold is trading above the weekly pivot point, traders can have a long bias. On the other hand, if gold is trading below the weekly pivot point, traders can have a short bias. The weekly R1 can be strong resistance, and the weekly S1 can be strong support. In both ways, traders can try a counter-trend trade.
Gold Buy or Sell Today
Whether to buy or sell gold today depends on the support and resistance levels. If gold is trading above the weekly pivot point and near the weekly R1, it might be a good idea to sell. Conversely, if gold is trading below the weekly pivot point and near the weekly S1, it might be a good idea to buy.
Gold Price Predictions for the Next 5 Years
Predicting the gold price for the next 5 years is challenging as it depends on a variety of economic and political factors. However, based on historical trends, it’s safe to assume that gold prices will continue to fluctuate in the coming years. Some technical analysts believe that gold prices will increase due to geopolitical uncertainties. They suggest investing in exchange-traded funds for this precious metal. On the other hand, others predict a decrease due to the economic recovery after the pandemic.
Gold Rate Prediction for Tomorrow using Support and Resistance Analysis
To predict the gold rate for tomorrow, traders can use the same pivot point calculator and analyze the support and resistance levels. If gold is trading above the daily pivot point and near the daily R1, traders can consider selling. Conversely, if gold is trading below the daily pivot point and near the daily S1, traders can consider buying.
Different Gold Contracts in MCX
In MCX, there are different gold contracts available for trading, such as Gold, Gold Mini, and Gold Guinea. Gold is the standard contract size, and Gold Mini is one-tenth of the standard contract size. Gold Guinea is a contract size that lies between Gold and Gold Mini. For safe investors, the Indian Government also offers sovereign bonds for gold.
The profit potential of gold futures trading depends on the contract size, trading strategy, and market conditions. Traders can take advantage of the leverage offered by futures trading to amplify their gains. However, they should also be aware of the risks involved, such as the potential for losses due to market fluctuations.
FAQs on Gold Price and its Support Resistance
It’s difficult to predict the direction of the gold price for the next day as it is affected by a variety of factors such as political and economic events, interest rates, and inflation. By analyzing the support and resistance levels and using technical analysis, traders can make informed trading decisions.
The support and resistance levels of gold can change daily based on various factors affecting the market. It’s important to calculate these levels daily using a pivot point calculator and analyze the market to make informed trading decisions.
Predicting the gold price for a long-term period such as 2023 is challenging as it depends on a variety of economic and political factors. However, based on historical trends, it’s safe to assume that gold prices will continue to be affected by global economic events, inflation rates, and interest rates.
Predicting the future price of gold is challenging as it is affected by a variety of factors such as political and economic events, interest rates, and inflation. Traders can use technical analysis and calculate levels of support and resistance to make informed trading decisions. However, it’s important to note that the gold market can be volatile, and it’s always best to have a well-planned trading strategy in place.
Conclusion
In conclusion, understanding the gold price next week’s support resistance is crucial for making informed trading decisions in the gold market. By using a pivot point calculator and technical analysis, traders can analyze the support and resistance levels and predict the gold rate for the coming week or day. Additionally, knowing about different gold contracts in MCX and the profit potential of gold futures trading can help traders optimize their trading strategy.