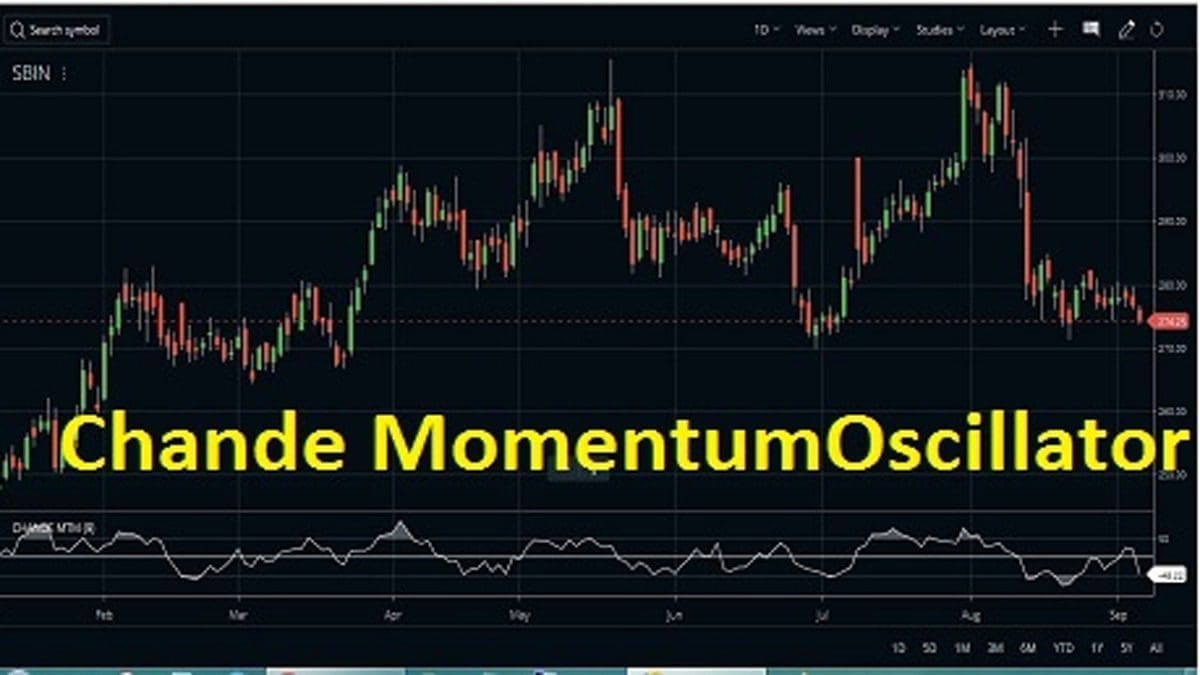
Chande Momentum Oscillator (CMO) was introduced by Tushar Chande who also invented the forecast version of the oscillator. He has created the oscillator by calculating the difference between the sum of all recent gains and that of all recent losses over a particular period of time. Then he divided the result by the sum of all price movement over that period of time.
What is Chande Momentum Oscillator?
This is also an oscillating indicator that oscillates between some extremes. The oscillator is range bound and the values hover between +100 to -100. The price of the stock moves between an overbought zone and an oversold zone. It moves to an overbought zone when the oscillator move beyond +50 and the price moves to an oversold zone when the oscillator goes below -50.
Chande Momentum Oscillator Formula
The formula is quite simple. The CMO or Chande Momentum Oscillator = (Sum of all the gains – Sum of all the differences / Sum of all the gains + Sum of all the differences) * 100


How to set up Chande Momentum Oscillator on the charts?
- The CMO is available in Zerodha Kite. Follow the procedure below to attach it to a chart.
- Open your MarketWatch and select the stock that you want this indicator to test.
- Open the chart of that stock.
- From the Studies, go to Chande Momentum Oscillator and click on it.
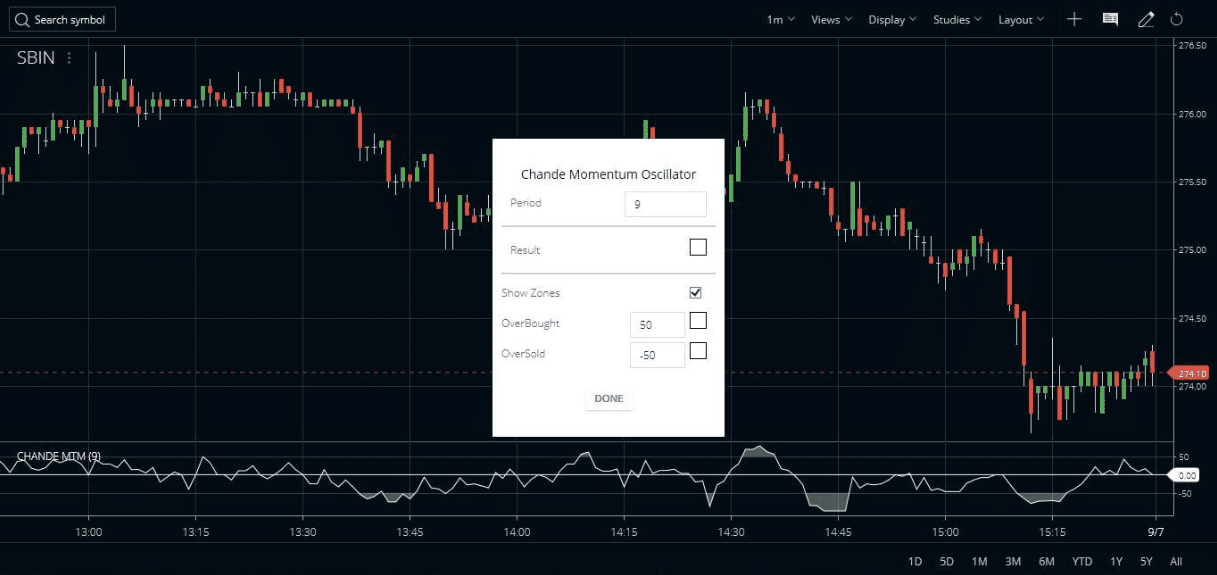
- A small window will open with the default parameters of the CMO.
- By default, the period is 9. The color is white. There is an option to hide or show the overbought oversold zones. By default, the overbought zone is 50 and the oversold zone is -50.
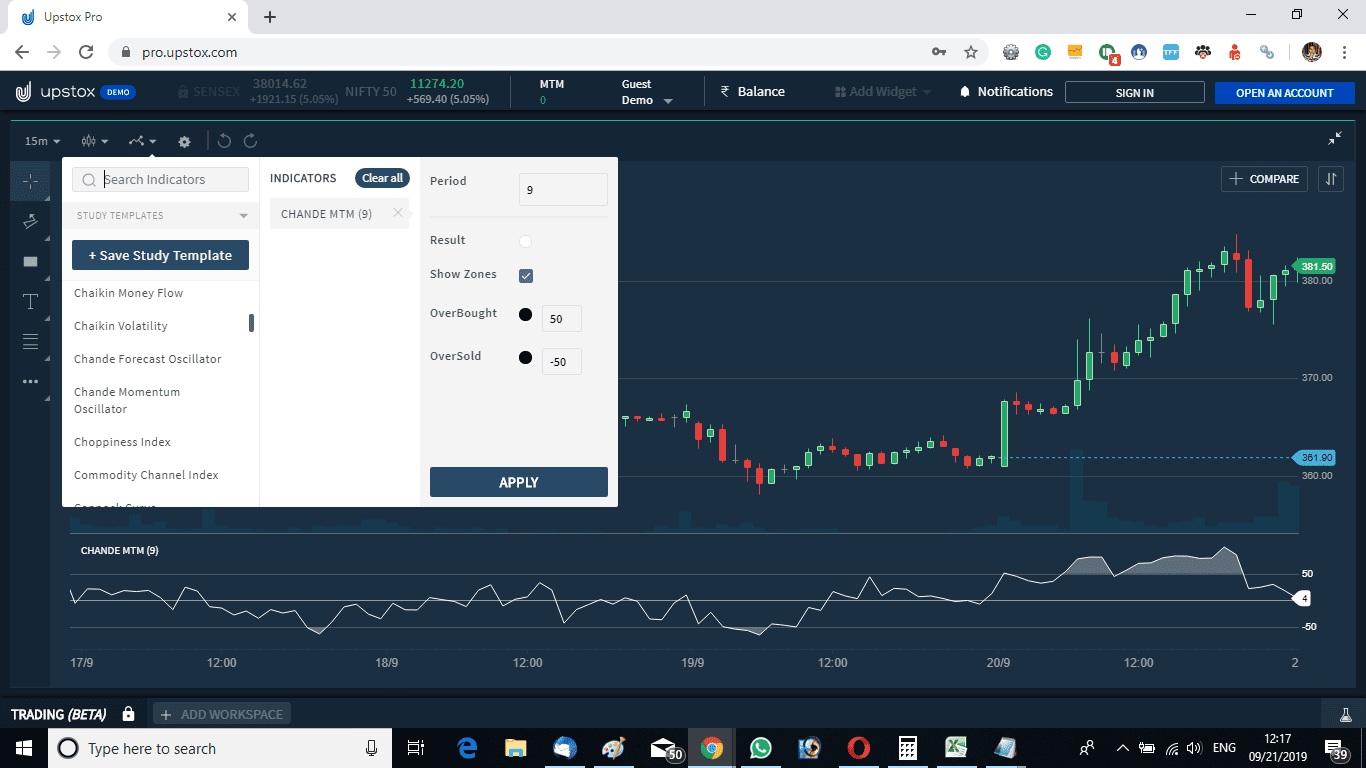
In the same way, you can attach the CMO indicator on the Upstox Pro web terminal. There is no difference in the default parameters in Zerodha and Upstox terminals.
Trading strategy using the Chande Momentum Oscillator
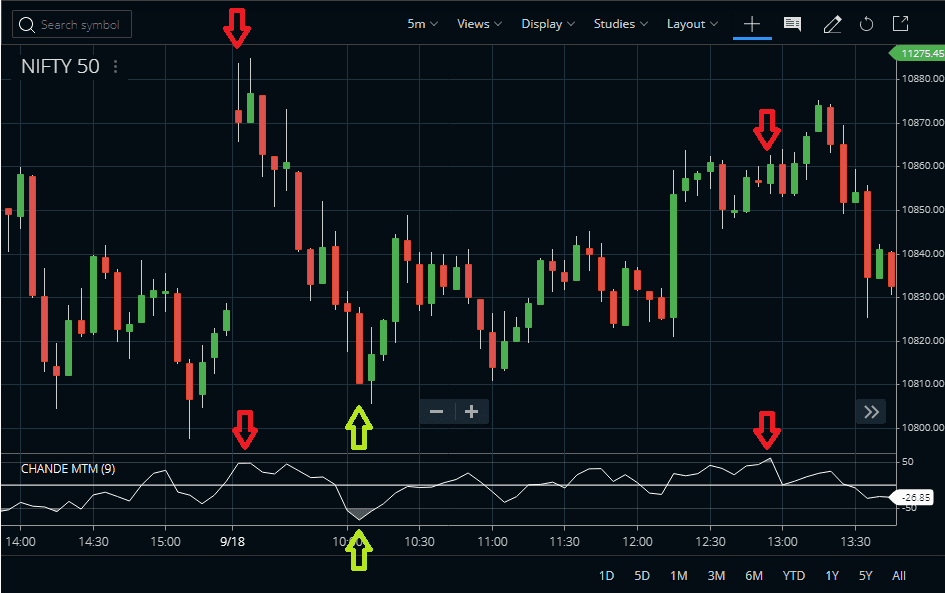
#1 Simple Trading Rules
- Create a fresh buy once the oscillator goes up after moving off from the oversold zone.
- Exit the buy position and create a short position when the oscillator starts coming down with intensity after reaching the overbought zone.
- Watch the image below.
#2 Advanced Trading Strategy
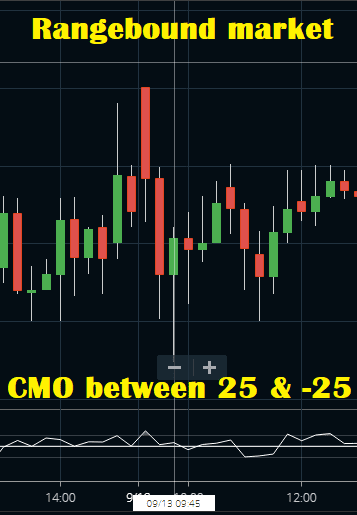
Some traders even use this indicator to trade the possible trend. They enter a buy trade when the CMO is reading high and exit when the indicator moves below a certain threshold. You can judge when a market is choppy by the reading of this oscillator if remains between +25 to -25. So if other indicators are showing a trend and Chande Momentum Oscillator is in the chop zone, it denotes that the trend is lacking momentum and it is better to avoid trade at that time.
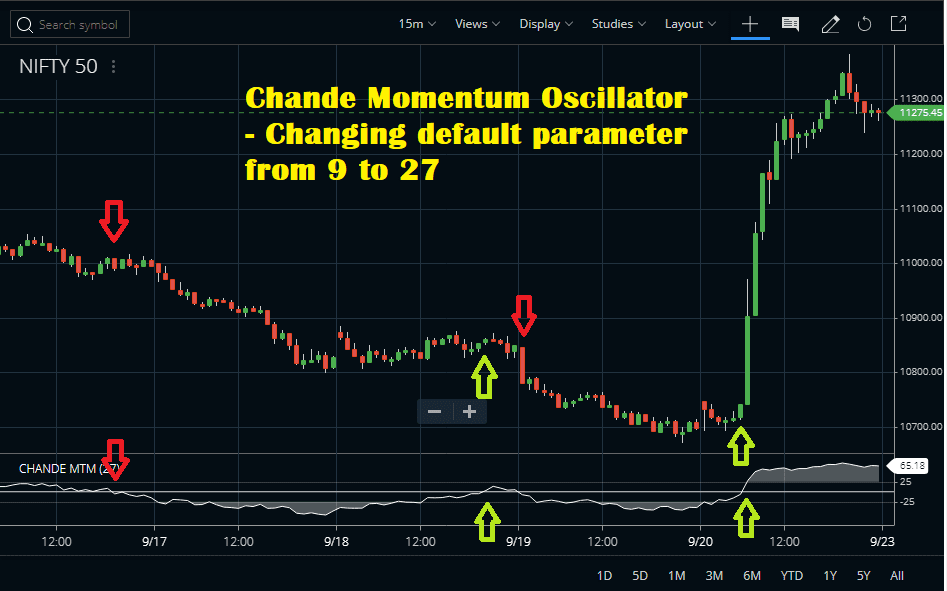
#3 Tweaking the Parameters
We can change the default parameters from default 9 to 27. This can create a slower signal but can generate much more stable signals using the zero-line crossover. Check the image below.
Suggested Reading
The following book by Tushar S Chande may be helpful in understanding his strategies: Financial Plans for Successful Wealth Management In Retirement: An Easy Guide to Selecting Portfolio Withdrawal Strategies.

FAQ
The Chande Momentum Oscillator (CMO) is a technical analysis indicator developed by Tushar S. Chande that measures momentum to determine whether an asset is being overbought or oversold. It does this by comparing the sum of all recent gains and losses in closing prices along with their amplitudes.
While the Relative Strength Index (RSI), another popular momentum indicator, compares average gains to average losses within a specified period, CMO does so by taking into account both gains and losses in price changes as well as the frequency of those price swings during that same time frame.
While established values differ among traders when comparing trading strategies, most agree that readings above +50 indicate there’s more upward pressure while something below -50 means downward movement may be expected on whatever security they are tracking.
Different indicators work better for different investing styles and goals, so it really depends upon your individual needs as an investor or trader when selecting which one to use for your strategy. However, many people find success with using combinations of several types including RSI, MACD, or Moving Average Convergence Divergence Indicators in addition to CMO when attempting to gauge market forces before entering trades.
Conclusion
The Chande Momentum Oscillator or CMO was created by Tushar Chande. The CMO is in many sense much like the Stochastics Indicator. It oscillates between +100 and -100 levels. It can give a clear direction of the market using the overbought and oversold signals. Apart from that, it can also generate signals using the zero-line cross-over.

")
 Indicator: Formula, Settings & Strategy")