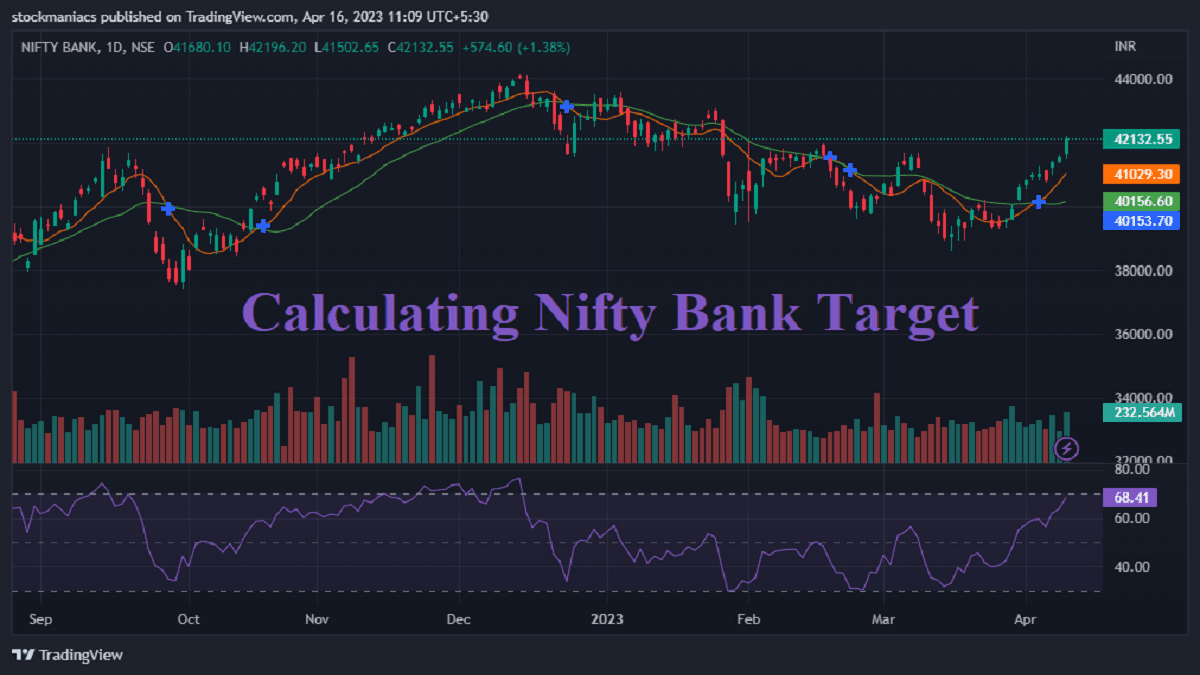
On the Indian stock market, Bank Nifty is one of the INDICES that is traded the most. It comprises the most liquid and large-cap banking stocks listed on the National Stock Exchange (NSE). Bank Nifty is an important indicator of the banking sector’s performance in the stock market. Therefore, in this post, we will discuss how to analyze the live charts of Bank Nifty and find its target using pivot points and market profile charts.
What is Bank Nifty?
Bank Nifty is an index comprising the most liquid and large-cap banking stocks listed on the National Stock Exchange (NSE). The index is calculated using the free-float market capitalization-weighted methodology. Bank Nifty represents the banking sector’s performance in the Indian stock market. This index is a useful tool for investors and traders to gauge the banking sector’s performance and make informed trading decisions.
Analyzing the Live Chart of Bank Nifty
To analyze the live chart of Bank Nifty, we can use popular charting platforms like Zerodha Kite and TradingView. These platforms offer a range of charting tools and technical indicators to analyze the price and volume of Bank Nifty. We can use various chart types like Heikin Ashi charts, Renko charts, and point-and-figure charts to analyze the live chart of Bank Nifty.
Using Pivot Points to Find Daily Targets
Pivot points are a popular technical analysis tool used to find the support and resistance levels of an asset. We use the high, low, and closing prices from the day before to calculate pivot points. We can use pivot points to find the daily targets of Bank Nifty. There are three types of pivot points – daily pivot points, weekly pivot points, and monthly pivot points.
To find the daily targets of Bank Nifty, we can use the daily pivot points. The formula to calculate the daily pivot point is:
Pivot Point (PP) = (High + Low + Close) / 3
The formula to calculate the support and resistance levels is:
Support 1 (S1) = (2 x PP) – High
Resistance 1 (R1) = (2 x PP) – Low


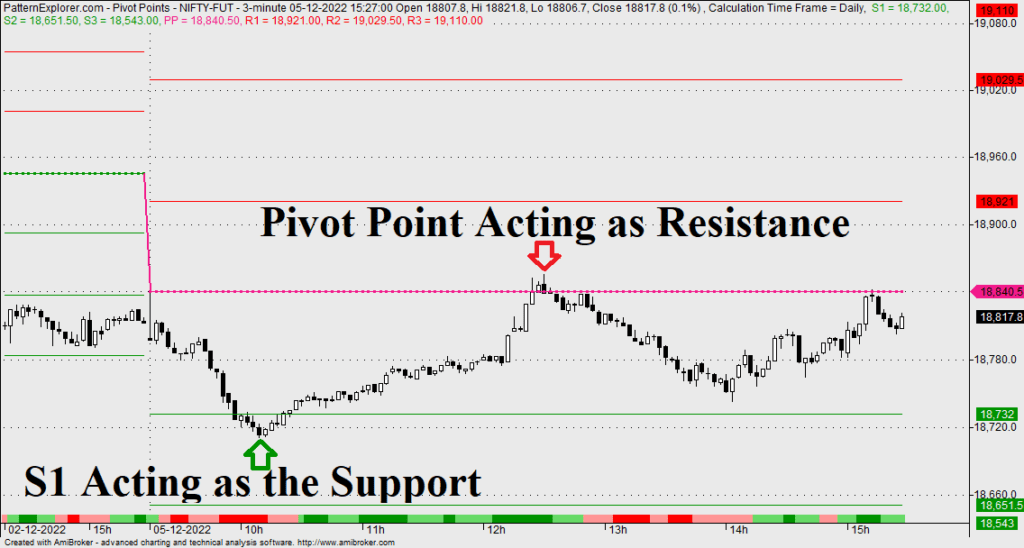
If the opening price of Bank Nifty is above the pivot point, it is considered bullish, and if it is below the pivot point, it is considered bearish. Pivot points can be used in conjunction with other technical indicators like moving averages, oscillators, and chart patterns to make informed trading decisions.
Using Market Profile Charts to Find Daily Targets
Market Profile charts are a popular tool used by traders to analyze the price and volume of an asset over time. Market Profile charts can help us identify the fair value of an asset and find the daily targets based on the Point of Control (POC) and virgin or untested POC.
The POC is the price level where most trading activities took place during the trading day. The virgin or untested POC is the price level where trading activity did not take place in the past. These levels can act as support and resistance levels and help us find the daily targets of Bank Nifty.
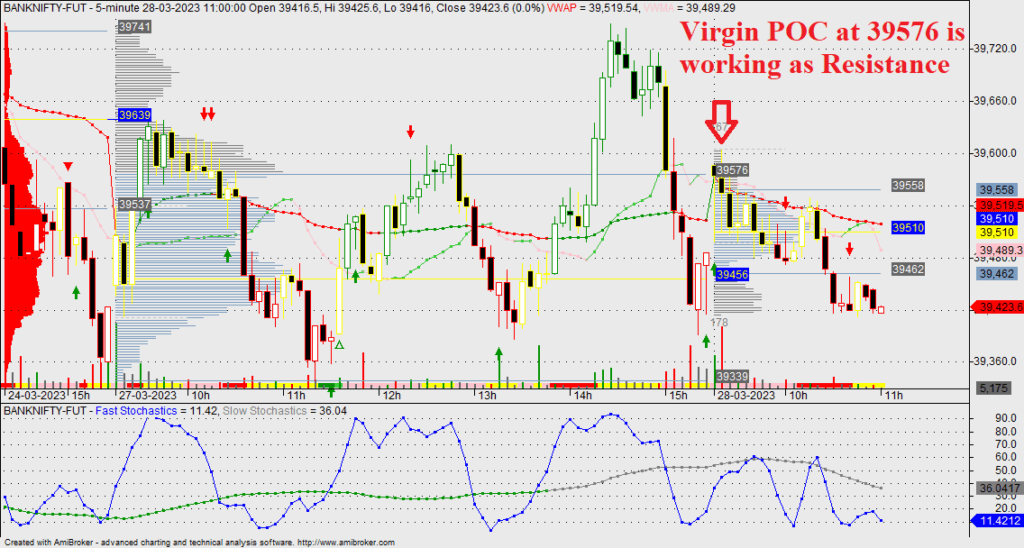
To find the daily targets using Market Profile charts, we can follow these steps:
- Plot the Market Profile chart of Bank Nifty on TradingView or GoCharting.
- Identify the POC and virgin or untested POC.
- Use the POC and virgin or untested POC as support and resistance levels to find the daily targets.
- You can get good Market Profile charts on a website called GoCharting.
Using CPR to Find the Trend of Bank Nifty
The Central Pivot Range (CPR) is a popular technical analysis tool that traders use to find the trend of an asset. We calculate CPR based on the high, low, and close of the previous day. CPR helps us identify the overall trend of Bank Nifty and make informed trading decisions. The CPR consists of three levels – the upper level, lower level, and central level.
The formula to calculate the CPR is:
Central Pivot Range (CPR) = (Previous High + Previous Low + Previous Close) / 3
To calculate the upper level, add the CPR to the difference between the previous high and the previous low.
Upper Level = CPR + (Previous High – Previous Low)
We can calculate the lower level by subtracting the difference between the previous high and the previous low from the CPR.
Lower Level = CPR – (Previous High – Previous Low)
If the opening price of Bank Nifty is above the central level of the CPR, we consider it bullish. Similarly, if it is below the central level, we consider it bearish. If the CPR is higher than the last trading day it is an uptrend. Similarly, if the CPR is lower than the last trading day it is a downtrend.

We can use the CPR in conjunction with other technical indicators like moving averages, trend lines, and chart patterns to find the trend of Bank Nifty.
FAQs on Bank Nifty Target:
The target for Bank Nifty depends on various factors such as market sentiment, global cues, and economic indicators. Traders and investors can use technical analysis tools like pivot points, market profile charts, and Central Pivot Range (CPR) to find the daily targets of Bank Nifty. It is essential to do thorough research and analysis before setting a target for Bank Nifty.
Predicting the Bank Nifty trend requires a thorough analysis of the market conditions and various economic indicators. Traders and investors can use technical analysis tools like Moving Averages, Relative Strength Index (RSI), and Bollinger Bands to identify the trend of Bank Nifty. It is essential to keep an eye on global cues, political events, and economic indicators to predict the Bank Nifty trend accurately.
The best time to trade Bank Nifty is during the trading hours of the National Stock Exchange (NSE), which is from 9:15 AM to 3:30 PM (Indian Standard Time). During these hours, the market is most active, and there is high liquidity in Bank Nifty stocks. Traders and investors should also keep an eye on global cues and economic indicators, which can impact the market sentiment and the Bank Nifty index.
Both Nifty 50 and Bank Nifty have their advantages and disadvantages. Nifty 50 comprises the top 50 large-cap stocks listed on the NSE. Similarly, Bank Nifty comprises the most liquid and large-cap banking stocks listed on the NSE. Various sectors determine the performance of Nifty 50, whereas the banking sector primarily drives Bank Nifty’s performance. The profitability of Nifty 50 or Bank Nifty depends on market conditions and various economic indicators. Traders and investors should do thorough research and analysis before deciding which index to trade.
Conclusion
Analyzing the live charts of Bank Nifty and finding daily targets using pivot points, Market Profile charts, and CPR can help us make informed trading decisions. These technical analysis tools are widely used by traders and investors in the Indian stock market to gauge the banking sector’s performance and find trading opportunities. However, it is important to note that technical analysis is not a guarantee of success in the stock market. It is essential to have a sound understanding of fundamental analysis, risk management, and market psychology to succeed in the stock market.


