2024 may come out as one of the most important years due to the election and its effects on the Indian stock market. During the election period, unpredictability is common and the impact may exist even after two-three months of the voting result. Investors who are planning for long-term holdings may use market volatility in a positive way. In this article, we will provide our analysis of this year’s Top 9 Fundamentally Strong Stocks with Low Price.
The Role of Fundamental Analysis for Picking Up of Stocks
In the case of long-term investment, fundamental analysis is a safer option if it is done correctly. Let’s have a quick look at the definition of the fundamental analysis.
The fundamental analysis contains the company’s overall economic condition, earnings, expenses, assets, liabilities, and economic events. Investors mainly evaluate the stock value using economic factors like profit-loss, asset-liabilities, EPS (earnings per share), P/E (price-to-earnings ratio), etc.
Top Fundamentally Strong Stocks with Low Price
As I’ve mentioned, we’ve selected the best 9 stocks after proper analysis. These are some of the well-known companies in the market such as SBI (State Bank of India), BPCL, TCS, Coal India, HDFC Bank, Infosys, ONGC, Maruti, and Wipro.
Now, let’s go forward towards the analytical details of selected Fundamentally Strong Stocks with Low Price. Here, we’ve done the analysis based on the past 10 years’ financial history of each company. The companies are undoubtedly fundamentally strong companies based on their 10 years of x-rays. Here, the company detail is given below. The first company fundamentals that I am going to describe is SBi (State Bank of India, NSE: SBIN).
State Bank of India (SBI)
Company Summary
SBI is a Government corporation statutory body, ranked 216th in the Fortune Global 500 list. In India, it is considered the largest PSU bank with a 23% market share. The multinational, public sector banking and financial services body also have an excellent past financial record. Here is the data:
Financial Details
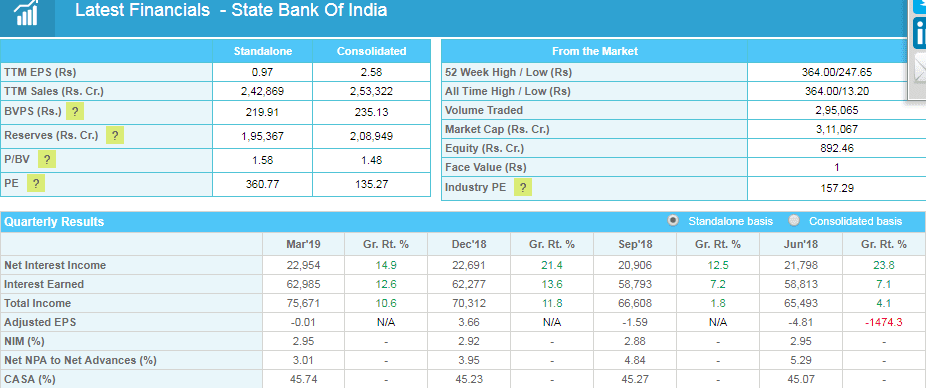
The above data contains the latest financial updates of the company. It also reflects fundamental details like 52 weeks high/low, market cap, face value, industry P/E, etc.
Currently, the share price stands at the level of 352 with 52 Week High / Low (Rs) 364.00/247.65 All-Time High / Low (Rs) 364.00/13.20. The market cap is 3,11,067 Cr. Apart from this, the bank also has a pretty good record of EPS (2.58), P/BV(1.48), and P/E(135.27). These statements are on a consolidated basis.
Shareholding Pattern
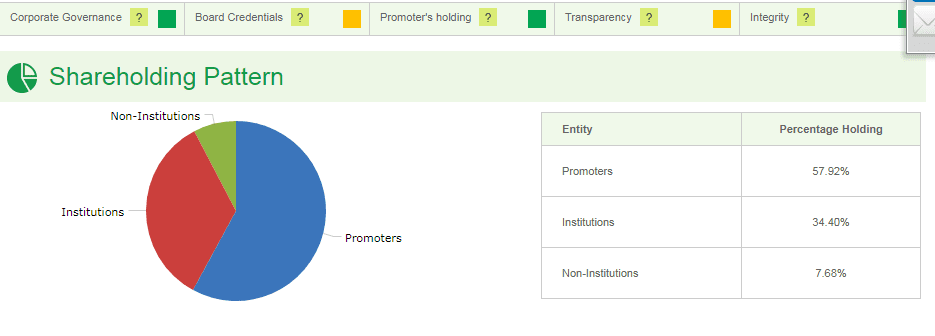
Promoters’ holdings are one of the main lookouts for investors. In this company, the promoter holding is 57.92%, Institutions (34.40%), and Non-institutions (7.68%).
Bharat Petroleum Corp Ltd
Company Summary
The second of the fundamentally strong stocks with a low price is Bharat Petroleum Corp Ltd. The Government of India controlled Maharatna Oil and Gas Company engaged in the operation of two large refineries in the country. It is the 2nd largest downstream oil company, ranked 342nd on the Fortune list.
Financial Details
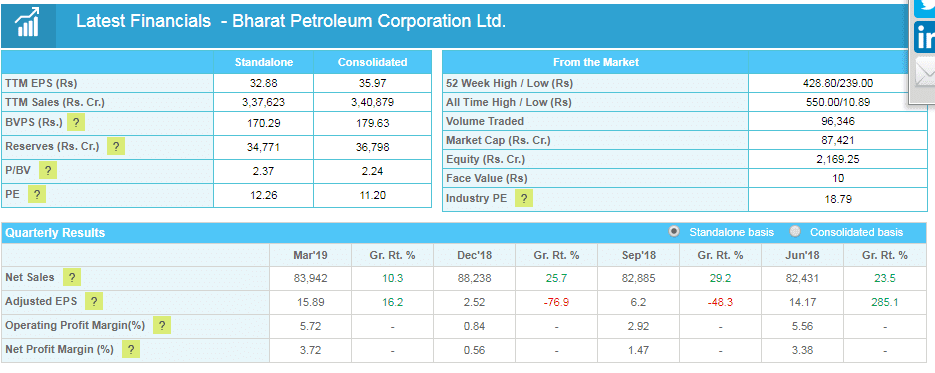
Let’s have a quick look at the company’s financials. As per the report, 52 Week High / Low (Rs) 428.80/239.00 All-Time High / Low (Rs) 550.00/10.89. At present, BPCL’s share’s LTP is going at the level of 407.55. Apart from this, fundamental ratios like EPS (earnings per share) are 35.97, P/BV (2.22), and PE ratio (11.09). Under the fundamental details, the chart also reflects the quarterly result of the company.
Shareholding Pattern
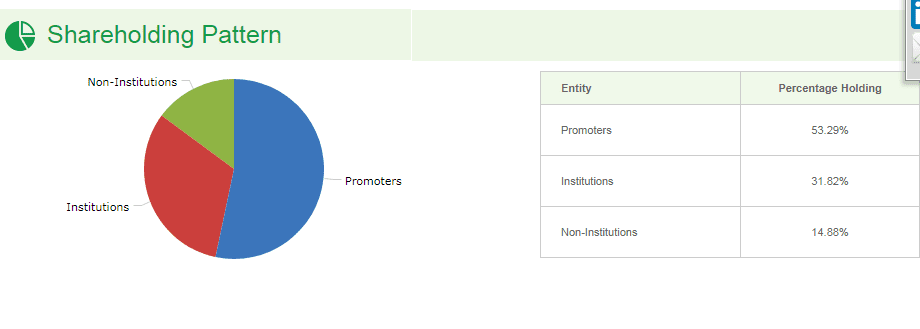
Here, is the shareholding pattern of BPCL. The shareholding pattern reflects promoter’s holdings(53.29%), Institutions(31.82%) and Non-Institution (14.88%).


Infosys
Company Summary
The Indian multinational corporation provides business consulting, IT, and outsourcing services. The 2nd largest IT company ranked 596th largest public sector company in the world.
Financial Details
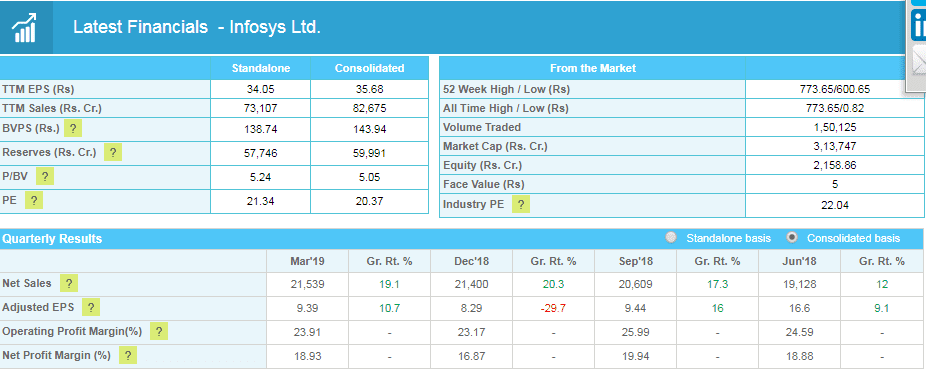
Now, have a look at the financials. According to the current position, Infosy’s share runs at the level of 740.80. It’s 52 Week High / Low (Rs) 773.65/600.65 and All-Time High / Low (Rs) 773.65/0.82. The company’s market capitalization is 3,16,618 which is a pretty good figure. Besides the above details, the chart displays fundamental ratios like EPS (35.68), P/BV (5.09), and PE (20.55). In the quarterly result, there are net sales, operating profit margin, and net profit margin growth rates.
Shareholding Pattern
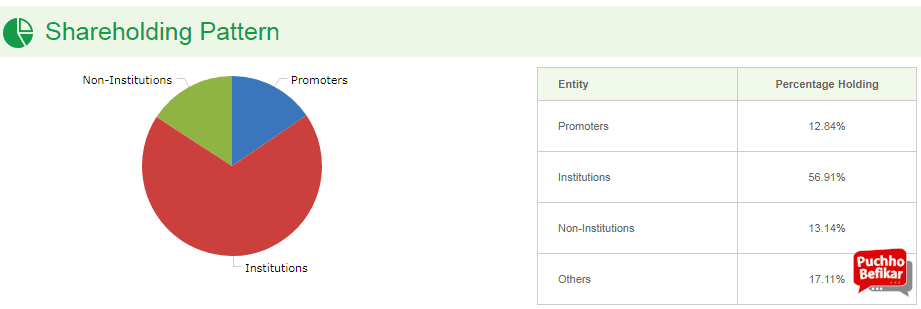
Infosys’ shareholding pattern is quite interesting. Here, Institutions own more than 56% of the shares of the company. The high interest of the institutions causes more demand among retail investors. There are also non-institutions (13.14%), promoter’s holdings (12.84%) and others’ holdings (17.11%).
Maruti Suzuki
Company Summary
Maruti Suzuki, formerly known as Maruti Udyog Ltd is a popular automobile manufacturer in India. The company has owned 56.21% subsidiary of the Suzuki Motor Corporation. According to 2018 updates, Maruti also has a 53% market share of the Indian passenger car market. As per the 2015 May record, the company produced fifteen million vehicles in India.
Financial Details
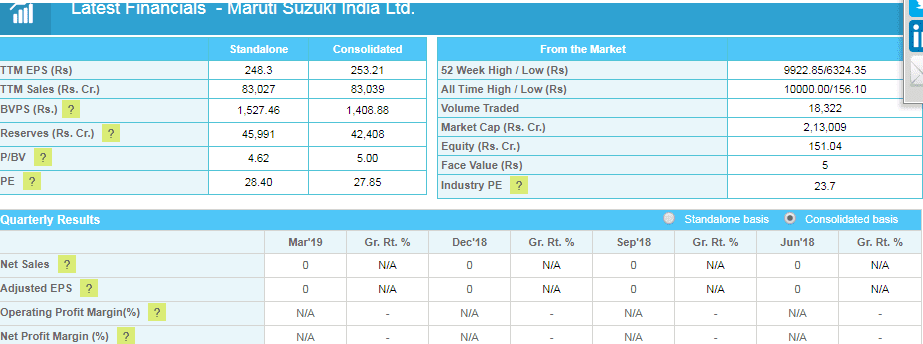
The latest financial chart shows the company share hits 52 Week High / Low (Rs) 9922.85/6324.35 All-Time High / Low (Rs) 10000.00/156.10. As of the present market value, Maruti’s share price is 6.891.00. Also, the market capitalization of the company exceeds 2,07,189. It’s EPS (253.21), P/BV (4.87), and PE (27.09).
Shareholding Pattern
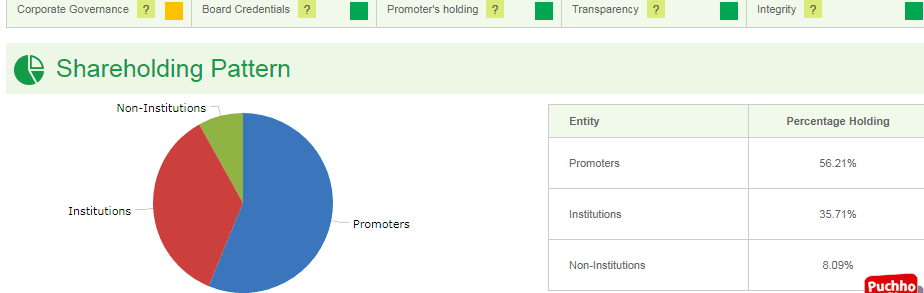
According to the shareholding pattern, the promoters’ shareholding pattern is highest here(56.21%). Besides this, institutions hold 35.71% and non-institutions hold 8.09% shares.
Coal India
Company Summary
Coal India Limited, in short CIL, is a Kolkata-based state-controlled coal mining company. It is considered one of the largest coal-producing companies in the world.
Financial Details
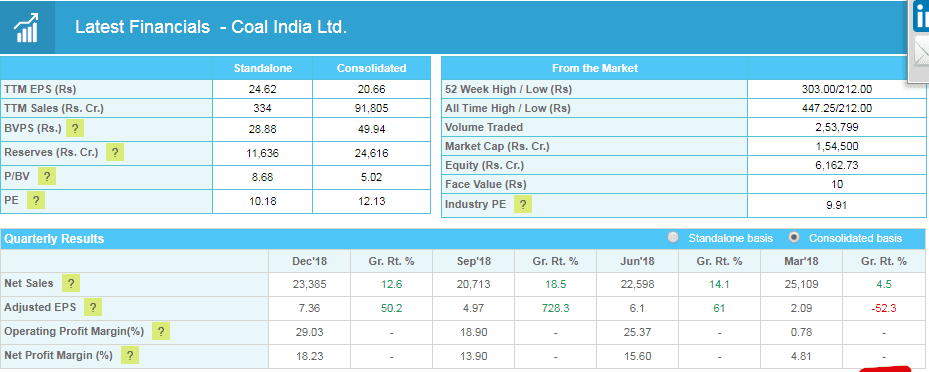
The above information contains a market cap of 1,56,133. Besides this, there is other information like 52 Week High / Low (Rs) 299.60/212.00 All-Time High / Low (Rs) 447.25/212.00. The Current Coal India share price is going to the level of 256.50. The fundamental data are also reflected in this chart. EPS (Earnings per share) was 28.33, P/BV (5.90), and PE (8.94).
Shareholding Pattern
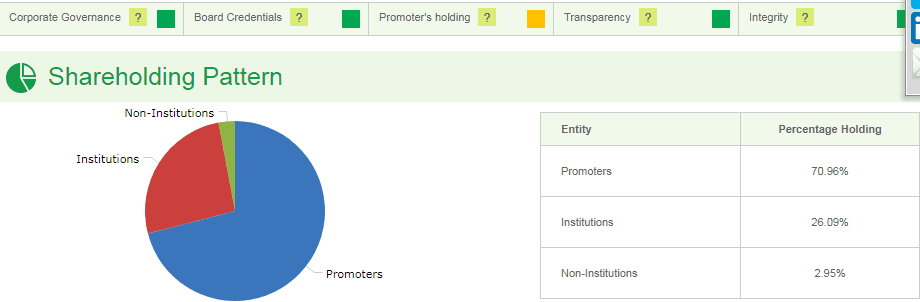
As you can see the promoters’ shareholding pattern is highest here. After that, institutional holding takes place. Here, promoters’ holdings pattern is more than 70%, institutions(26.09%) and non-institutions(2.95%).
Tata Consultancy Services
Company Summary
The Indian multinational information technology service and consultancy company is a subsidiary of the Tata Group. The company operates in 147 nationalities across 46 countries. As per the market capitalization record, it is the largest Indian company.
Financial Details
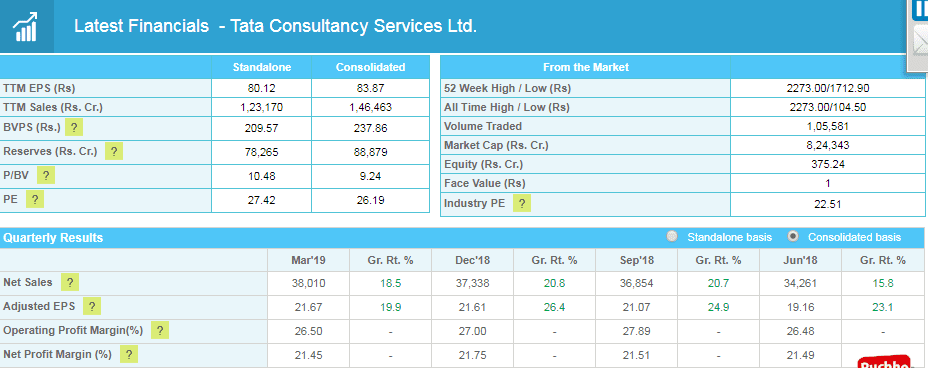
Let’s have a quick look at the financial details of the company. I’ve already mentioned that market cap-wise it is India’s largest company. The market cap of the company is 8,24,343. Presently, the market price is going on 2,218.90 marks. The fundamental details like EPS (83.97), P/BV (9.24), and PE (26.19) are given here.
Shareholding Pattern
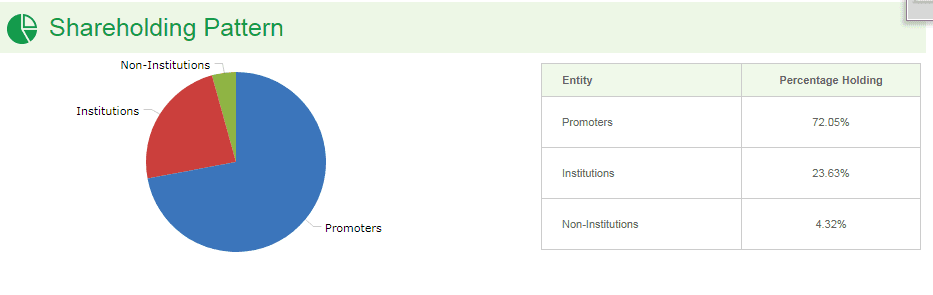
The shareholding pattern shows promoter’s holdings are more than institutions and non-institutions. Promoters hold 72.05% of the company’s shares, institutions hold 23.63% of shares and non-institutions hold 4.32% of shares.
HDFC Bank
Company Summary
HDFC Bank is an Indian banking and financial services company that is headquartered in Mumbai. Asset wise it is India’s largest private sector bank. As per the record of 31 March 2018, the company has 88,253 permanent employees.
Financial Details
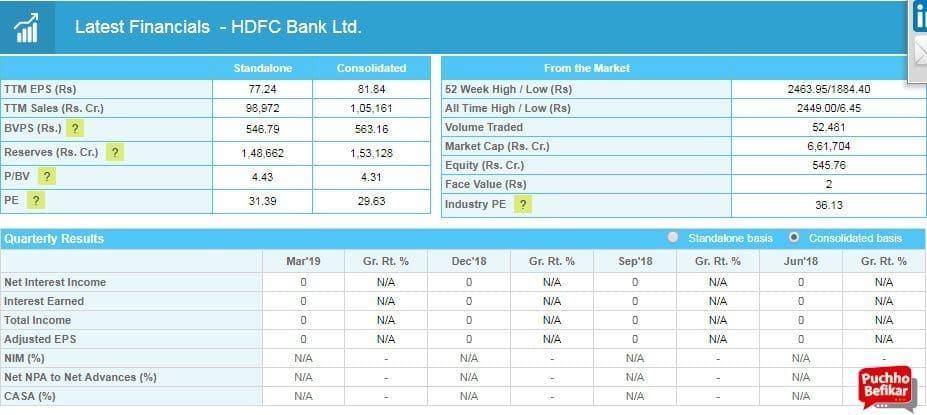
The financial statement reveals every financial detail of the company. Its 52 Week High / Low (Rs) 2463.95/1884.40 All-Time High / Low (Rs) 2449.00/6.45 and CMP (current market price) is 2,453.95. Moreover, the statement shows its fundamental details as well. EPS (earnings per share) is 81.84. P/BV 4.31 and PE 29.63.
Shareholding Pattern
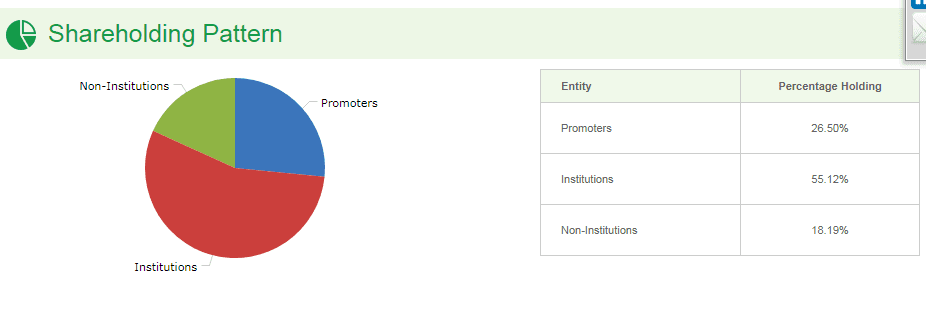
Here, the institutions holding is bigger in comparison to promoters and non-institutions. Institutions holding is 55.12%, non-institution holding is 18.19% and 26.50%.
Oil & Natural Gas Corporation
Company Summary
ONGC (Oil and Natural Gas Corporation) is an Indian multinational oil-gas company. The company is a public sector understanding of the Govt of India, under the administrative control of the Ministry of Petroleum and Natural Gas. In India, ONGC is the largest oil and gas exploration and production company which produces around 70% of India’s crude oil and around 62% of its natural gas.
Financial Details
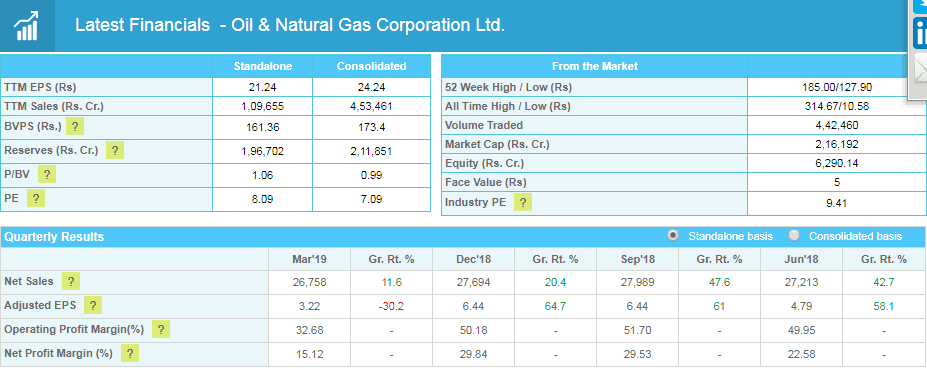
This is a mid-cap company, having a market cap of 2,16,192. At present, the company’s share price is 172.90. Now, we will look at the 52 weeks high/low Rs. 185.00/127.90 all-time high/low Rs. 314.67/10.58. P/BV (0.99), EPS (24.24) and PE (7.09) are given there.
Shareholding Pattern
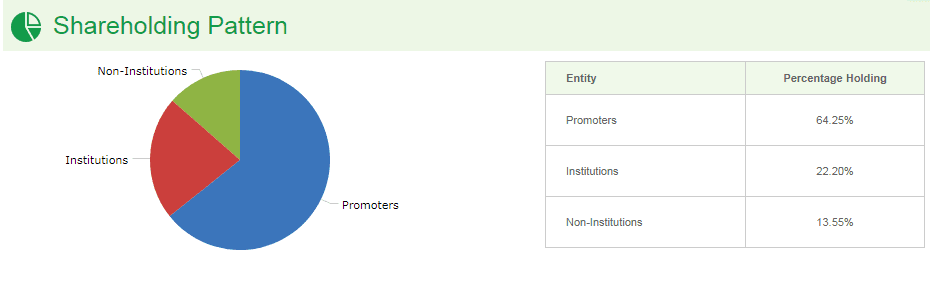
In the company, promoters’ holding is a maximum of of.25%. Apart from this, there are institutions and non-institutions holding. Institutions and non-institution holdings are 22.20% and 13.55% respectively.
Wipro
Company Summary
The Indian multinational corporation provides consulting, information technology and business process services. In the year 2013, the company separated its non-IT business into separate companies.
Financial Details
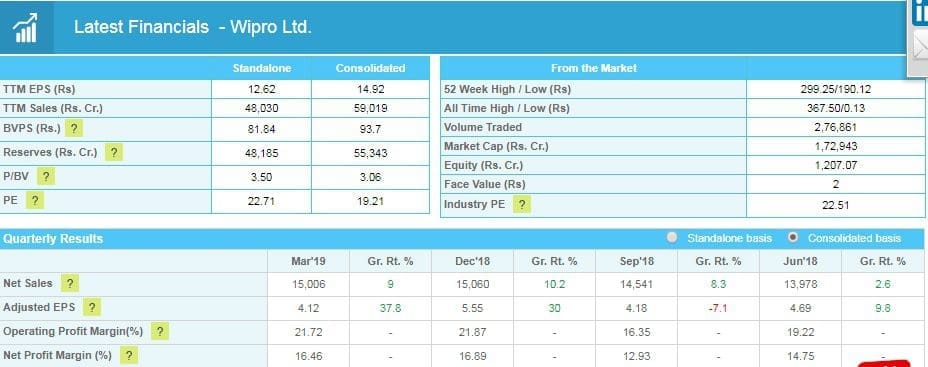
It is not a large-cap company, the market cap of the company is 1,72,943 and 52 Week High / Low (Rs) 299.25/190.12. All-Time High / Low (Rs) 367.50/0.13. The present market value of the company’s share is 291.55. Moreover, the fundamental data reflects EPS (14.92), P/BV (3.06), and PE (19.21).
Shareholding Pattern
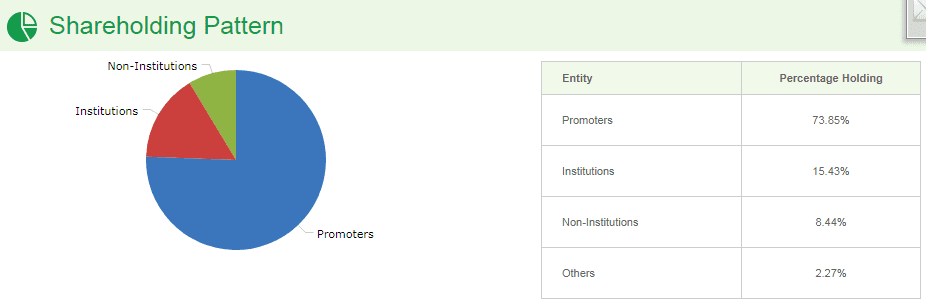
Here also the promoter’s holding is maximum, it stands at 73.85% level. Institutions and Non-institutions holdings are as follows 15.43%, 8.44%, and others holding is 2.27%.
There are some fundamentally strong stocks with low prices in the Indian equity market.
Conclusion
However, we’ve tried our best to present a list of fundamentally strong stocks with a low price. Moreover, our recommendation is to buy these stocks at the dips and hold them mid to long-term basis for profit maximization. Fundamentally strong stocks have such potential in them. We will soon come with another post with other fundamental stocks. So, keep an eye on our post for more updates and the latest news.


