Previously we discussed normal candlestick chart patterns on our site but today we will cover another variety of candlestick patterns which is the Heikin Ashi Candlestick Chart Pattern, sometimes also referred to as Heikin Ashi (HA). This pattern is less noisy than the normal candle. In the currency market due to its continuation, gap up and gap down come very often but in the commodity market and the stock market, this gap up-down comes regularly. Due to this gap, some indicator gets confused in normal candlestick. It includes this gap calculation in it and smoothly shows the average speed of market movements.
Calculation and Example
I have described earlier in our previous content that each normal candlestick consists of four main prices open, high, low, and close. These prices are based on today’s calculation but HA candle’s OHLC information is based on previous calculations.

The Formula of OHLC in Heikin Ashi Chart Pattern:
- Opening Price- Mid-point of the opening and close of the previous bar is the opening price of a Heikin Ashi candlestick.
(Open of the previous bar+Close of the previous bar)/2
- High Price- High is the maximum value of the three data points, the current period high, HA open, HA close.
(Max of Current period high, HA open, HA close)
- Low Price- Low is the minimum value of the three data points, the current period low, Heikin Ashi open, and Heikin Ashi close.
(Min of Current period low, HA open, HA close)
- Closing Price- It is the average of OHLC for the current period.
(open+high+low+close)/4


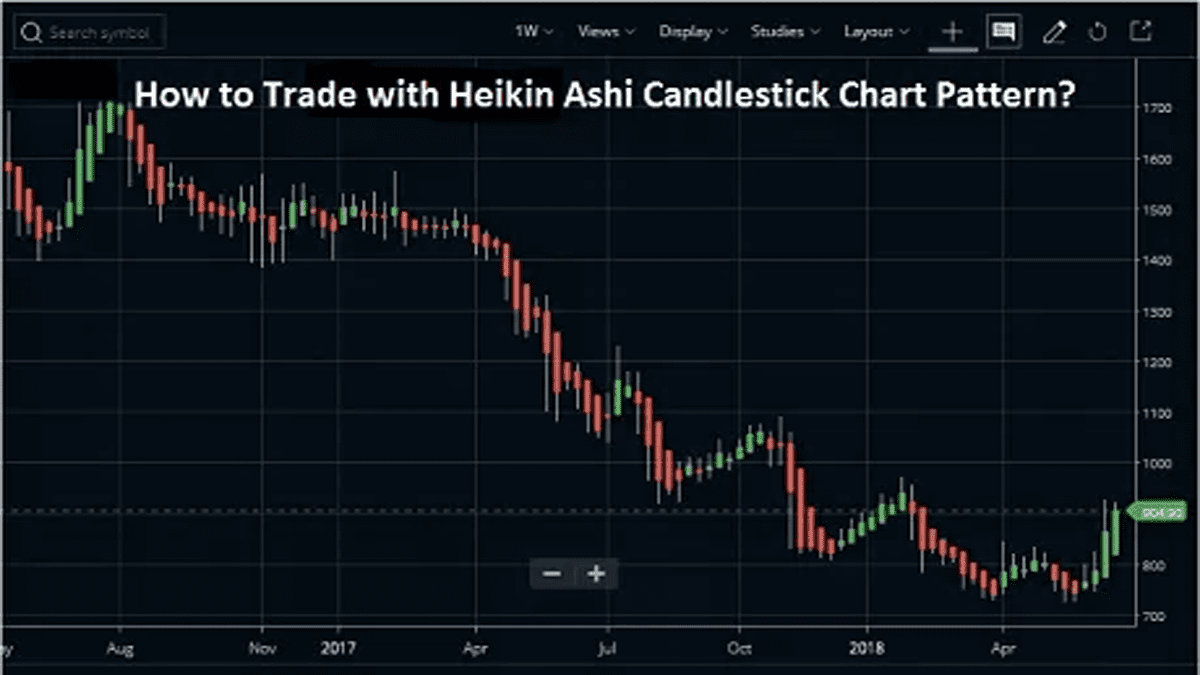
How to Trade with Heikin Ashi Candlestick Chart Pattern:
If you understand the pattern clearly, you will find it easier than a normal candlestick chart pattern. There are a few points to remember that will make your analyzing process easier.
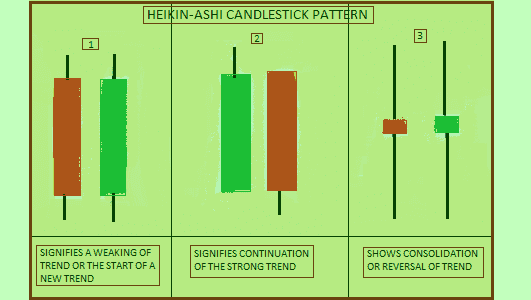
- Firstly, you need to concentrate on the colour coding of HA. The red colour candle indicates the market trend is in a negative way, therefore, the selling pressure is higher. On the other side, the Green colour candle shows a positive or bullish trend in the market, buyers’ demand is high here.
- Secondly, by noticing the tailor shadow, one can get an overview of the current market trend. If the red candle appears with no shadow on the top, it means the market is going down soon and forms a bearish trend. Oppositely, a green candle with no shadow at the bottom indicates an uptrend is coming soon and the market will go up.
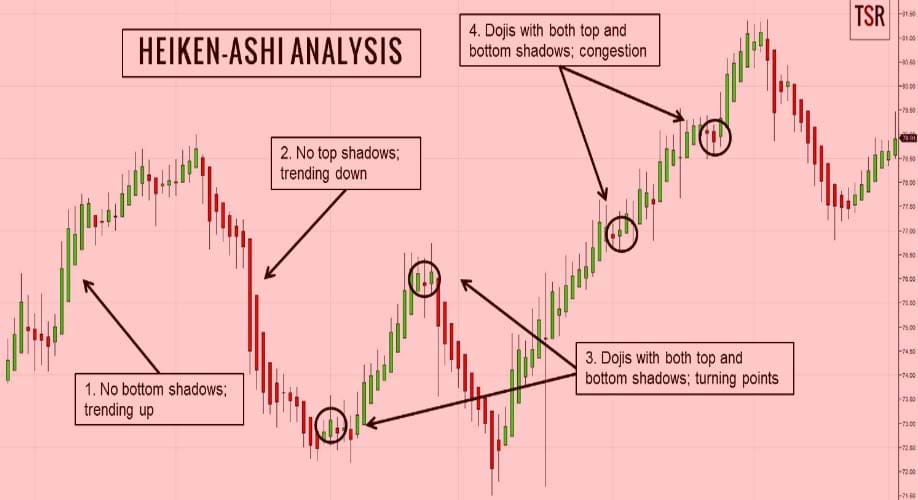
You will also see some candles with shadows on both side of them that reflects there is some confusion going on or an average price movement is currently visible in the market.
- Thirdly, a Red candlestick with no shadows on the top means the price is below the average of yesterday. A green candlestick with no shadow at the bottom shows the price is above the average of yesterday.
- If you are familiar with the candlestick chart pattern, you know that there are various types of candlesticks available in it but in Heikin, Ashi there are two types of candlesticks are there. These are Doji and Spinning Top Candle.
Doji or Spinning Top candle comes with a reverse trend in the Heikin Ashi pattern.
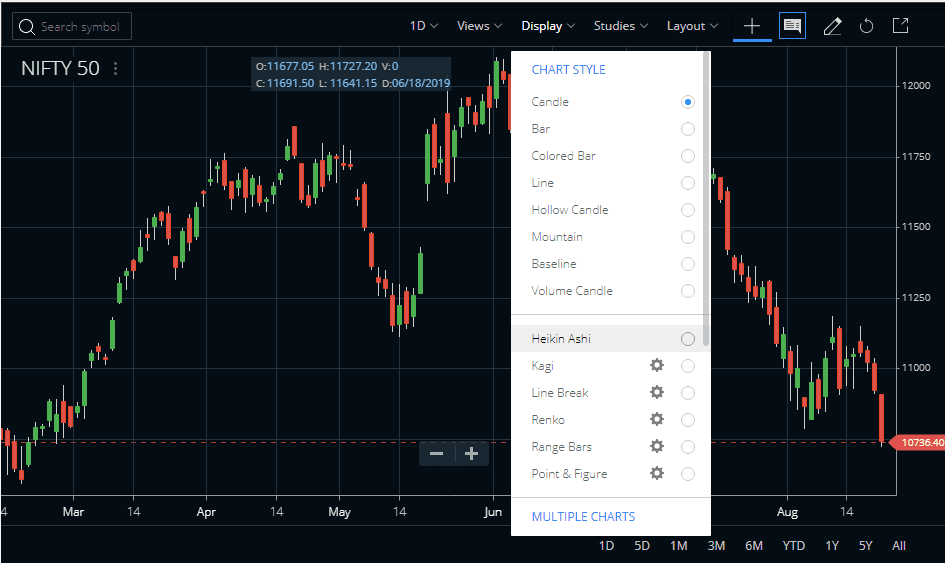
How to Attach Heikin Ashi Chart to a Symbol?
To attach HA candles to any symbol on a trading platform like Zerodha Kite, simply click on Display and select Heikin Ashi. Check the image given below.
Another Example
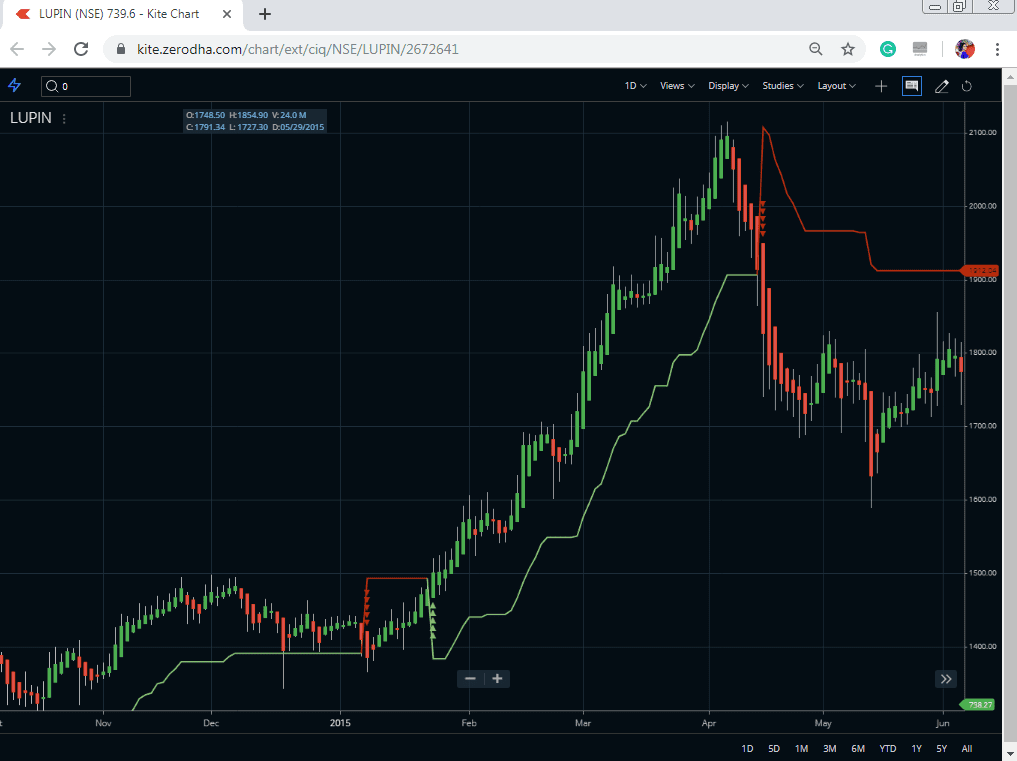
I am giving an example of Lupin Limited by applying the Heikin Ashi chart pattern. A few days back I have written a write-up on Double Bottom Pattern with an Example of Lupin. Now, I am proving the same company’s chart after applying the Heikin Ashi candlestick.
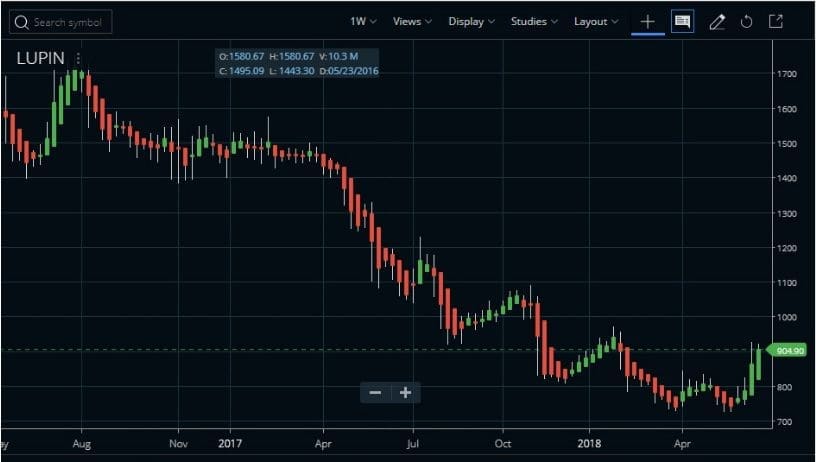
The above chart is taken from Zerodha Kite. As you can see that the last candle is a green candle and there is no shadow at the bottom of the candle which means the market is in an up-trending process right now. You can also identify some Doji and Spinning Top just before the reversal points.
Key Points of the Heikin Ashi
- Green candles along with no shadows indicate a strong uptrend.
- Green candles indicate an uptrend, here, one can add a long position and exit short positions.
- Small body Candles surrounded by upper and lower shadows. This indicates a trend change.
- Red candles indicate a downtrend. Here, one might want to add to one’s short position and exit long positions.
- Red candles with no upper or lower shadows imply a strong downtrend.
- Long down candles along with little upper shadows represent strong selling pressure and vice versa.
- A long hollow Heikin-Ashi candlestick indicates strong buying pressure over a two-day period. On the other side, the absence of a lower shadow also reflects strength.
- Small Heikin-Ashi candlesticks with long upper and lower shadows mean indecision over the last two days. This often happens when one candlestick is filled and the other is hollow.
- The Heikin-Ashi methods use a modified formula that depends on two-period averages. This provides the chart with a smoother appearance. This is making it easier to spot trends and reversals, but at the same time obscures gaps and some price data.
- One of the main advantages is that the chart is much “smoother” looking. It helps to more easily identify the trending direction.
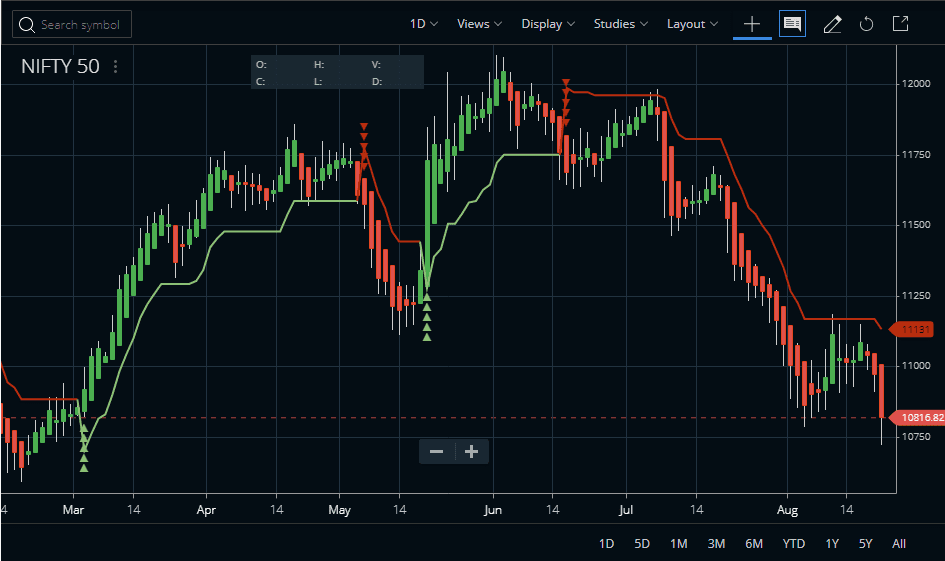
One of the most important points is if you use the Heikin Ashi Candlesticks with other indicators, the result will be more effective. Like here, I use the SuperTrend indicator to get more powerful signals. As you can see, during the buying trend, some of the HA candles appear red but as the SuperTrend (10,3) buying signal is on, it indicates an upcoming bullish market.
The Secret SuperTrend Settings
The default parameter of the SuperTrend in the Zerodha Kite is 7, 3. I have played a bit with these default settings. I doubled 7, i.e., 14 and I halved 3, i.e., 1.5. So I got a setting of 14, 1.5 in the SuperTrend indicator. I have checked this works like a charm when we use it with the Heikin Ashi chart. Check the image below.
So, in simple words, by using the Supertrend indicator, you can avoid some false signals on Heikin Ashi.
FAQ
Yes, Heikin Ashi is a trustworthy trading method with a high degree of accuracy. By smoothing out price movements and providing trend direction signals, Heikin Ashi is an easy-to-use tool to identify short-term market direction.
The Heikin Ashi 5 rule states that if five consecutive bars have the same colour (green for uptrends or red for downtrends), this indicates strong momentum in said direction and should encourage traders to enter positions accordingly.
While there’s no fixed number associated with it, research suggests that through proper analysis and use of various chart patterns—such as engulfing candles—Heiken Aishi can be profitable more often than not.
One possible issue when using heikin ashi as part of your trading strategy could be increased risk exposure due to its reliance on lagging indicators which may lead to whipsaws in choppy markets resulting in overall lower profits over time.
Conclusion
These are some of the most important points of the candlestick chart pattern. By following this, you can easily monitor the market trend without facing extra noise. One thing you must remember is that normal candlestick forms by today’s current value while the candlestick chart is based on the previous trend of the market.


