Peter Martin and Byron McCann developed the Ulcer Index Indicator in 1987. This is a volatility indicator that measures downside risk. This indicator was first introduced in 1989 in Investor’s Guide to Fidelity Funds. Basically, the index is designed with mutual funds in mind. This is why it only focuses on downside risk.
What is the Ulcer Index?
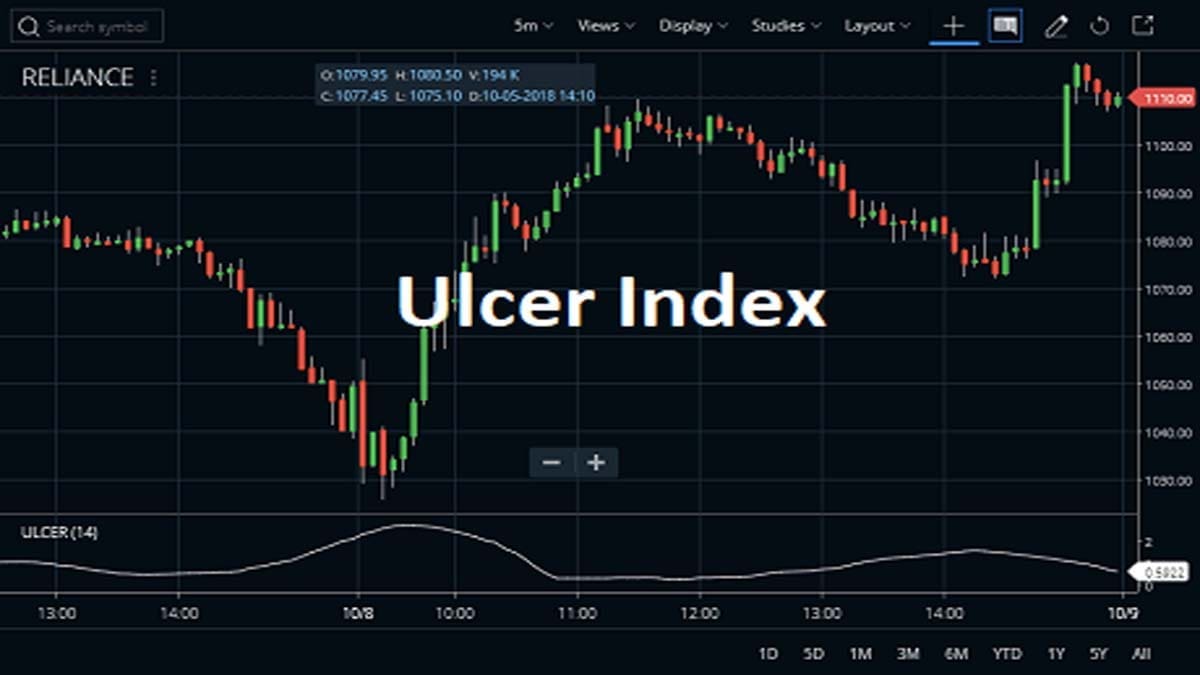
The Ulcer Index attempts to estimate the “stress” of holding an investment by estimating price retracements. The indicator is based on the notion that downward volatility is bad, but upward volatility is quite good. It increases in value as the price moves farther away from a recent high price. And also falls as the price rises to new highs. The indicator is basically calculated over a 14-day period along with the Ulcer Index.
How to Calculate the Ulcer Index?
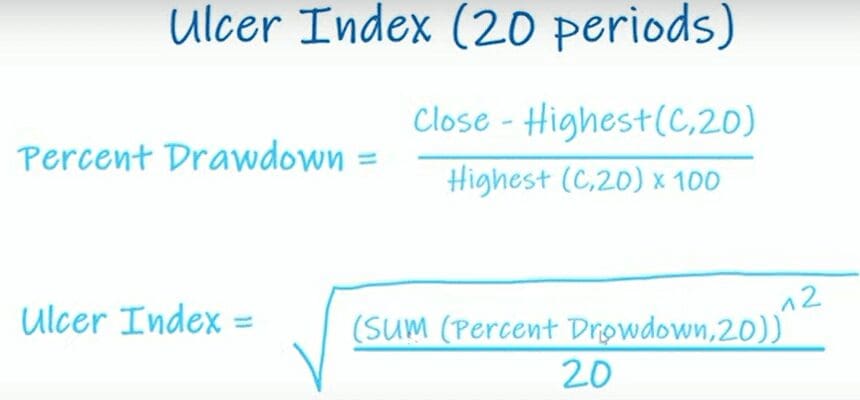
To calculate the 14-period Ulcer Index indicator, first, you need to calculate the price and Square of Price Change (C) for each period. You then take C multiplied by the period in question. This figure is added across all periods and divided by 14 to obtain your final result. The formula can be written as follows:
UI = 1/14 ∑(P x C ) where P = period number and C = square of price change from the current day to the previous day.






Similarly, you can calculate the UI for any other periods, say 20 periods as shown below.
How to Attach the Ulcer Index Indicator on Charts?
On Zerodha Kite
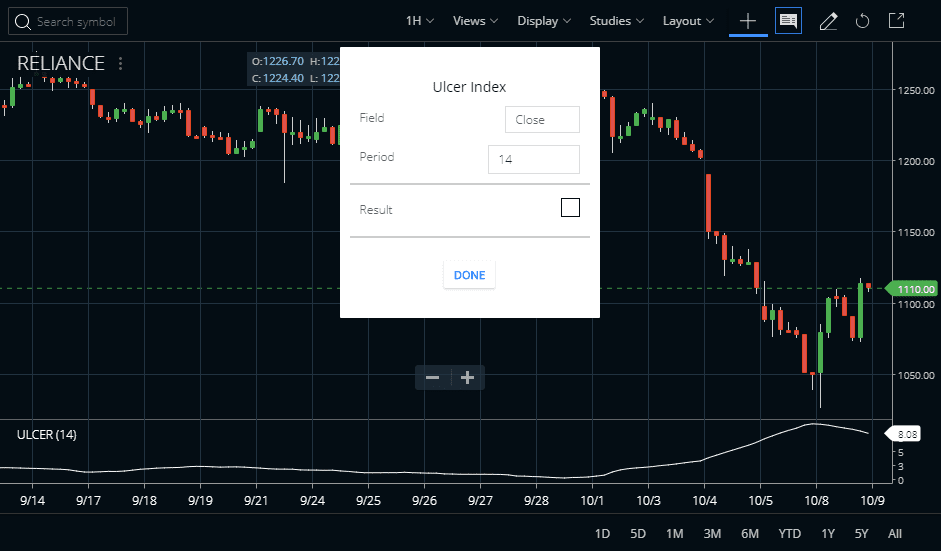
If you want to get add the Ulcer Index indicator, kindly open the STUDIES section of Zerodha Kite. This indicator is also available in Kite Mobile App. The Period is 14 and the Field is Close. If you want to change the value then change it high and low. You can also change the Field. The traders can also check the attaching process of the Ulcer Index indicator to Reliance Industries’ share price chart. And, this indicator works well on daily, weekly, monthly, or intraday charts.
On Upstox Pro
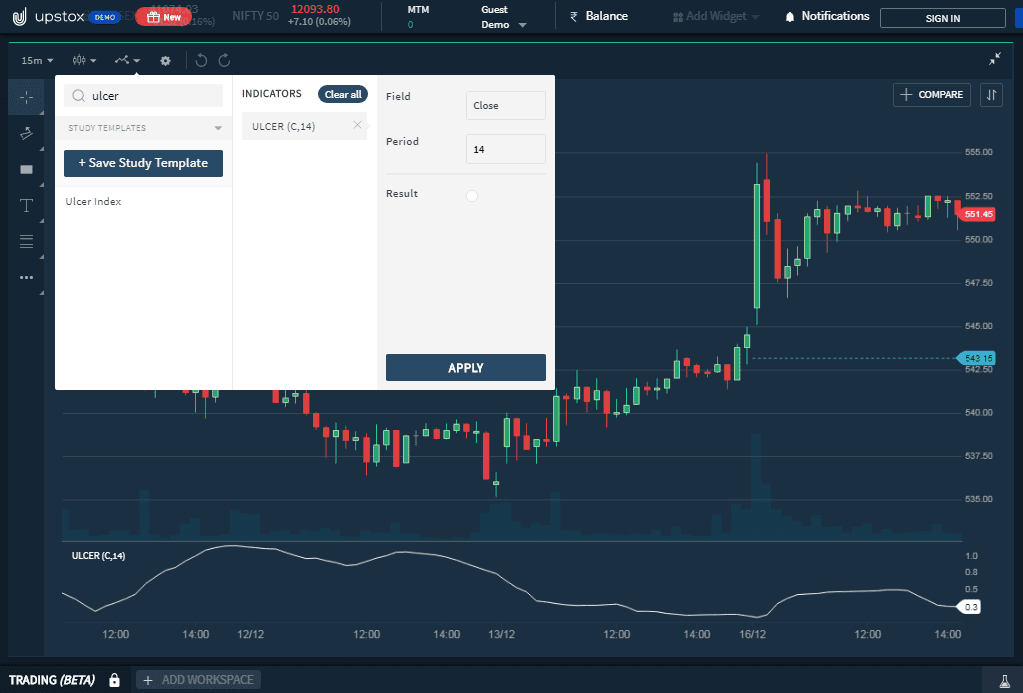
The next charting platform is Upstox Pro. Here, I added the Ulcer Index from the charting window, indicator section. There I type down the name of the indicator and after customization, I click on Apply.
Features of the Ulcer Index
The UI indicator is a technical indicator that measures downside risk, in terms of both the depth and duration of price declines. Moreover, this indicator increases the value as the price moves further away from a recent high and falls as the price rises to new highs. The indicator is usually calculated over a 14-day period. In this, with the Ulcer Index percentage drawdown, a trader can expect the high over that period.
- The developer Peter Martin recommends the indicator as a measure of risk in various contexts where the standard deviation is usually used.
- The Ulcer Index indicator shows ulcer-forming territory or compares volatility in different stocks.
- The traders can use the indicator to compare different investment options.
How to Trade the Ulcer Index Indicator?
A lower value of this indicator means lower drawdown risk compared with an investment with a higher value of the Ulcer Index (UI). Ulcer Index is a very good indicator to recognize periods with a high possibility of the market turning into a recession which is a long-rem downtrend.
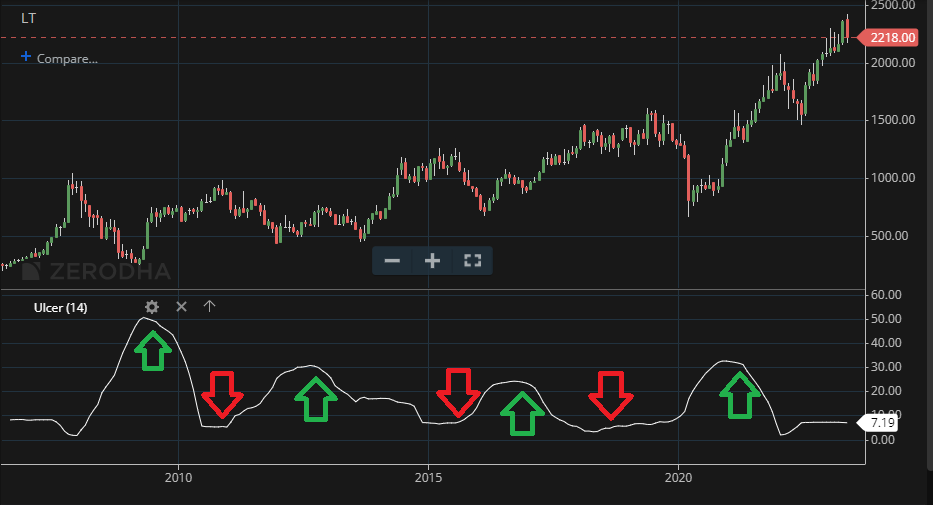
A simple trading system based on this indicator for long-term bullish traders would be staying in cash when Ulcer Index starts rising. A rising value always indicates a drawdown phase, hence the indicator is inversely proportional to price. Moreover, it defines long-term bullish traders may definitely use the Ulcer index turning down from the top as one of the signals to see long-term bullish positions. Check the image above, where we saw the recent rally in the monthly chart of Larsen & Toubro started after the UI Indicator started moving down from the top.
Conclusions
However, the indicator mainly measures risk by focusing on drawdowns represented by price declines. This indicator is best for long-only investors or traders. The UI indicator hovers near zero when prices regularly record higher highs and advance. The indicator rises when prices move to a lower extent from their recent high. This Ulcer Index indicator can just measure the downside risk that traders can use to compute risk-adjusted returns. In addition, it mainly measures the human stress of holding a stock. This is a volatility measure that only captures continuous downside movements in share price, and ignores upside volatility.