As the name implies, the Detrended Price Oscillator (DPO) attempts to eliminate the trends in price through the plotting chart. DPO is based on the fundamental idea that long-term price cycles are made up of short-term cycles. Identifying these short-term components of long-term cycles will be able to help us in finding the major turning points in long-term cycles.
The DPO helps to remove the longer trend from prices. Thus when the long-term trend is removed from price, overbought/ oversold zones in the short term are readily recognizable. DPO can identify the highs and lows and identifies market cycles. You can get this indicator in Zerodha Kite and a few other broker’s terminals like Upstox Pro etc.
The Detrended Price Oscillator formula
The formula of this indicator is Price (X/2 + 1) periods ago minus the X-periods simple moving average.
How to Attach the Detrended Price Oscillator on the Charts?
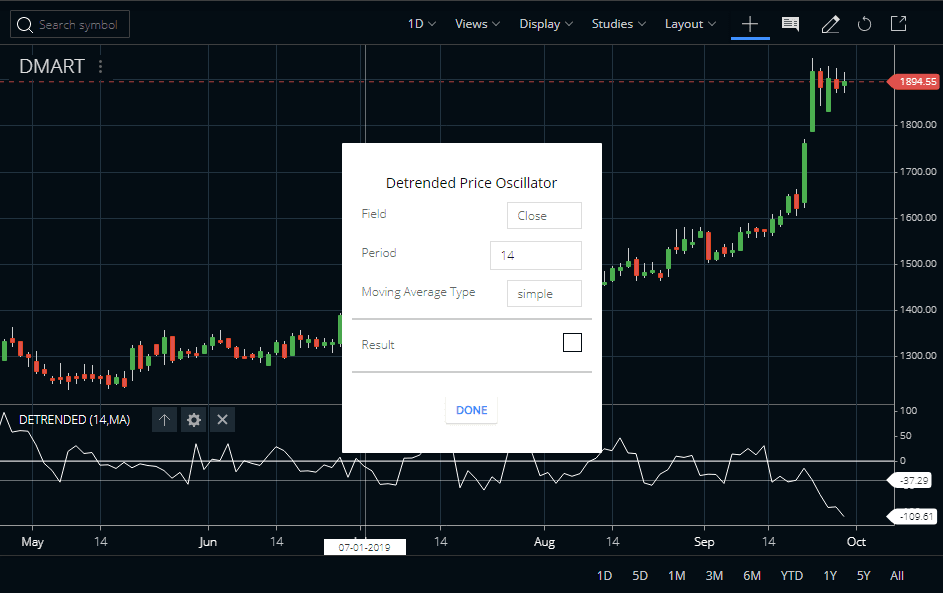
- In Zerodha Kite, you can attach the DPO indicator in a chart from the Studies section. In the Studies section you will find it in the name of Detrended Price Oscillator.
- Once you attach the indicator to the charts, you can see the default parameters.
- By default, DPO uses a 14-period for the calculations which can be customized. The default moving average setting is simple, but you can also change it to exponential, time series, triangular, variable, vidya, weighted, welles wilder, hull, etc. The default field is close, but once again you can customize it too. Instead of close, you can use open, high, low, hl/2, hlc/3, and ohlc/4.
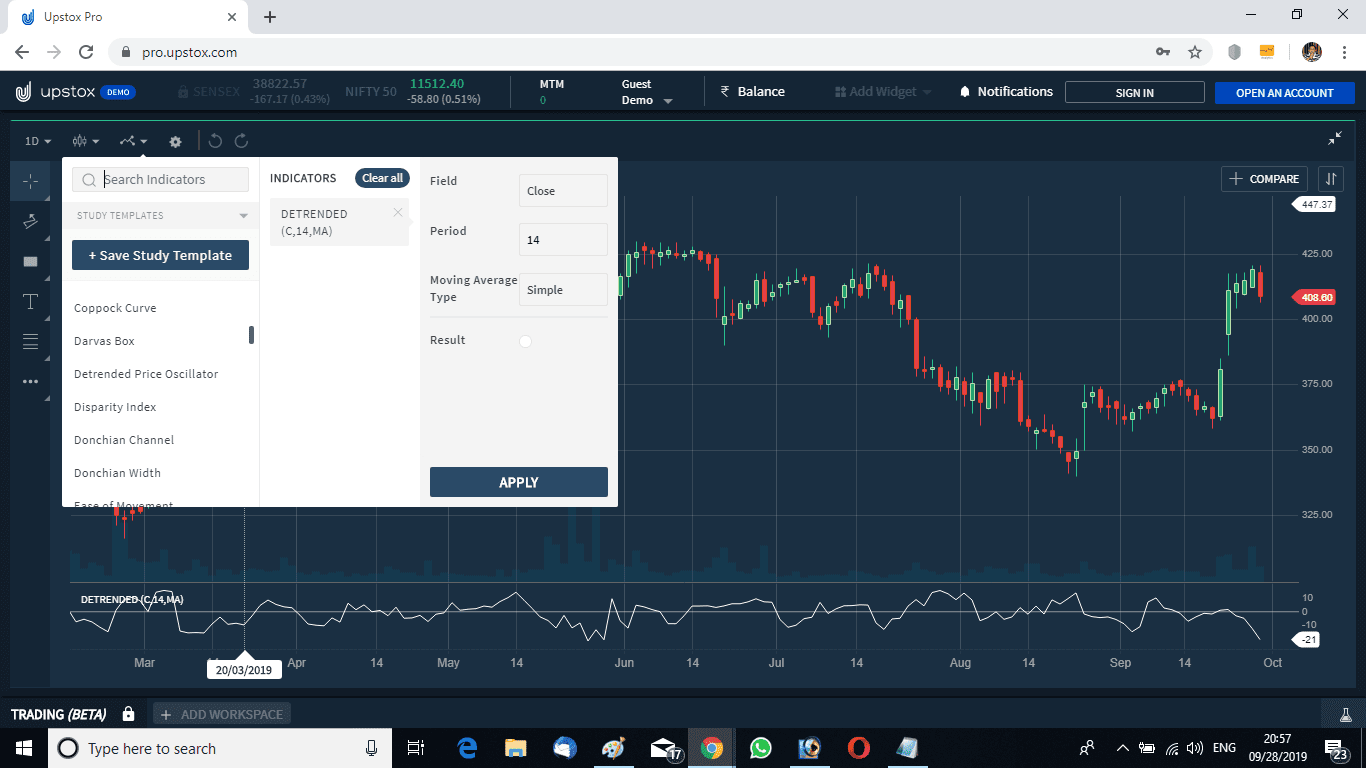
You can use similar settings when you attach this Detrended Price Oscillator to the Upstox Pro terminal.


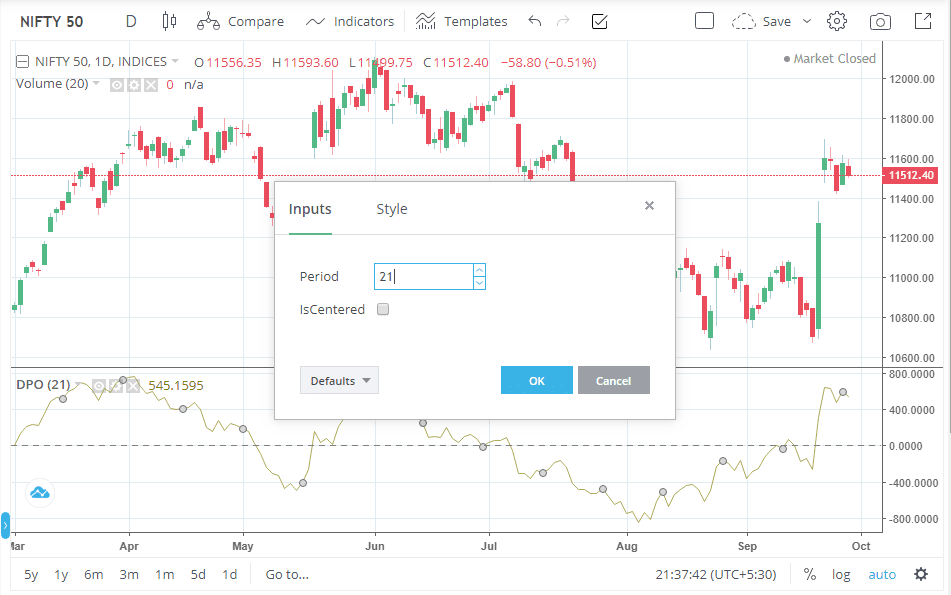
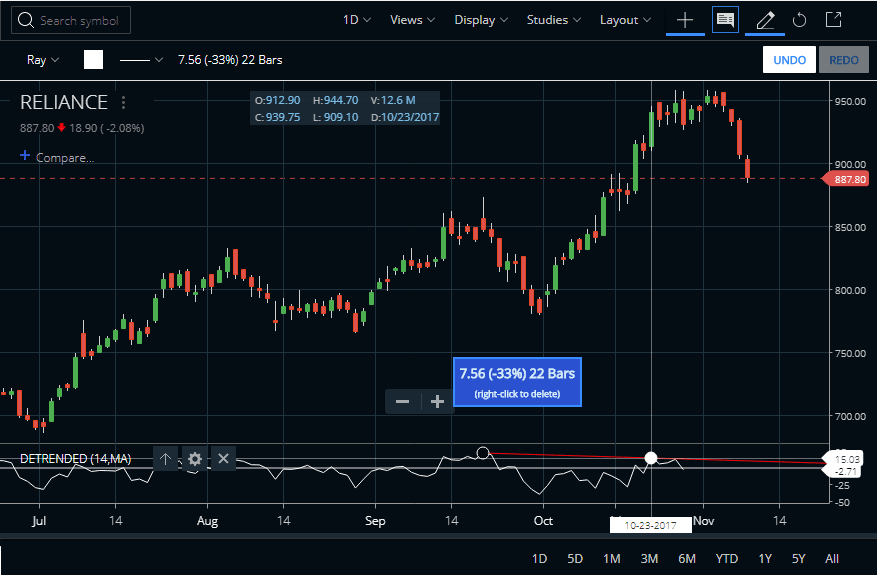
One drawback in the Zerodha charts is that I do not find the DPO in ChartIQ as good as we expect. For trading this indicator I personally like either the Investing.com or the TradingView charts. So for Zerodha traders, I suggest switching to TradingView charts and attaching the indicator to them. In TradingView the default period is 21. Check the image below.
How do you use a Detrended Price Oscillator?
- This indicator can’t identify the trend.
- The tops and bottoms of the indicator are considered as the price cycle length.
- This indicator actually filters out the long-term trends. This helps in identifying short-term cycles easily.
- The DPO is an oscillator, so it oscillates around a level (here a zero line). But this generally does not have a defined upper or lower level.
DPO zero line cross
There are 2 main methods to use this technical indicator. The first is to watch the DPO line crossing above or below the zero line. Upward movement is anticipated when the Detrended Price Oscillator indicator crosses above zero and download movement is anticipated when the DPO crosses below zero.
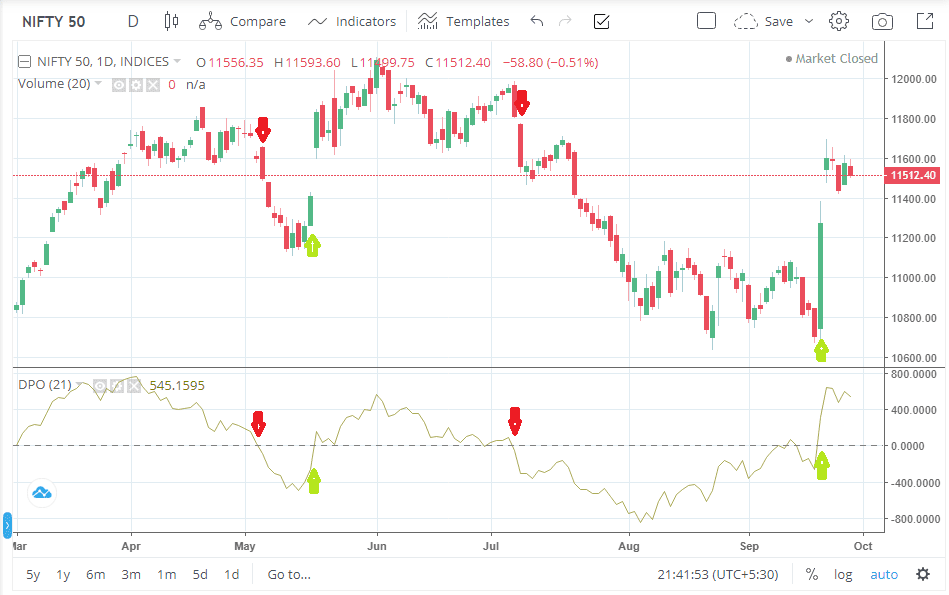
Check the above image where we can see that decent signals can be generated using the DPO zero line crossover. However, this is a very basic strategy and can give frequent whipsaws. If you are trading this method you need to keep proper stop loss and a relevant target.
Predicting peaks and troughs with the DPO
Another way of using this indicator is to use it as a predictive tool to measure the length of a trend cycle. This is done by measuring the distance between the peaks and troughs of the indicator and predicting the peaks and troughs in price. An example is that sometimes it’s seen say a stock shows its trough every 20 days or every 18 days. So after every 20 days or 18 days, we can assume that the indicator has reached its trough and can turn up. This helps a lot in predicting the market cycle.
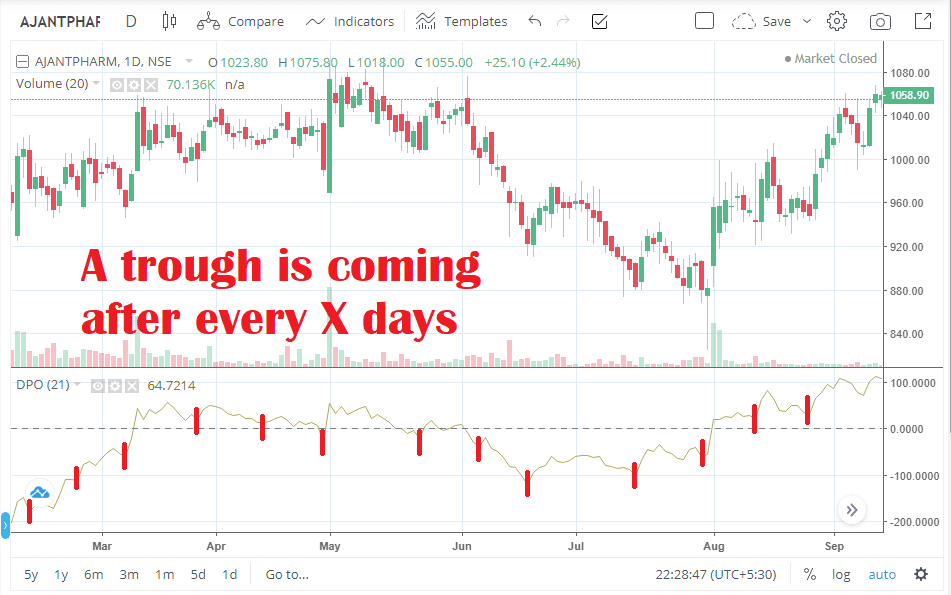
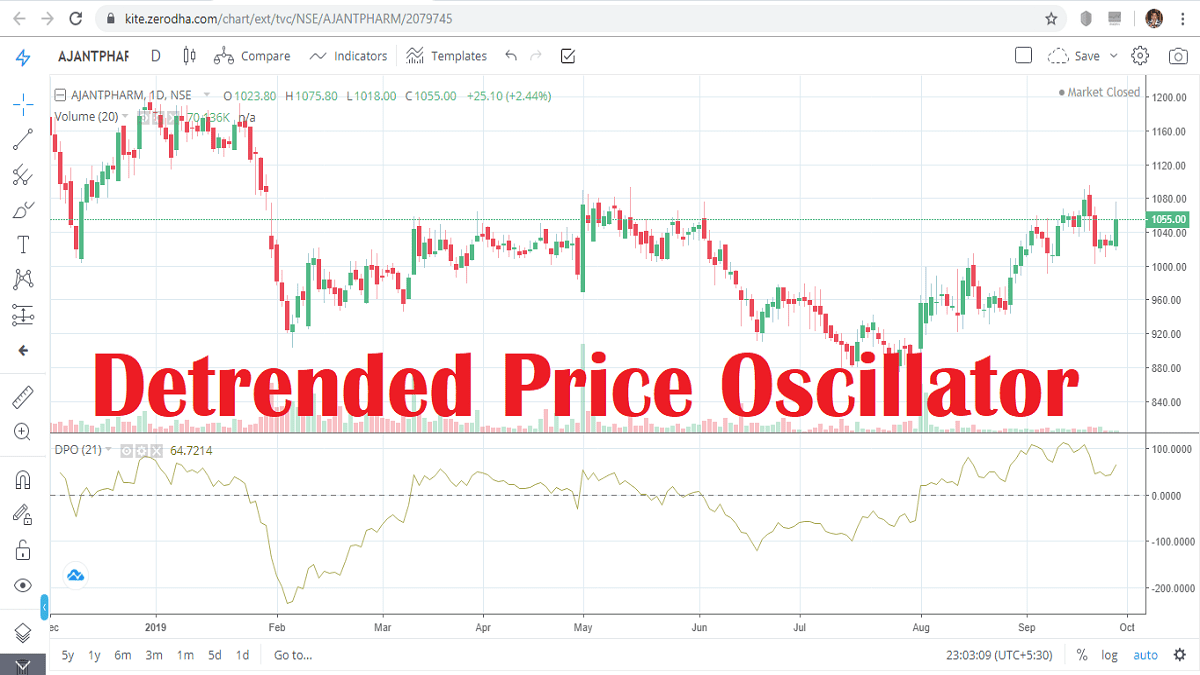
The DPO indicator creates peaks and troughs in consistent intervals and that is a very easy way to predict the exact turning point in the market. Check in the image above in Ajanta Pharma share the DPO indicator needed approximately 10 bars to create consecutive troughs. This can give an idea of when the price can change direction.
Divergence in the DPO
The Detrended Price Oscillator can also show divergence between the price and the indicator. Sometimes the price moves on rising but the indicator does not rise. This is a negative divergence and the price can change its direction from up to down. Similarly, sometimes the price continues falling but the indicator does not fall. This is a positive divergence and indicates that the market can bounce back. Check the image below.
FAQ
The detrended price oscillator (DPO) is a technical analysis indicator that helps identify cycles in the asset’s price. To use it, you must first choose a lookback period for the window of time that DPO will measure. Usually, this lookback period can range from 14 days to 50 days depending on preferences and data available.
There is no one-size-fits-all when it comes to setting the best-detrended price oscillator periods as each investor has different strategies, investment goals, and market conditions they are trading in. Therefore, investors should experiment with different settings until they find one that gives them better signals than their current strategy.
The detrended price oscillator (DPO) is a momentum-based indicator used to isolate short-term trend cycles from long-term trends as it eliminates large fluctuations of prices over certain long periods of time or shifts in investment sentiment.
Dr. Alan Hull created the Detrended Price Oscillator (DPO) sometime during the late 90s and was popularized by Wilder’s book ‘New Concepts And Trading System’ published back in the year 2000 which explains various indicators including DPO along with its usage methodology clearly explained with examples backed up with historical evidence and data points he formed pattern recognition theory & cyclic theories while working near London commodities exchange earlier 1986/1987.
Conclusion
The Detrended Price Oscillator is neither a momentum indicator nor a trend indicator. Rather it shows the peaks and troughs on the chart. As this is not a trend indicator it is hard to get a buy-sell signal based on this indicator alone. But if we know the current trend of the market we can use this indicator for timing our entries. In the Indian charting software, TradingView shows a reliable DPO.
")

