
A few days back, I wrote a post on getting market feeds from Sharekhan TradeTiger to Excel, which received a great response from my readers. Since then, I have received numerous requests from my Zerodha clients on how to create a similar Excel trading system by connecting Zerodha Pi to Excel. In this post, I will explain the steps you need to follow to build an Excel trading system by connecting Zerodha Pi to Excel.
Logging in to Zerodha Pi Terminal
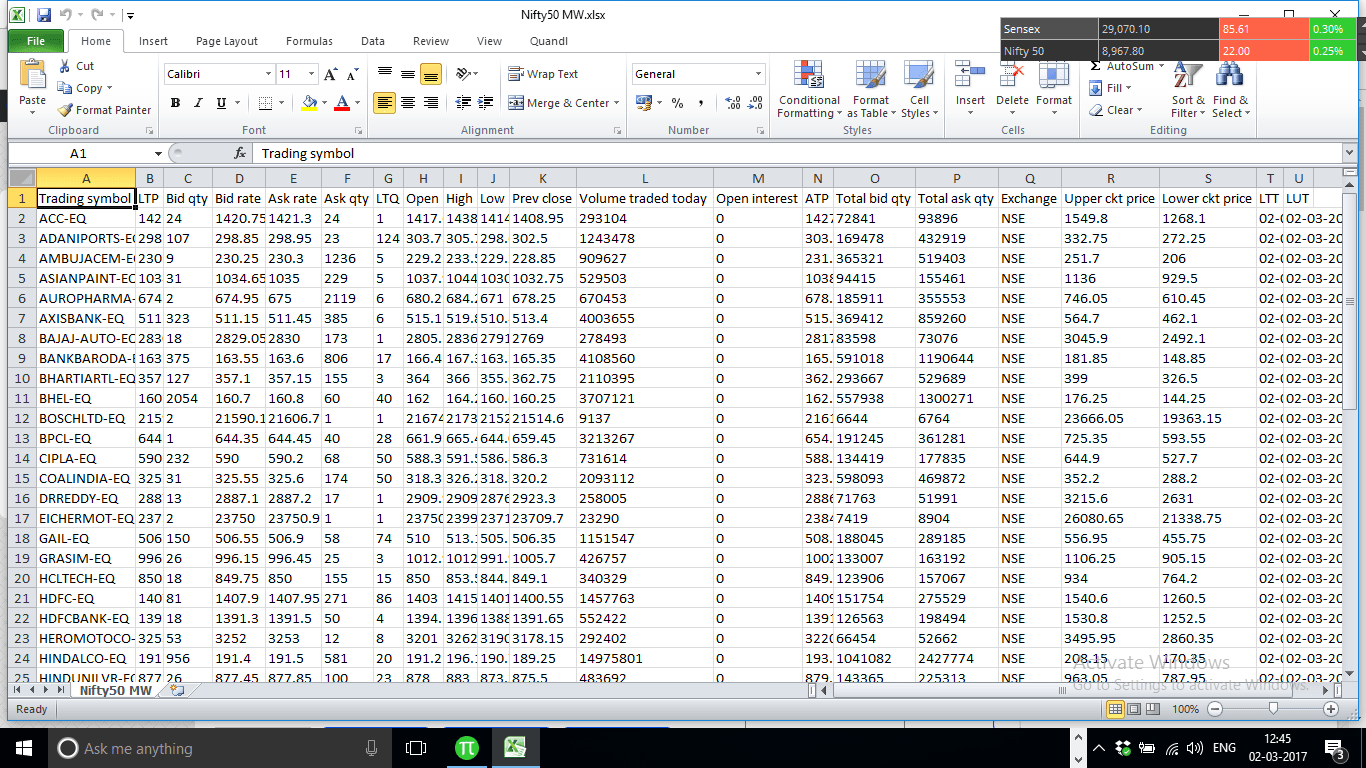
Firstly, log in to your Zerodha Pi terminal. Once Pi is logged in, open the Nifty50 all scrips market watch by clicking File –> Predefined Workspace –> NSE –> Nifty 50. This will load all Nifty50 stocks in your MarketWatch.
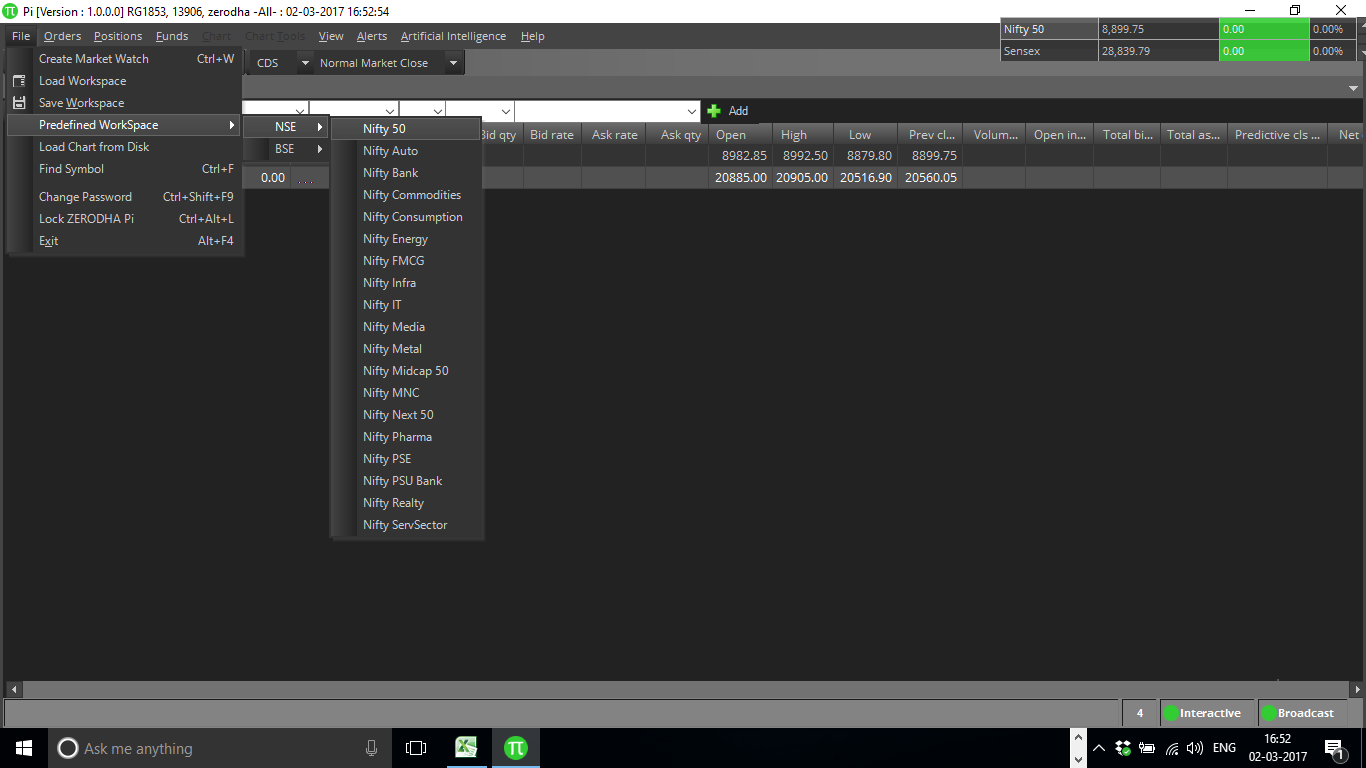
My Nifty50 MW (my given name for this MarketWatch) is open. Now, the MarketWatch needs to be sorted by symbol name. Therefore, please click on the Trading Symbol column header to sort it alphabetically.
Linking Zerodha Pi to Excel
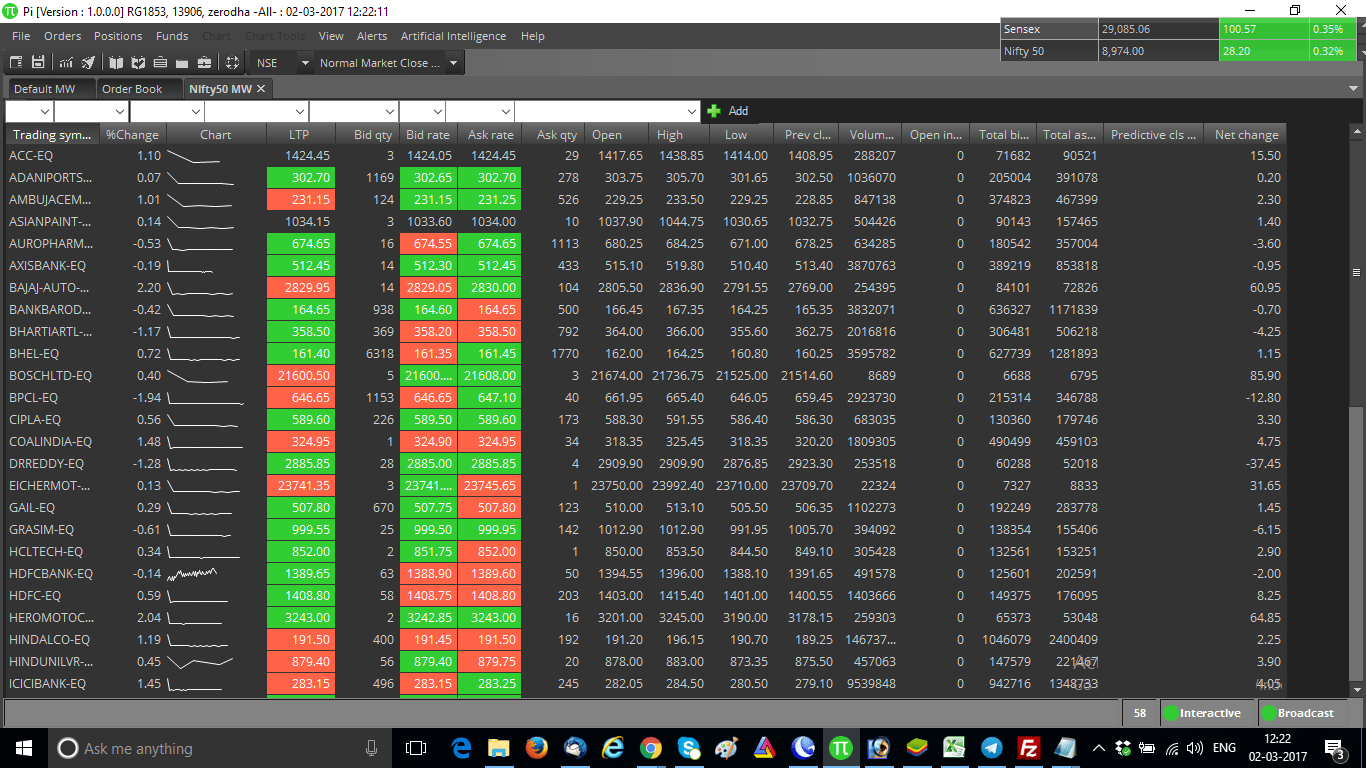
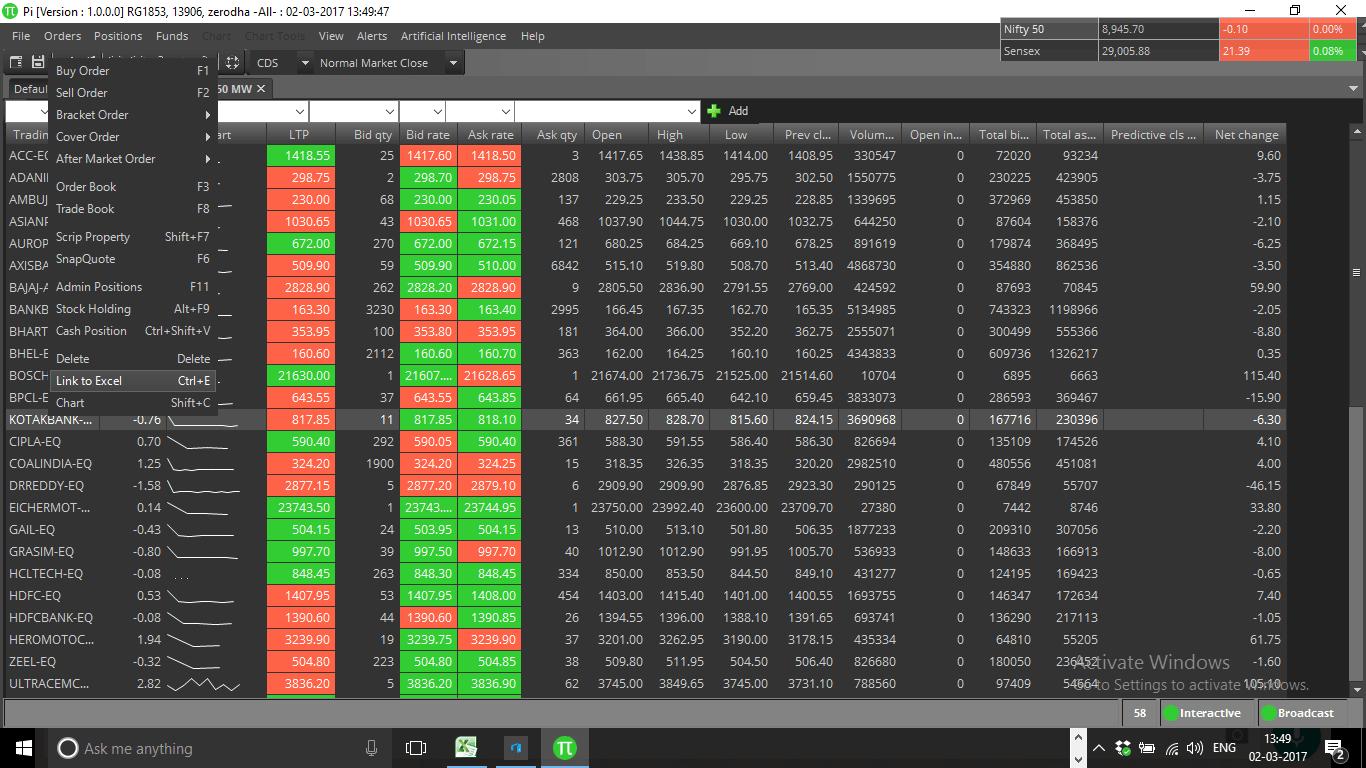
Now, right-click on the market watch and click LINK TO EXCEL (Ctrl+E). This will connect Zerodha Pi to excel and save the market watch data in an excel sheet to the location \Zerodha\Pi\LinkExcel\Nifty50 MW.xlsx.
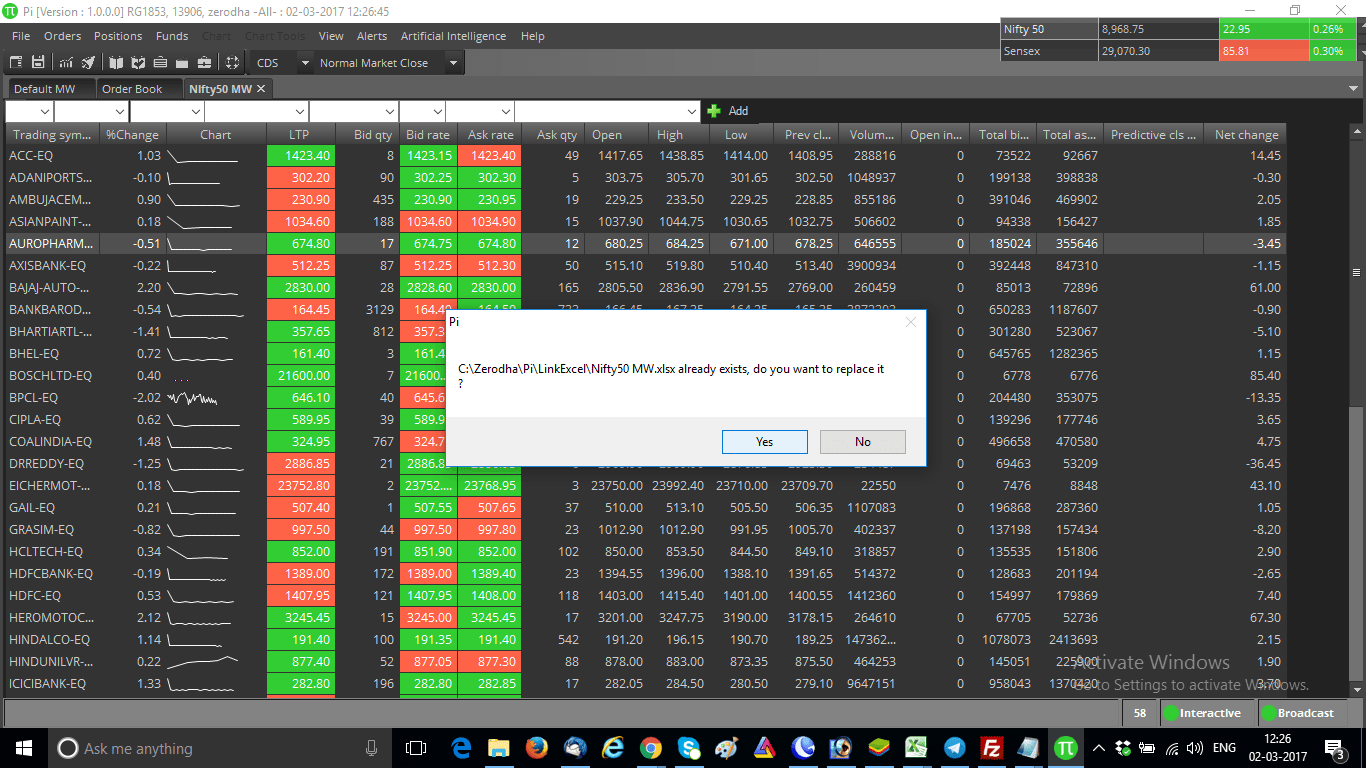
If you have already saved Excel in that location, for second-time use or recurring use, it will ask you to replace the Excel file.
Now the Excel file will automatically open. It will contain only 1 sheet called Nifty50 MW (the same name as MarketWatch). In case the market is open, the live price will start changing in Excel.
Creating a New Sheet and Writing Formulas
Now we will create another sheet and write formulas there. Let’s work on the same formula Open High Low Same Trading Strategy For Indian Stock Market. To build our Excel trading system, let’s create 2 columns in sheet2 called Open=Low and Open=High.
The formula for the Open=Low column 2nd row is:
=IF(‘Nifty50 MW’!H2=’Nifty50 MW’!J2,”BUY”,””)


The formula for the Open=High column 2nd row is:
=IF(‘Nifty50 MW’!H2=’Nifty50 MW’!I2,”SELL”,””)
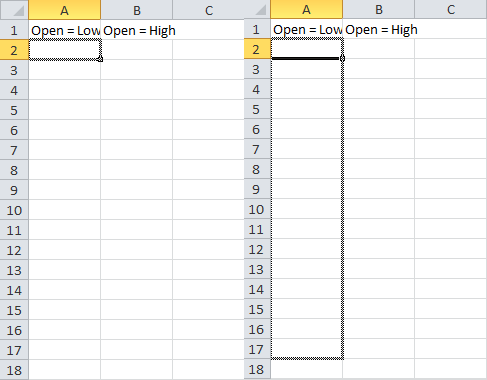
Now select row A2 and hold the extreme right bottom corner of the cell and drag below through the entire column. It will copy the formula in the rows below. Similarly, repeat the step for the B2 column too.
Setting up Targets and Stop Losses to create an Excel Trading System
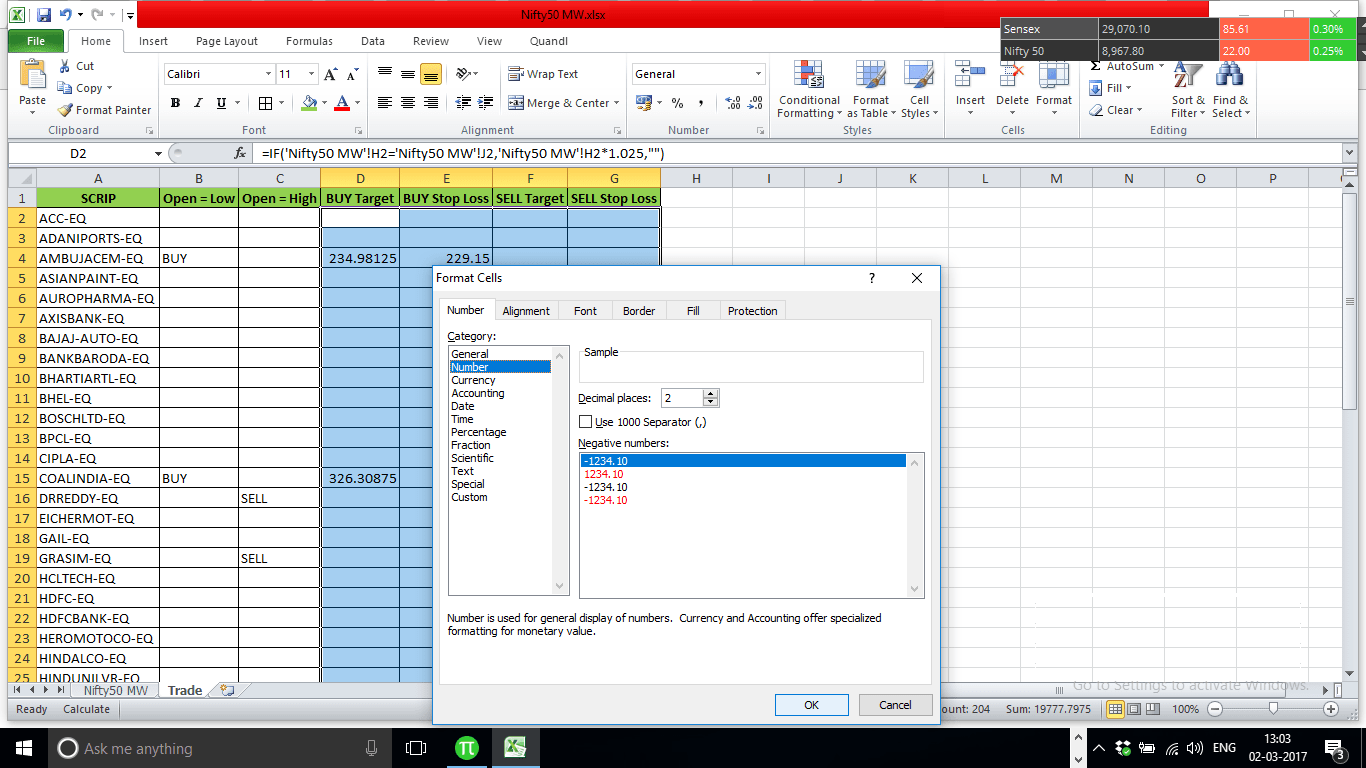
So in the Excel trading system, now we get BUY or SELL scrips. Today (2nd March 2017), I have got AMBUJACEM, COALINDIA, AND ULTRACEMCO as BUY and got DRREDDY, GRASIM, INDUSINDBK, NTPC, and POWERGRID as selling.
I have added a 2.5% target and set up a stop loss 2 ticks below the day’s low for BUY and 2 ticks above the day’s high for the day low.
Formatting the Excel Cells
I will round the targets and stop loss to 2 decimal places by formatting the Excel cells as shown below.
Renaming the Sheet and Decorating it
Finally, I have decorated the sheet a bit and renamed Sheet 2 as Trade.
Downloading and Saving the Excel Sheet
Download the Excel Sheet
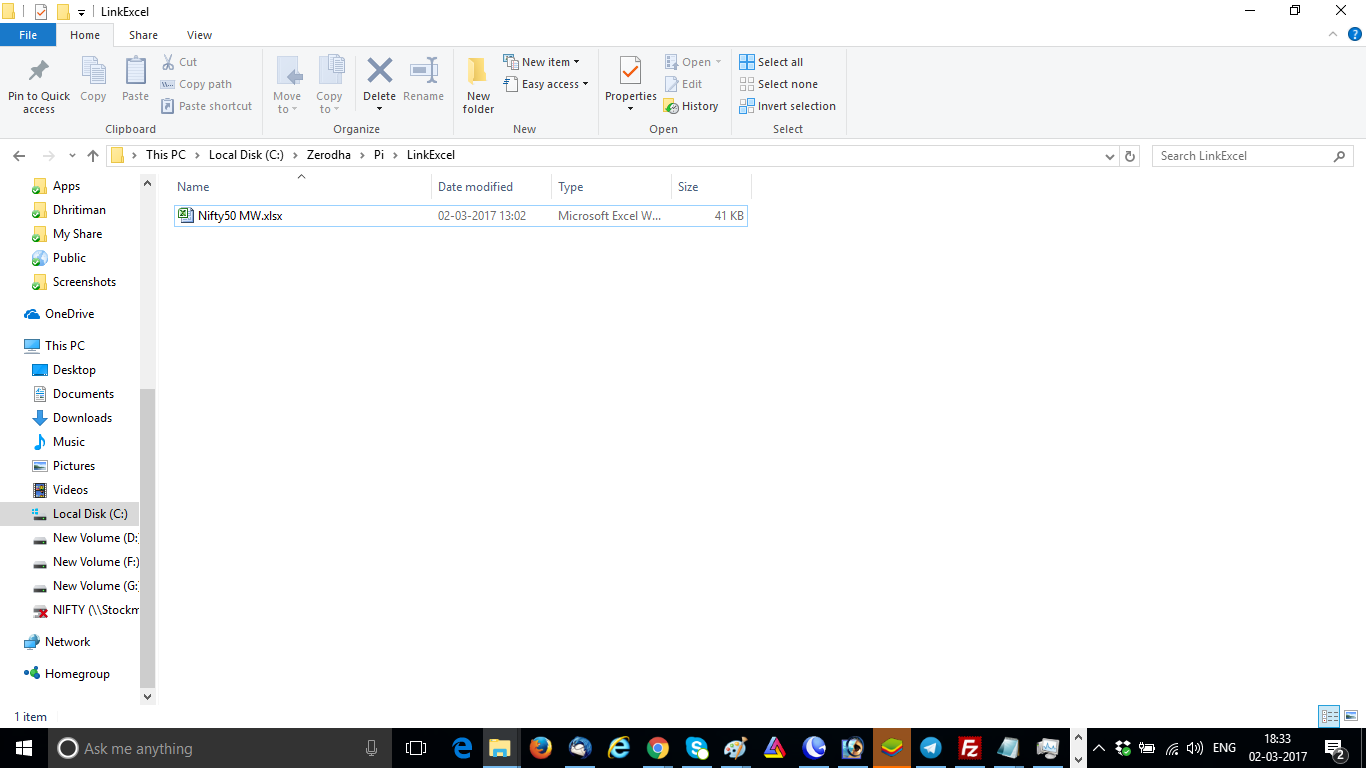
Last but not the least, if you are unable to connect Zerodha Pi to Excel yourself, you can download my Excel sheet from here.
Save the Excel Sheet
Once you have downloaded the Excel sheet, save it to your /Zerodha/Pi/LinkExcel folder.
Check this youtube video for the whole process of data import:
Using the Excel Sheet for other Trading Strategies
You can use the Excel sheet for creating other buy/sell logics too. Simply modify the formulas in the sheet according to your preferred trading strategy. The formulas can be modified to accommodate different parameters such as time frames, indicators, and patterns.
Modern Ways to Get Zerodha live data in Excel
Zerodha, one of the leading discount brokers in India, provides multiple ways to extract data from its trading platforms. As they stopped access to Pi, the other way is to use Zerodha’s Kite Connect API to access live market data, order placement, and more. You can use popular programming languages like Python using the Pycharm platform to connect to the Kite Connect API and extract data from it. However, this approach is suitable for traders and investors who want to build custom trading strategies and perform advanced analysis.
FAQs on Zerodha Pi to Excel
Zerodha Pi was a popular desktop trading platform that allowed traders to place orders, view real-time market data, and access historical data. However, Zerodha has stopped supporting Pi, and it has been replaced by Kite. Kite is a web-based trading platform that offers similar features to Pi, but it is accessible from any device with an internet connection. Alternatively, traders can use third-party tools like AmiBroker, MetaTrader, and TradingView to analyze market data and place trades.
Yes, Excel can be used for trading. Excel provides powerful data analysis and visualization tools that can help traders make informed decisions. Traders can use Excel to import real-time market data, create custom indicators, and develop trading strategies. Additionally, Excel can be used to manage trades, track performance, and generate reports.
To make a trading system in Excel, you need to follow these steps:
Import market data into Excel using a data source like Zerodha Pi or Kite Connect API. Create custom indicators using Excel formulas or VBA macros. Develop trading strategies based on the indicators and market data. Implement the strategies using Excel functions or VBA code. Test and optimize the strategies using historical data. Monitor the strategies in real time and make adjustments as necessary.
To create an automated trading system in Excel, you need to follow these steps:
Import real-time market data into Excel using a data source like Kite Connect API. Create custom indicators using Excel formulas or VBA macros. Develop trading rules and logic based on the indicators and market data. Implement the rules and logic using Excel functions or VBA code. Automate the system using Excel’s built-in automation features or VBA macros. Test and optimize the system using historical data. Deploy the system in a live trading environment and monitor it for performance and stability.
Conclusion and Alternative Methods
In conclusion, creating an Excel trading system connecting Zerodha Pi to Excel is a great way to get live market data and automate your trading strategies. However, since Zerodha Pi is no longer supported, this process is no longer viable.
An alternative method to get live market data is to use Python and Pycharm to populate live stock market data into Excel. This is a more advanced method and requires some programming knowledge, but it is a viable solution for those looking to automate their trading strategies. There are many online resources available to learn Python and Pycharm, and there are also many pre-built libraries and APIs that can be used to retrieve live market data.


Thanks a million for the email regarding excel sheet i’ll try it out.I request you to do some research regarding Darvas box which is there in Pi chart settings.
Ok Avinash, definitely will try to check Darvas Box in Zerodha Pi.
Hello Indrajit,
How can we keep the Trading calls generated from the open=low/open=high system constant till the end of the day in excel sheet?
Kaushal, they will remain constant unless and until the high / low gets breached. To keep it same throughout the day you need to simply close the market watch OR Pi. This will stop Link To Excel command.
Hi Indrajit, can you help in creating a strategy based on Supertrend for scanner on Pi?
Hello, Good Work –
Abhijit thank you.
Sir can you please make same excel fo BANKNIFTY also.
Anup if BANKNIFTY is in your market watch you can also get its levels. You can check this post meant for Bank Nifty traders: Bank Nifty Open Interest – Follow The Smart Traders
Thanks
can we place order from excel itself
Chandra Mohan yes you can place order from excel itself. For that you need to write your buy sell code in excel and connect excel to Pi with Pi Trading Bridge.
Thanks Indrajit for quick reply. can you please help in writing buy sell code for open=low and for open=high. thanks again
Chandra I am sorry, my knowledge is limited till manual trading and code writing for manual trading. For automation you may visit this page: Algo Trading. Saurabh the master trainer can train you on automation.
Brilliant……Excellent tricks in details. Thank you.
Jyotirmoy, hope it will help traders.
Sir I am using Excel 2016 32bit & my OS is Windows 10 but I am not able connect Pi to Excel only I am getting (NA)
Soumendra, make sure you have named your excel file exactly the same name as MarketWatch.
Yes sir one is Default and other is Nifty 50 but when I am connecting the excel file opening automatically with the marketwatch name and the content is NA
Can you please watch this video to get an idea?
Sir for amibroker (above mentioned link) the excel file is generated in exported folder this is fine but from LinkExcel file the price is not coming all the cells are marked .NA. Is there any extra configuration required ?
same here. Did you find a solution?
Sir,
Is it possible to export data from excel sheet back to Zerodha PI ?
No, if you want to export data from MS Excel to a charting software, you can use Amibroker.
Hi Indrajit,
Thanks for such a detailed description.
I would like to get the buy/sell signals created in Zerodha Pi Expert Advisor into MsExcel.
Could you please let me know how to do it.
Thanks,
Shweta
can we save hourly Data in separate Sheet ?…from input, live intraday Data (From Pi).
Craig yes you can. Import the data from an hourly chart.
Hello sir,
Thank you for this wonderful post but i have a small problem which time frames high or low you prefer i.e. we came to know if open and high of first candle is same the we should sell and vice versa for buy but problem is which time frames candle we have to choose.
And one more information is i want to export data from pi to excel but i want only 1st 15min candles data how to restrict this sir?
Thank you in advance.
i am trying to link excel but i get all NA values how to resolve this please help me
I feel your excel file is not having the same name of your market watch.
Wonderful Indrajit.
Exactly what I was looking for.
Can you make a excel sheet that scan stocks that going up with increase volume and going down with increase volume ?
Wel Kehal will try to post on this topic.
Excel file is showing NA values. MArketwatch name is same although. Pl guide
Make sure you have saved the excel to your /Zerodha/Pi/LinkExcel folder.
showing NA after linking, name is same as market watch . location is also same.
Pradeep, watch this video. This might help.
I am also getting the same error. Can you please guide?
Can you watch the youtube video for a step by step guide?
I am at Pune, your representative is available at PUNE? at present my DEMAT with sharekhan portfolio 8lakhs
I was looking for something like that and found very awesome.
However, I was trying to figure out the formula to get the high and low of first 15 minutes or opening range.
Can you please help me to get that.
Sir when linking to excel…only NA coming… file name same.. location same as u guided still NA coming..no price or script showing…… is this the problem of excel bits?? 32 bit or 64 bit excel sheet is required for this purpose?? Plzz help
Mayank, I use 32-bit Excel. I have office 2010. You can try my settings. But I feel even 64 bit should work.
how to get weekly data from pi to excel?…like weekly hig,low open
For that open a weekly chart, right-click and save the chart data as excel.
I installed 32 bit Excel 2016…still showing error.. please help if you have other solution
Not able to link excel. Every time i link excel and it opens, then closes on its own. Some HRESULT error shows up. Kindly help.
Try installing Excel 2007 32 bit.
Hi, Mr. Indrajit,
Nice n intersting thread.
Is it possible to import data from Scanner tabs to Excel?
Appreciate.
ive saved on same name but still i get NA in all colums, im using 64bit win10
Use excel 2007 and 32 bit.
He INDRAJIT, awesome 🙂
Welcome 🙂
what should be entry point
Can enter after 5 minutes of trade.