In this post, I will show you how you can create a highly accurate intraday trading Excel sheet from the Sharekhan TradeTiger terminal. TradeTiger is Sharekhan’s desktop trading app. We will first download live data in Excel from the Sharekhan Trade Tiger terminal and later we will apply a formula for the intraday trading system on the live data. Let me do it step by step.
Downloading Live Data from Sharekhan TradeTiger
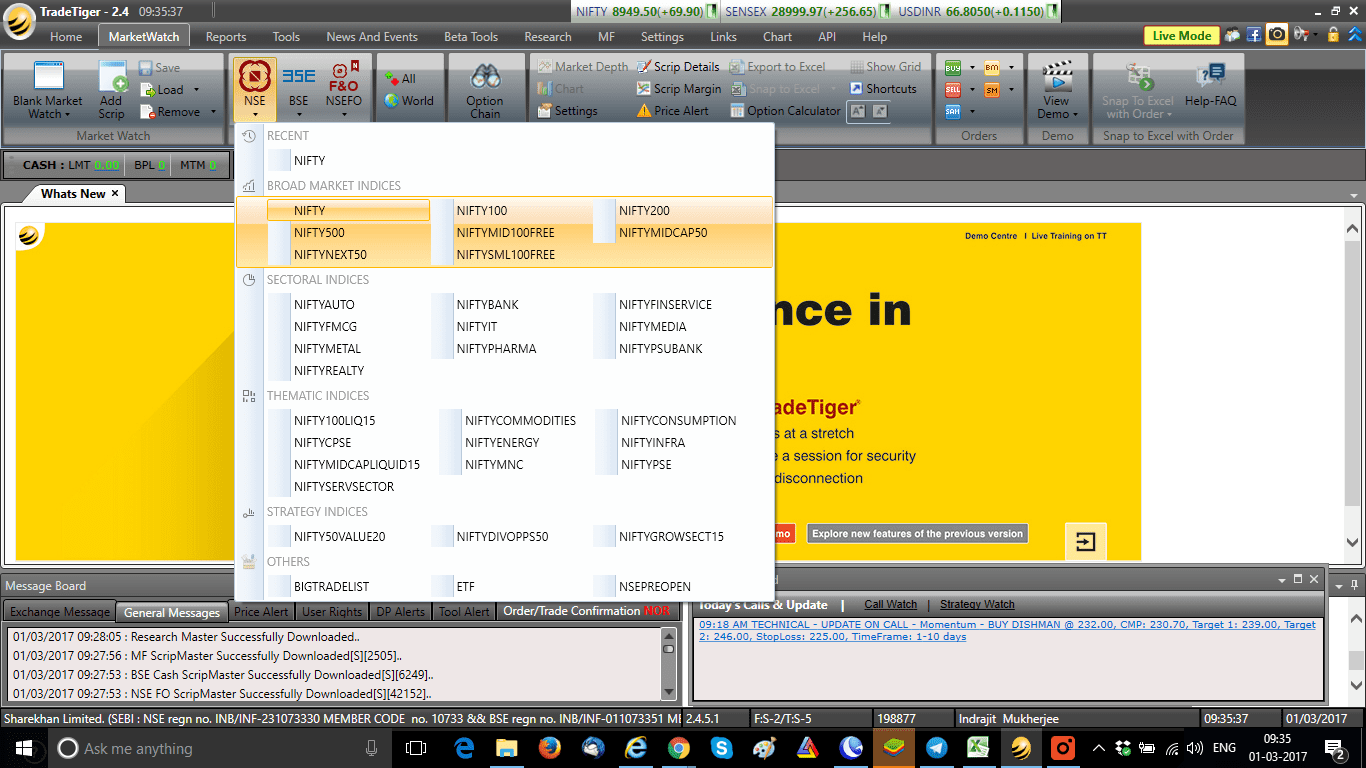
To get started, you must have the broker’s terminal installed into your system. First, log in to the Sharekhan TradeTiger terminal and open your market watch. Here, we will open a predefined NSE Nifty50 market watch to get live data of all Nifty50 stocks data in Excel. Follow the steps provided in the screenshot to open the market watch.
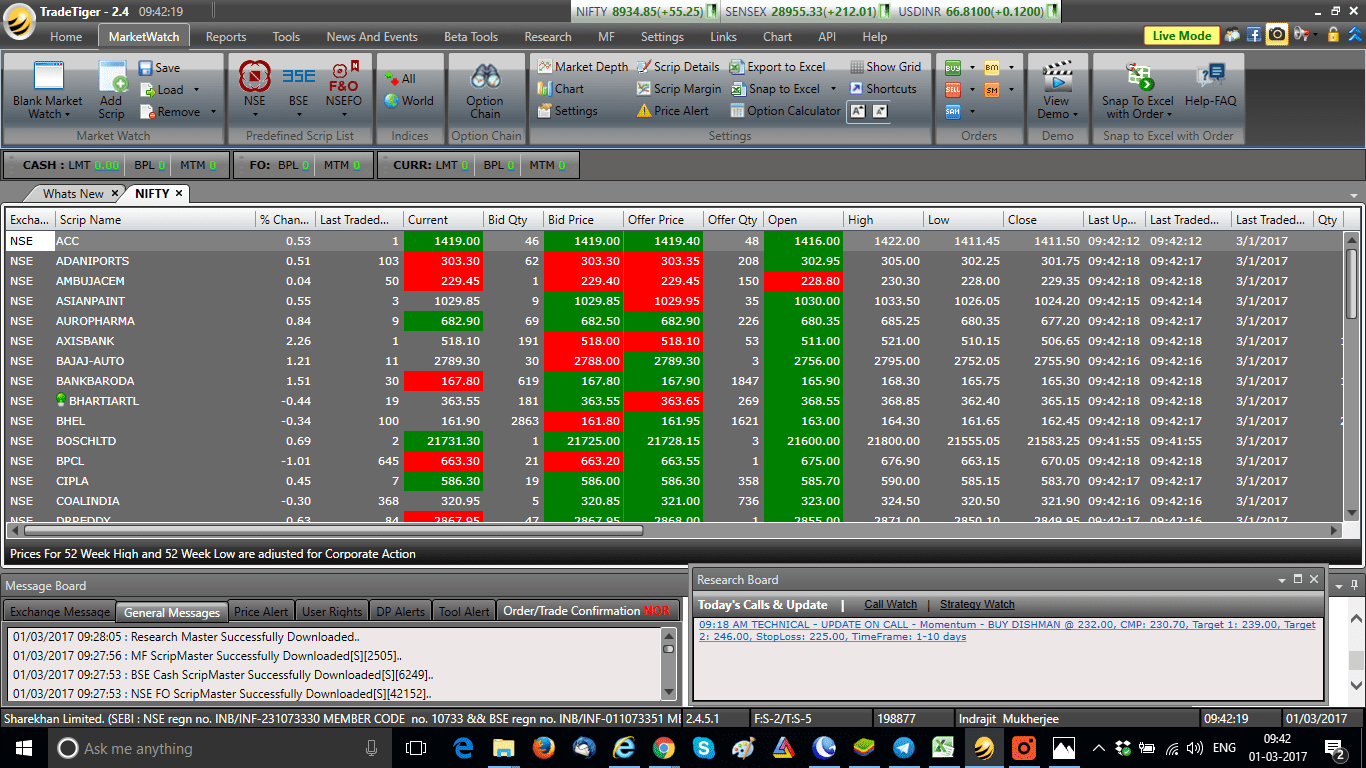
So, now your NSE Nifty50 stocks Marketwatch will be opened and you can see the market watch in the following image:
Activating Trade Tiger’s Snap to Excel Function
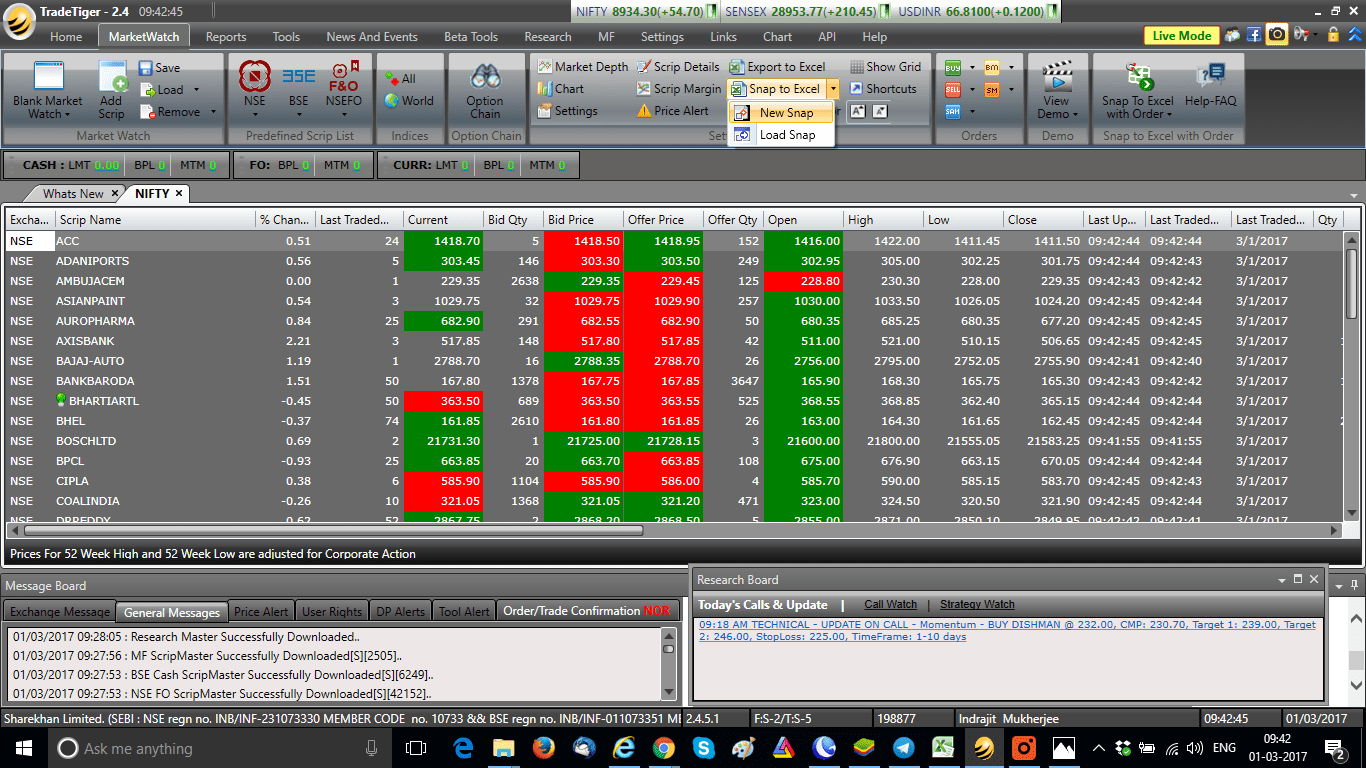
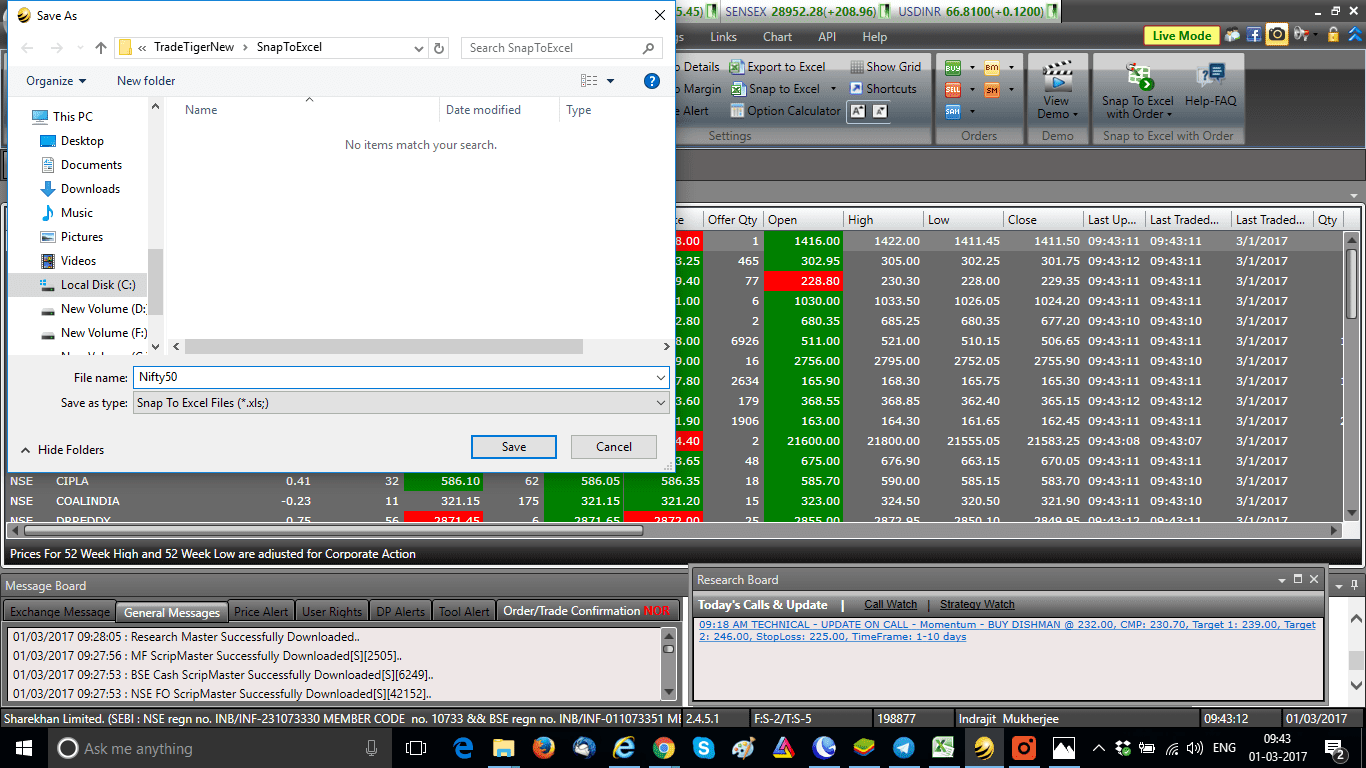
Next, we will activate Trade Tiger’s snap to Excel function and click on New Snap.
This function will try to save the MarketWatch snapped into Excel and will ask you for the same location as the Excel file. Provide an appropriate name for the Excel sheet, and save it to the default folder as shown in the image.
Navigating the Excel Workbook
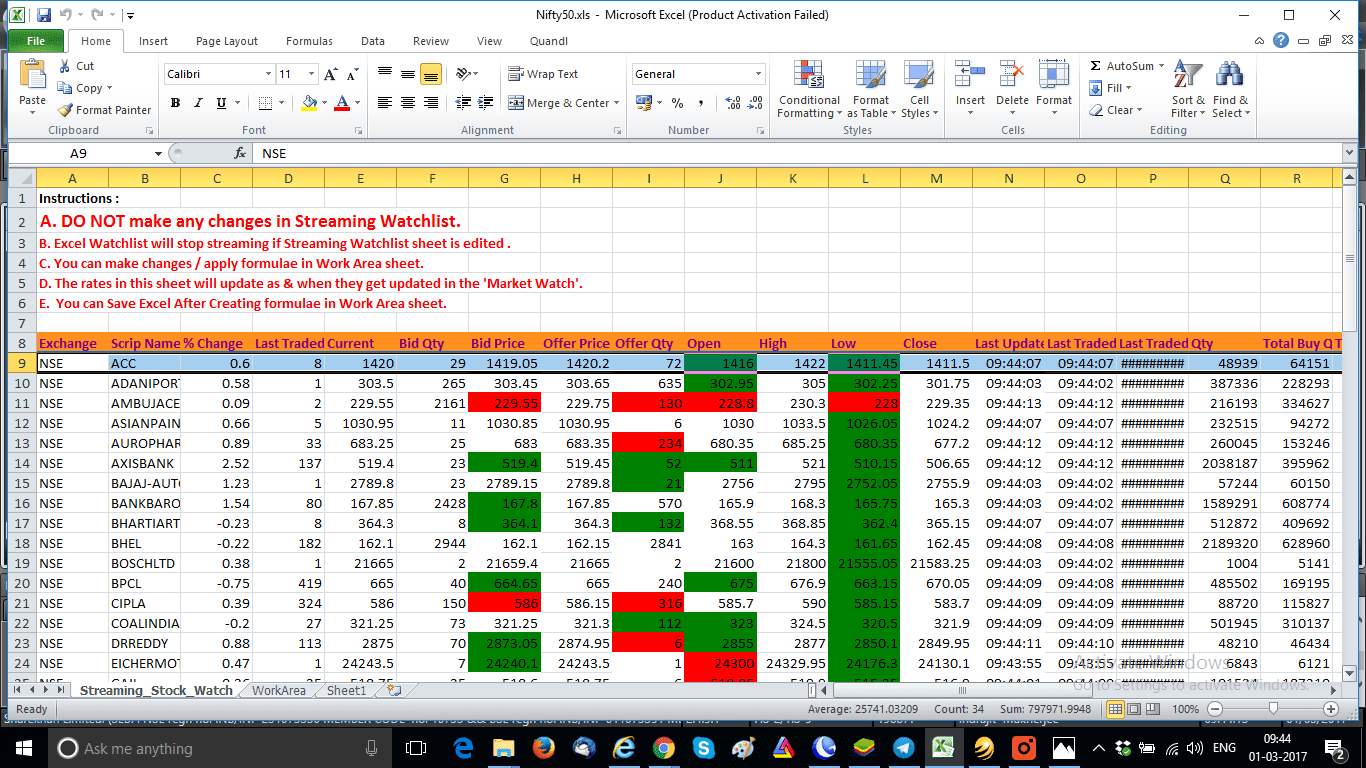
Once saved, the intraday trading Excel sheet will now be opened automatically. The Excel workbook contains 3 sheets, and the first is Streaming_Stock_Watch, which you cannot make changes to. If the market is open, you can see prices changing like the terminal in this sheet.


Now go to the second sheet called WorkArea. This sheet can be modified, and you can apply the formula in this sheet.
Building the Intraday Trading System
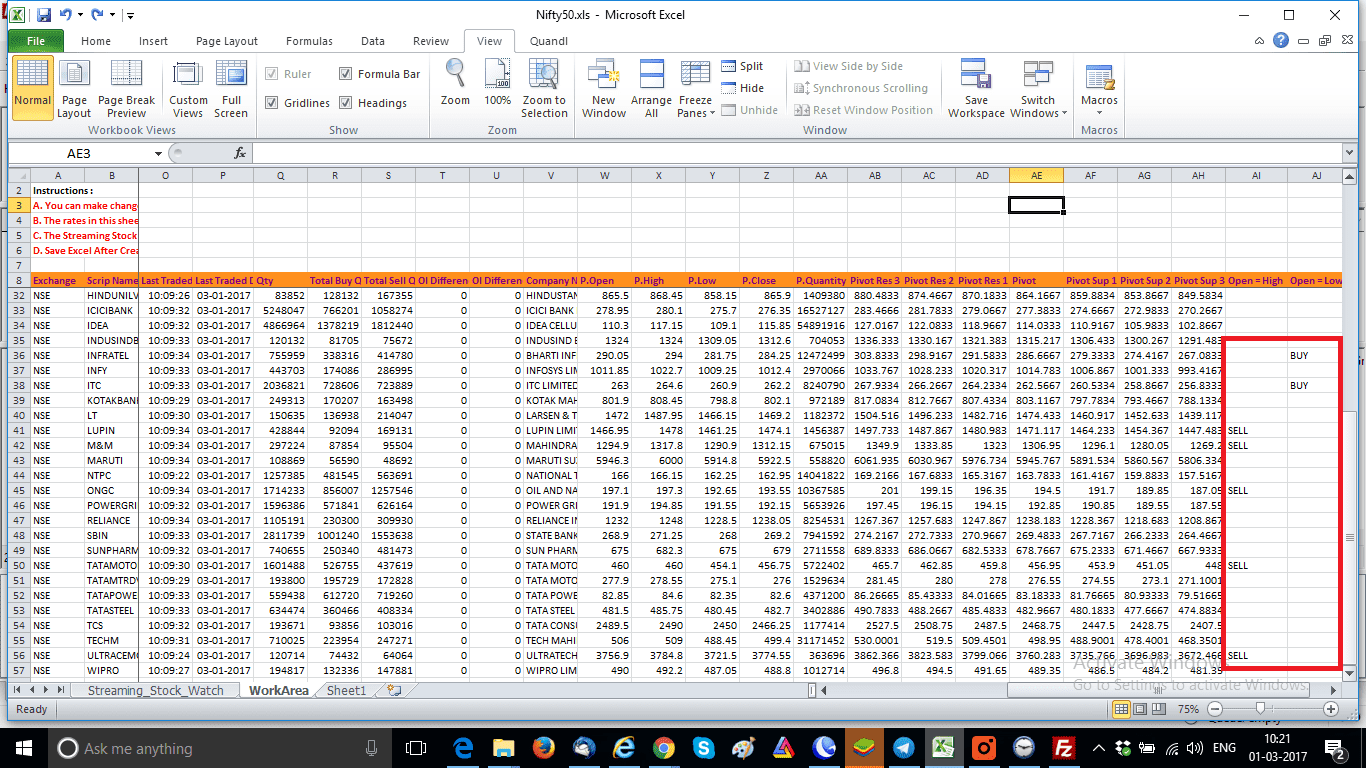
In this intraday trading Excel sheet, daily pivot levels are already provided. We will build a highly accurate intraday trading system using Open High Low Same Trading Strategy for the Indian Stock Market. In the last column, we have given the heading Open = High, and in the next column, we have given the heading Open = Low.
Adding the Formula to the Intraday Trading Excel Sheet
Now in the intraday trading Excel sheet, Open is in column J, High is in column K, and Low is in column L. So, for the Open = High formula for the first stock, we will use:
=IF(J9=K9,”SELL”,””)
For the Open = Low formula for the first stock, we will use:
=IF(J9=L9,”BUY”,””)
Now drag the formulas throughout both columns, and your buy-sell signal using Excel is complete using Sharekhan TradeTiger. Today is 1st March 2017, and we have got BUY candidates: INFRATEL, ITC, and SELL candidates LUPIN, M&M, ONGC, TATA MOTORS, and ULTRACEMCO. Check the image below:
Trading Strategy using the Open Equals to High OR Low in the Intraday Trading Excel Sheet
For the trading strategy, BUY and SELL should be executed after 15-30 minutes of trade. Firstly, for BUY, keep a 1%-2% intraday target and keep a stop loss few ticks below the day’s low. Similarly, for SELL, keep a 1%-2% intraday target and keep stop loss a few ticks above the day’s high.
FAQs on Intraday Trading with Excel
To create a trading sheet in Excel, you need to download live data from your trading terminal. You also need to snap it into an Excel sheet using the “snap to Excel” function. Then, you can apply formulas for intraday trading systems to the data and modify the Excel sheet to suit your trading needs.
There are many formulas for intraday trading. But, one commonly used formula is the Open Equals to High or Low trading strategy. In this strategy, you buy a stock if the opening price is the same as the low price, and you sell the stock if the opening price is the same as the high price. You can set intraday targets and stop losses based on your risk appetite and trading style.
The best chart setup for intraday trading depends on your trading style and preference. Some traders prefer candlestick charts, while others prefer line charts or bar charts. It’s important to choose a chart setup that helps you identify trading opportunities and make informed trading decisions.
Excel is a powerful tool for traders as it allows them to analyze and manipulate market data. You can also create trading systems and track their trading performance. You can use Excel to create trading sheets, backtest trading strategies, calculate risk-reward ratios, and monitor trading positions in real-time. Many traders use Excel in combination with their trading platform to enhance their trading experience.
Conclusion
In conclusion, creating an intraday trading Excel sheet from Sharekhan TradeTiger can be a great way to build a highly accurate trading system using an open-high-low-same trading strategy for Indian stock markets. With the step-by-step process outlined in this post, you can easily download live data in Excel from the TradeTiger terminal and apply the formula for the intraday trading system on the live data.
Remember to keep a 1%-2% intraday target and stop loss a few ticks below the day’s low for BUY and a few ticks above the day’s high for SELL. Test the strategy and let us know your observations in the comments below.


Very nicely explained. Can we put buy or sell order using this excel sheet directly from the sheet?
Mr. Shah definitely you can. Very shortly I will write on a full fledged excel trading system into Sharekhan Trade Tiger and Zerodha Pi. Keep following my site.
Snap to exel feature ka use karke buy or sell signal generate hone pe order automatically execute nahi hota exel ko full automatic kaise banaye
Let me come back to this issue in a new post. Else you can try connecting your broker’s platform by using Python.
It’s a good reading but it is very old strategy which may not be successful.I also read about ur article about using Renko charts & u are the only one to explain for the Indian markets, i really appreciate ur efforts.But in Pi the renko for nifty futures gives very big boxes unlike Kite.Pi is the most easiest to use but there some drawbacks so if you can inform Zerodha to check into it.
Avinash you are correct. But I have seen markets run in cyclical nature. So old strategies start working after 8-10 years. Pi also you can control box sizes. Try a 10 size box in 2 minutes renko chart of Nifty. Check HERE.
thank you Mr Indrajit for this beautiful tool. It seems, setting a target for buy or sell depends on price of particular scrip. like 1-2% for stock price 1000. Precisely, based on individual’s trading style and appetite. No gyan, only my observation.
regards
Jayanta Ghosh
Jayanta, you are correct. I have posted just a tentative target that can be achieved intraday. You can do trial and error with your target settings.
Dear Mr.Indrajit,
I tried in the morning 9.20 am today. three out of four stocks ended positively one stock hit stop loss. But entire day the signals are constant for the same stock. How to refresh for fresh signals based on the live price. thanks and best regards.
Ranga Rajan, as this excel is based on day’s open high low signals will not change till new day is formed. And regarding trading, 3-4 trades in a day is good. Dont overtrade, enjoy profit of 3 good trades. Cheers!!
Very nice article Indrajit. I pull a live data excel sheet from Ami Broker Speed pro. How do I execute But and Sell orders through Excel sheet directly without actually going to the terminal.
I can tell you procedure for automated trading in Zerodha. If you want to do algo trading in Angel Speed Pro, plz contact Angel Broking. To open a Zerodha account you may CLICK HERE.
Thanks Mr Indrajit. I have a Zerodha account and would surely like to explore automated trading in Zerodha and have Omnesys NEST Trader as well. Your help is truly appreciated.
Sir, I have been a sharekhan customer from 2007. But I started trading since last 2 years. I have read that zerodha Pi is better than tradetiger. SImilarly I found some hidden softwares in trade tiger like you explained above. I prefer weekly or monthly trades. Plus I am developing my own technique. sharekhan does not help in such activity. So is it better to join zerodha Pi can Q guys help me to build my system.
Narendra can you send us your contact number so that we can talk?
=IF(J9=L9,”BUY”,””) thi s is not working
Rahul please check the ” sign. If needed type them manually.
sir i am using tradetiger from last two years. now i am interested in its feature of SNAP QUOTE excel. sir my question how to find stocks with +_ .5% O=H=L RANGE. because some stocks have very less difference between O=H=L . but have very good volumes and open interest . thanks in advance.
Can do do by using the IIF function of excel.
can we place order or automate trade execution from excel
Even I was looking for this answer. Please drop a mail if anybody have an answer.
Indrajit, Have you tried and succeeded in linking the snap excel file with another excel file? Basically I am trying to link the working sheet few columns with my another excel file but my excel file does not get updated with the live ticks. If I save the snap file then it gets updated. So this means saving the snap file everytime….Have you tried something like this and can you suggest a work around?
Try working in the snap excel file but in different sheet.