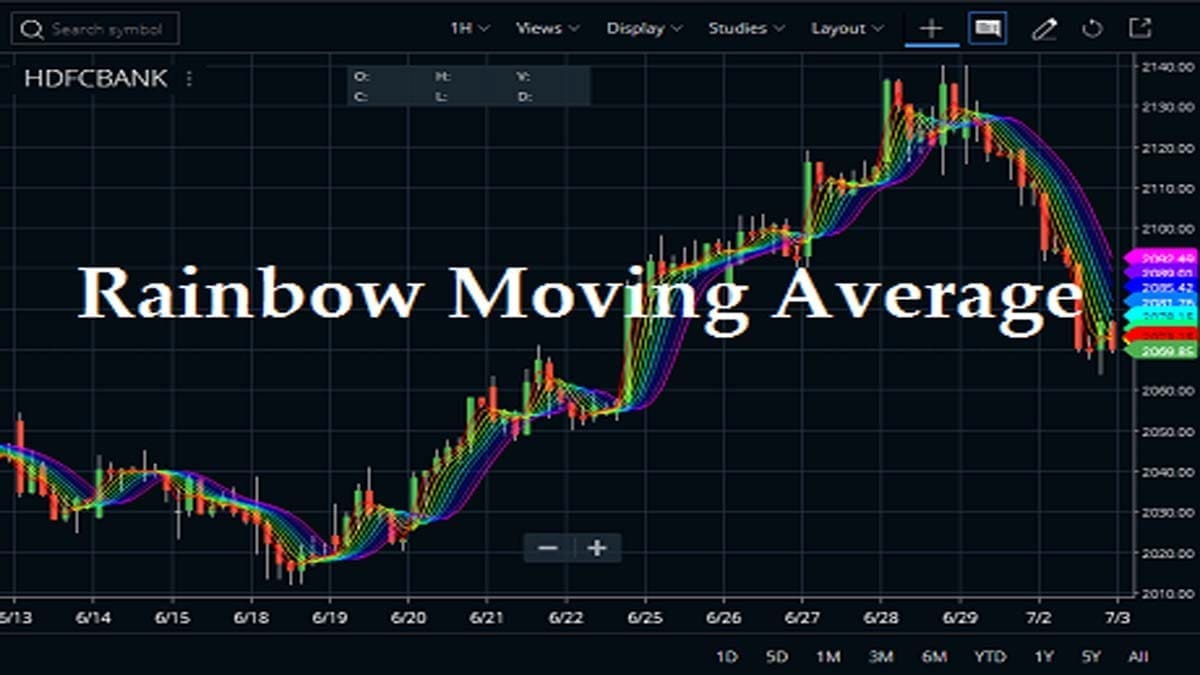
The Rainbow Moving Average indicator shows multiple SMA (simple moving averages) all at once for a particular time period. The trading strategy of the Rainbow Moving Average indicator has already gained quite a lot of popularity among traders. This indicator is quite useful for intraday as well as swing traders. Earlier, we posted articles on Moving Averages. If you want to know about
Features of Rainbow Moving Average
- By applying the Rainbow Moving Average, traders can avoid the confusion of adding multiple moving averages in one chart.
- You can use the Rainbow indicator on any timeframe and asset.
- There are various ways to use the Rainbow. You can use it along with other indicators, or you may draw trendlines to define the buy-sell signals.
- Setting up the indicator on charting platforms is quite simple and easy in comparison to setting up different MAs at a single time.
How to Attach Rainbow Moving Average Indicator on Chart?
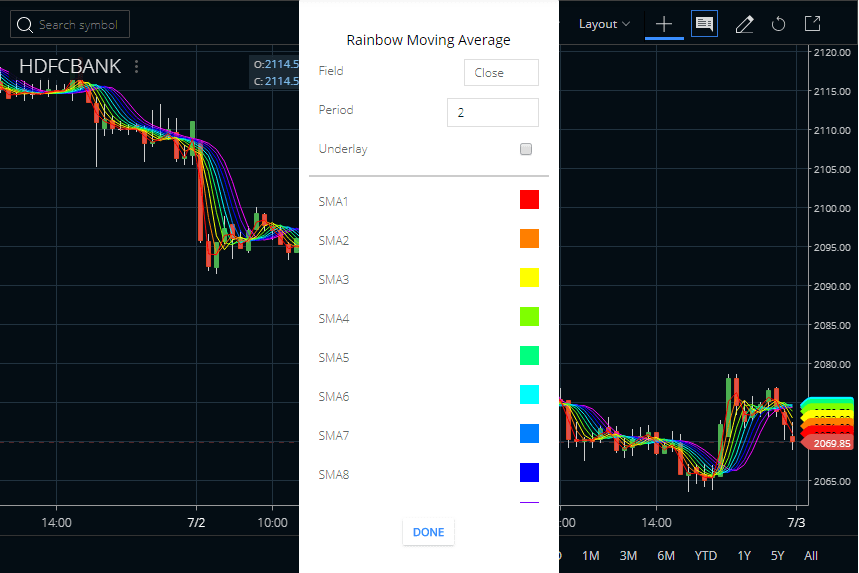
If traders want to know more about the indicator, then they can find it in the STUDIES section of Zerodha Kite. They can also use the Kite Mobile App. The Field is close and we can set this value too high or low etc. The default Period is 2, we can set this value also. Check the image below to understand how to attach the Rainbow Moving Average Indicator in the HDFC Bank share price chart. You can attach this indicator to any charts like daily, weekly, monthly, or intraday.
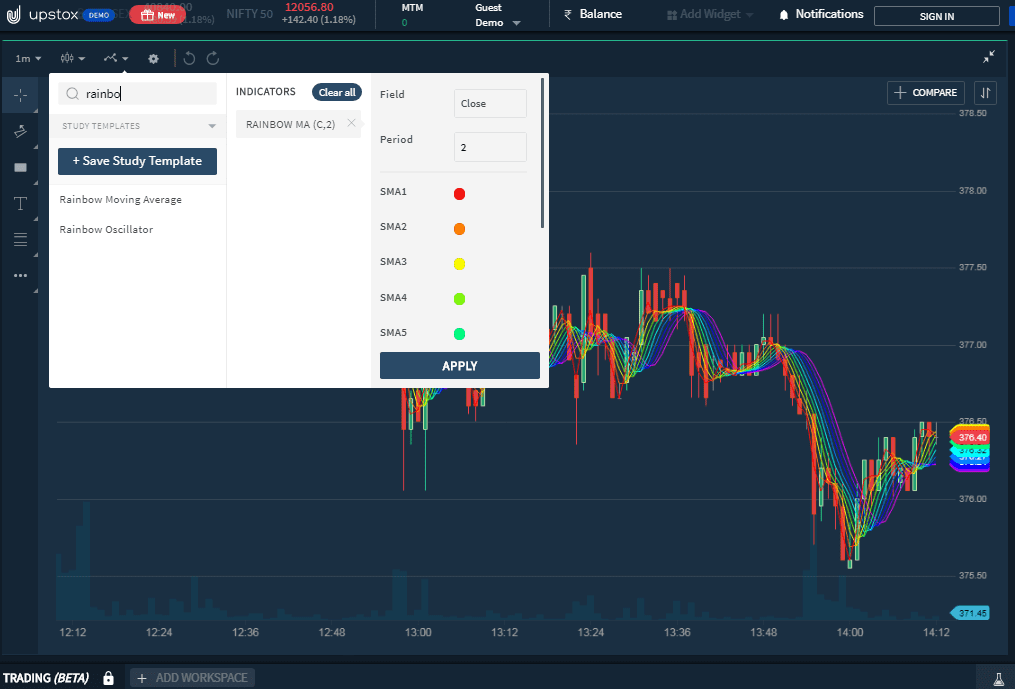
The next charting platform is Upstox Pro. First, log in to your account, then open any chart there. After opening the chart, open the indicator section. There type down the name of the indicator and click on the apply option.
Trading Strategies of the Rainbow Moving Average Indicator
Each simple moving average or SMA is calculated based on the previous SMA (simple moving average) and is color-coded in the chart. Together with all of the moving averages or MAs thus form a cloud. Let us discuss how you can take trade with this cloud.


Price Crossover with the Indicator
The price crossing the MA cloud from below is considered to be bullish and that generates a buy signal.
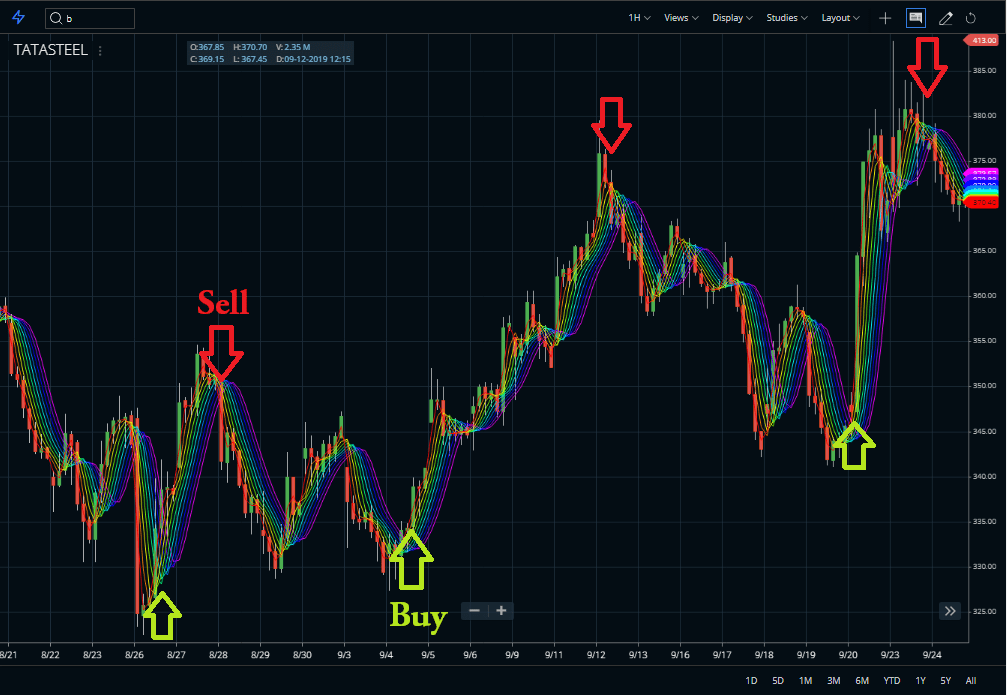
Similarly, when the price crosses the MA cloud from the top it is a bearish sign and triggers a sell signal.
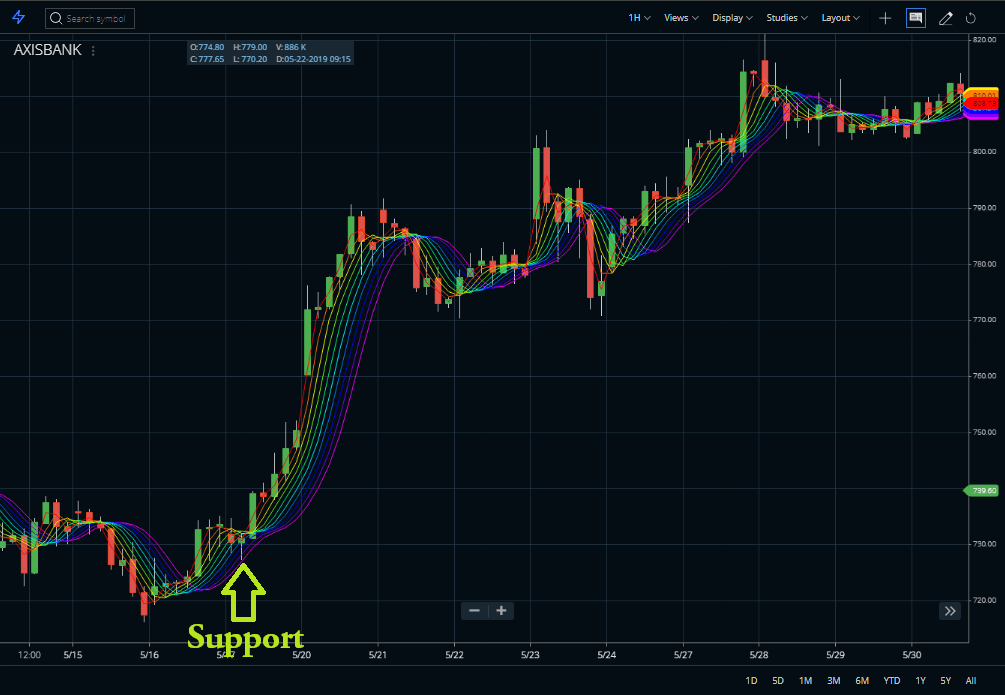
Usage as Support and Resistance
Apart from the crossover signals, the MA cloud can also act as a support and resistance and traders can take counter-trend bounce when the price retests the moving averages after an initial trend. Check the image below to understand how it can work as a support.
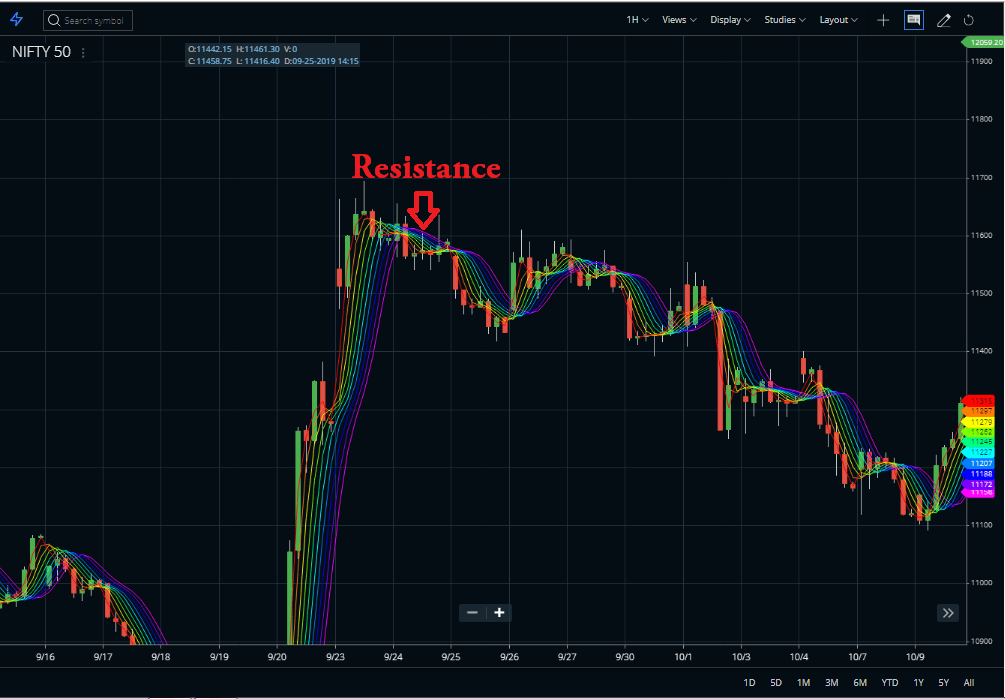
Similarly, you can see price took resistance exactly at the Rainbow Moving Average and went down.
FAQ
The Rainbow indicator is used by traders to look for support and resistance levels. It may be applied as an overlay to a chart to spot potential areas where price action could bounce or reverse. Traders may use the signals generated from this indicator along with other technical analysis indicators for more accurate timing of trades.
The rainbow moving average strategy combines multiple different Moving Averages and uses them to identify entry points for trades. This moving average crossover technique provides traders better entry opportunities compared to using just one Moving Average, thus should produce better results in terms of trading success rate.
The Rainbow Strategy refers to a method of stock market investing that emphasizes diversification across various financial instruments by holding positions spanning several sectors at any given time. This allows investors to spread risk among multiple securities instead of having all their eggs in one basket, while still taking advantage of investment growth opportunities on individual stocks or security classes and currencies as they become attractive buying choices over time.
There’s no definitive answer because every trader has different market conditions and risk tolerance when deciding which signal type works best for them during live trading encounters; some favor slow-moving averages while others prefer fast ones depending on the situation presented before them at any given period in time. Generally, though, exponential Moving Averages are considered superior due to their stronger weighting given toward recent prices within its plotting line allowing traders to react faster when making shift decisions under certain current circumstances they encounter out there on the market floor simultaneously.
Conclusion:
The Rainbow MA has been derived from the MetaTrader codes. Being a trend-following and lagging indicator, the Rainbow Moving Average Indicator performs well in a trending market. This indicator is likely to generate whipsaws in a range-bound and choppy market. This technical indicator should not be used as a standalone basis. Rather combining with other oscillators can improve the trading performance a lot.


