The Rainbow Oscillator Indicator basically helps to forecast the changes in trend direction. Mel Widner developed the oscillator and described it in July 1997 in the issue of Technical Analysis of Stocks and Commodities magazine. It is based on a two-period simple moving average. So, let’s check the details of it.
What is Rainbow Oscillator?
This Rainbow oscillator is derived from a consensus of the Rainbow charts trend. The indicator is as same as the Rainbow MA (Moving Average) charts. You can use the indicator to follow trends and its graph is plotted based on the same calculations made to find the Rainbow Charts. It also determines the highest high value as well as the lowest low value among those moving averages.
Attaching the Rainbow Oscillator on Different Charting Platforms
On Zerodha Kite
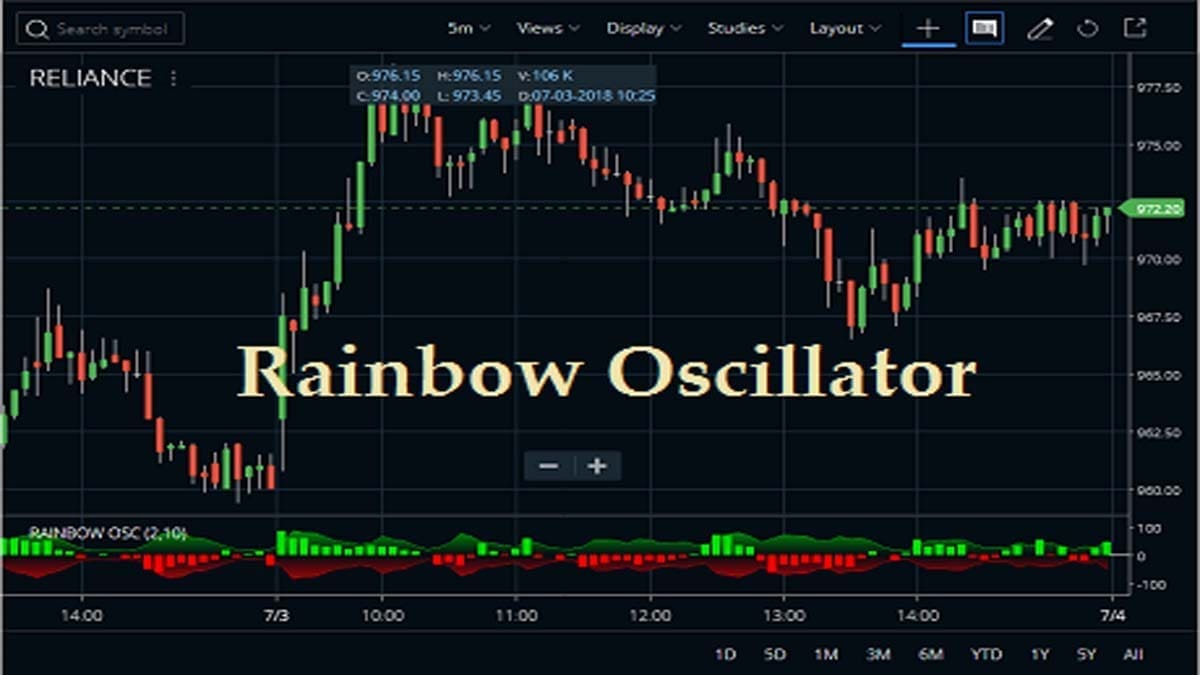
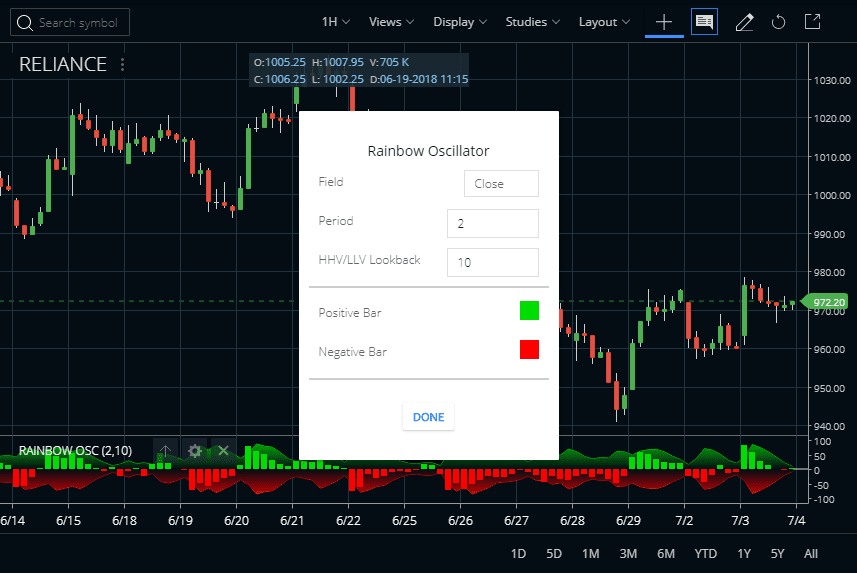
The traders can find the Rainbow Oscillator indicator In the Zerodha Kite platform, under the STUDIES section. Also, this is available in the Kite mobile App. The Field is Close you can set it. The Period is 2 and you can set the value of it high and low. The HHV/LLV Lookback and you can set the value of it high and low. is 10 You can check how we attached the indicator in Reliance Industries shares price chart. In this indicator on to any charts like daily, weekly, monthly, or intraday you can attach.


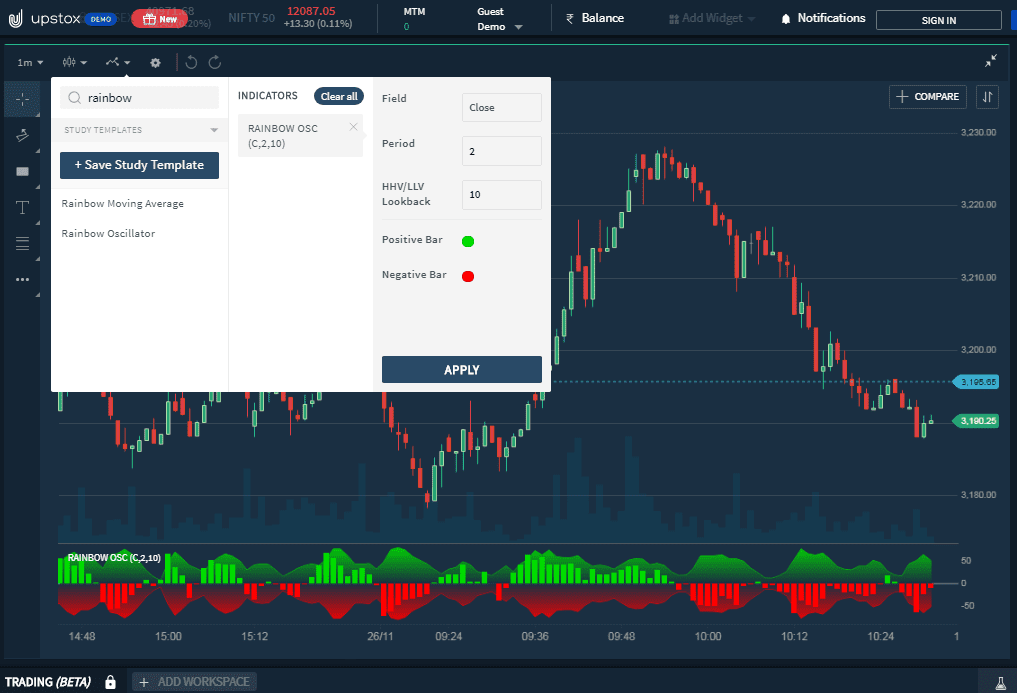
On Upstox Pro
The next platform is Upstox Pro. The way is as same as Zerodha Kite. After opening the account, open any of your preferable charts. And, type down the indicator name, click on apply. You may change the settings of it from there.
Features of the Rainbow Oscillator
- You can apply the indicator along with other financial indicators that are to predict with a certain rate of accuracy the trends of the market.
- If the market is rising and the trend is to go up, the most abrupt line is at the top of the Rainbow. And oppositely, the smoothed line is at the bottom of the Rainbow.
- In the same way, once the market is declining and the trend is pointing to down, the Rainbow has reversed. Here, also the least smoothed line is at the bottom and the smoothest line is at the top of the Rainbow.
- If market prices go up and down, then the oscillator appears in the direction of the trend.
Trading Strategies of the Rainbow Oscillator
- In the Rainbow Oscillator indicator, the rainbow grows in width, the current trend gives signs of continuity.
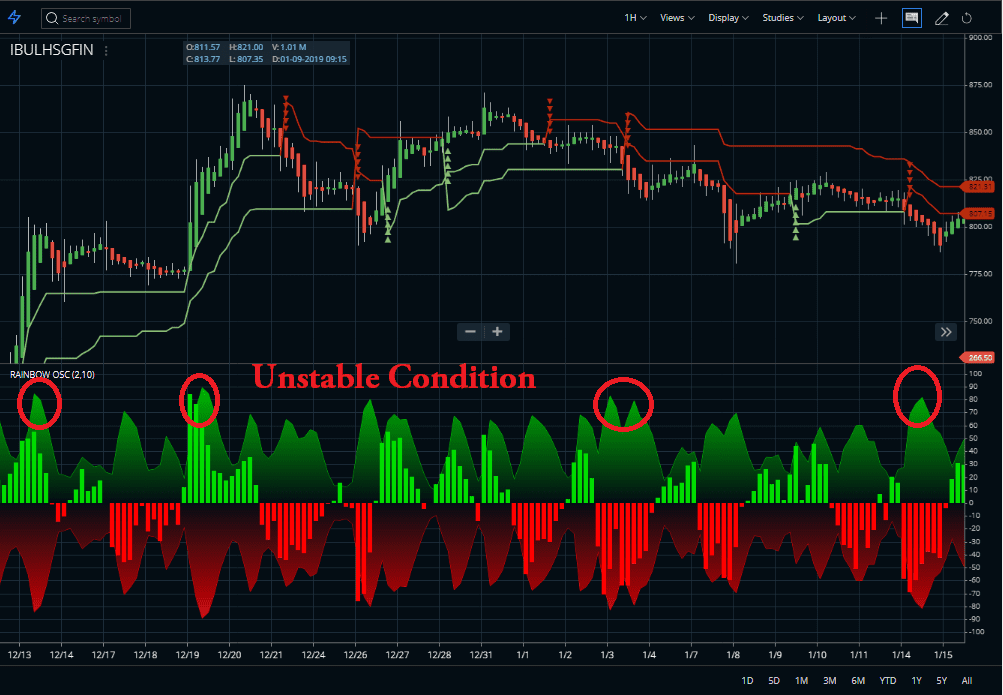
- If the value of the oscillator goes beyond 80, the market becomes more and more unstable.
- The oscillator flattens when prices move towards the rainbow or to the mean and the market tends to remain more stable and the bandwidth decreases.
- If the oscillator value goes below 20, then the market is again prone to sudden reversals.
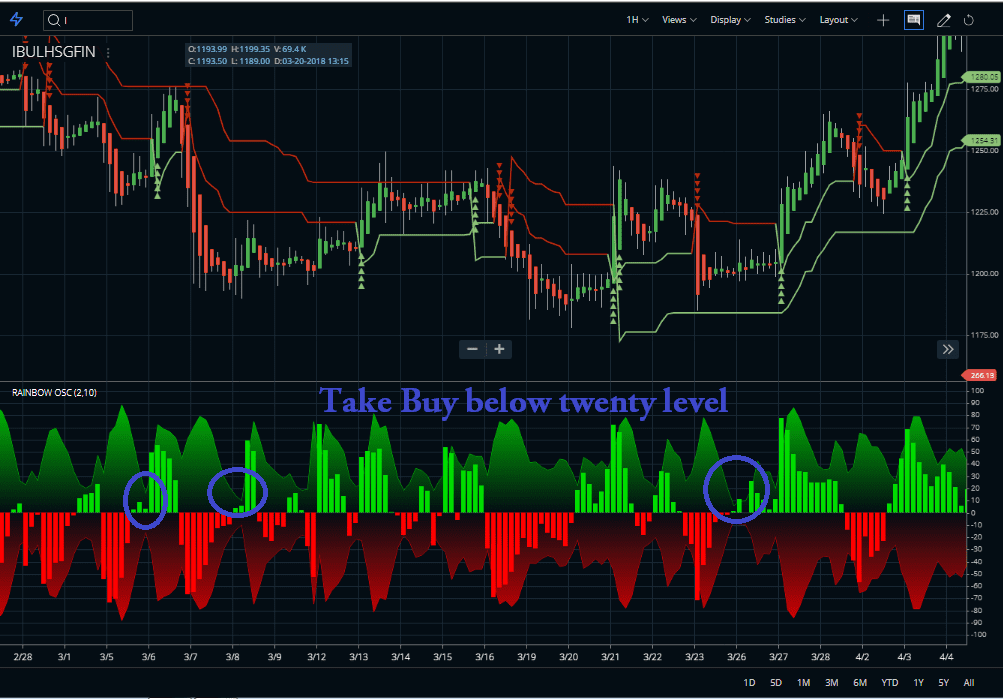
- The market is stable between 20 and 80 where the safest bandwidth value.
- In this indicator, the depth of a certain price has on a chart and even you can use this to judge the strength of the move.
Conclusions :
The main conclusion of the Rainbow Oscillator indicator is markets are not random. They have continuously tried to determine a specific and secure way to predict the movements the markets are the most predisposed to make. The traders have developed financial indicators to help them forecast market trends in logical and exact ways. In mathematical analysis this has always helped in the definition of indicators and market investing has proved itself to be a science that day.
As we mentioned that the Rainbow Oscillator indicator is derived from a consensus of trends that has the appearance of a rainbow when it is plotted in color. Traders use this for getting buying and selling signals, as well as determining overbought and oversold positions. In conclusion, everyone can invest successfully in the market as long as they have the little programs that help create easy-to-read and self-sufficient financial indicator charts.


