
As a newcomer to the Indian stock market, it can be overwhelming to navigate the complex world of trading and investing. One important tool for analyzing the market is open interest (OI) data along with a multi-strike OI chart, which provides valuable information about the activity of traders and investors. Understanding this data can help you make more informed trading decisions and increase your chances of success.
At StockManiacs.net, we offer live OI data for both Nifty and Bank Nifty, allowing you to stay up-to-date with the latest market trends. However, one feature that is missing from our website is the open interest chart for multiple strike prices. In this blog post, we will explain what a multi-strike OI chart is, why it’s important, and how you can access it using Sensibull, a powerful options trading platform.
I. Overview of Open Interest Data
Open interest data refers to the total number of outstanding contracts for a particular security. This data provides valuable insights into market sentiment and can be used to predict future price movements. For example, if open interest is increasing, it suggests that traders are becoming more bullish on a particular security, which may indicate an upcoming price increase.
At StockManiacs.net, we offer live OI charts for both Nifty and Bank Nifty. These charts allow you to track changes in open interest over time and identify potential trading opportunities.
II. What is a Multi-Strike OI Chart?
A multi-strike OI chart is a tool that allows you to analyze open interest data for multiple strike prices simultaneously. This chart shows the total open interest for each strike price, allowing you to quickly identify which strike prices have the highest levels of open interest. This information can be useful for identifying potential support and resistance levels, as well as for predicting future price movements.
Unlike other OI charts, which only show open interest for a single strike price, the multi-strike OI chart provides a more comprehensive view of market sentiment. By analyzing multiple strike prices at once, you can get a better understanding of how traders and investors are positioning themselves in the market.
III. Sensibull and Multi-Strike OI Chart
Sensibull is a powerful options trading platform that allows you to analyze open interest data in real time. To access the multiple strike price’s open interest chart, you can log in to Sensibull directly from your Zerodha Kite terminal. If you have a Zerodha account, you can access this feature free of charge. You can also click here or contact us for opening an account.






A. How to Access this Feature in Sensibull
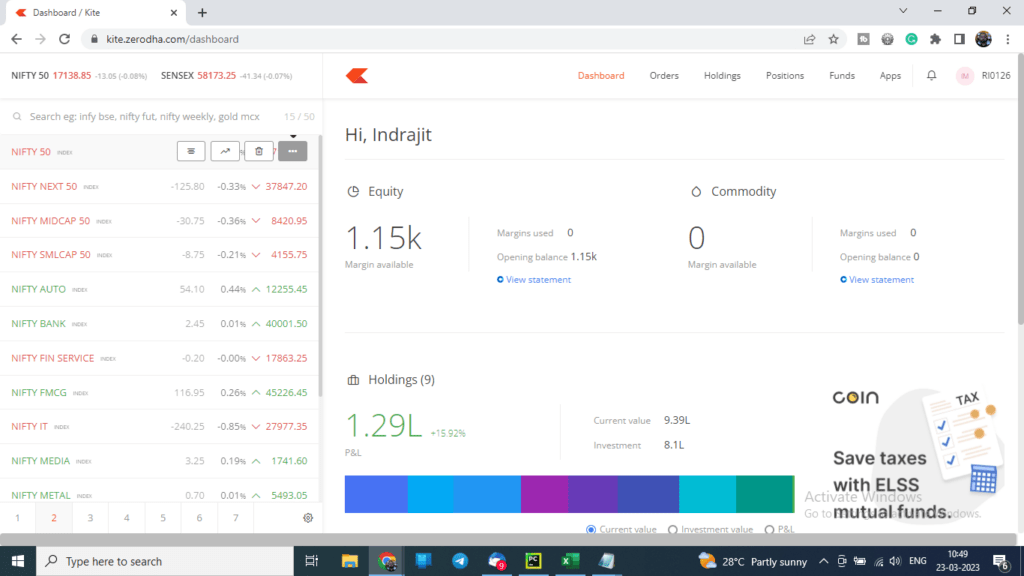
Firstly, open the Zerodha Kite terminal and click on the three dots beside any stock index name. Here, I am clicking the three dots beside the Nifty 50.
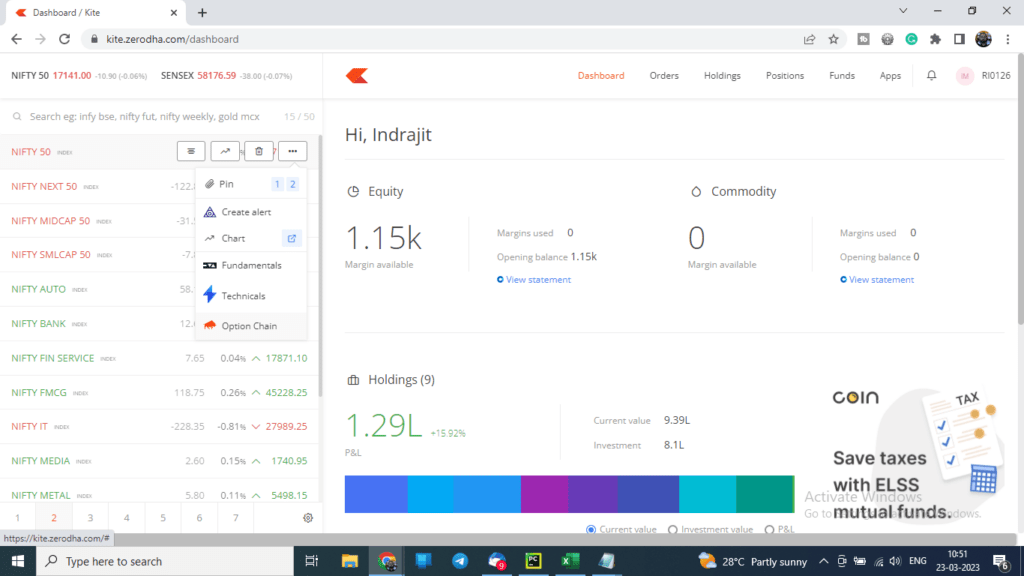
Next, click on the Options Chain.
This will open the Sensibull options chain directly from the Kite terminal. Watch the image below.
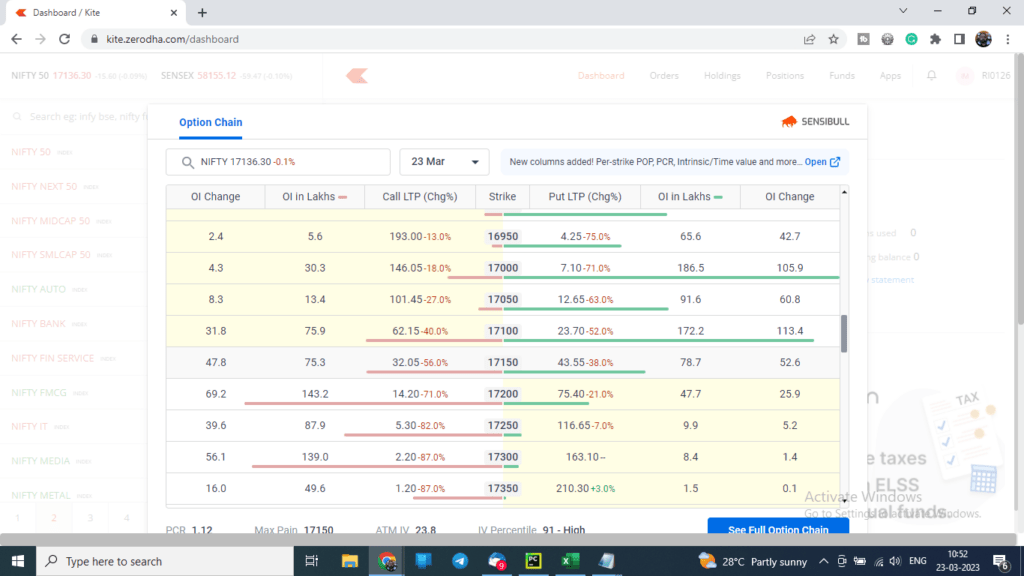
Now click the See Full Options Chain blue button below and this will open the full options chain on the Sensibull website.
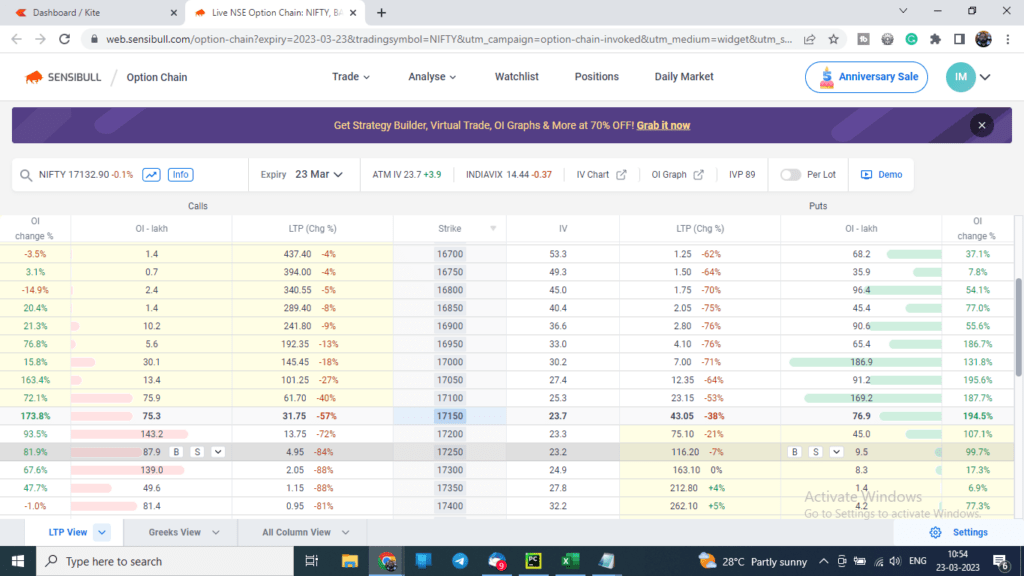
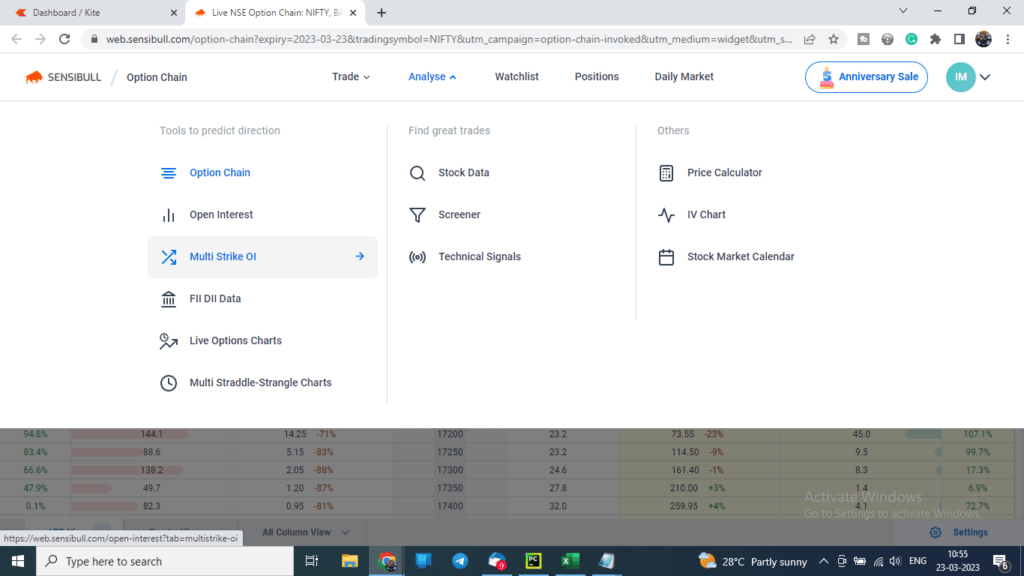
Now, from the Analyze drop-down menu, select Multi-Strike OI. This will open the multi-strike OI chart of Nifty.
You can add different line charts of calls and put options of different Strike Prices here and also add the index chart in the same pane.
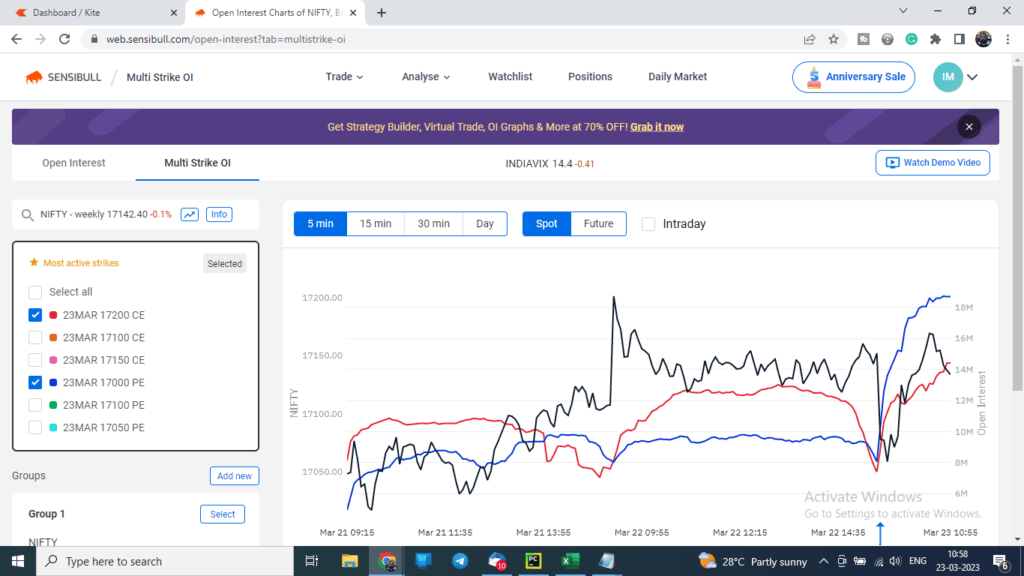
With Sensibull, you can analyze multi-strike OI charts for both Nifty and Bank Nifty, as well as for individual stocks. You can also view historical OI data and track changes in OI over time.
IV. Advantages of Multi-Strike OI Chart
The multiple strike price’s open interest chart offers several advantages over other OI charts. Firstly, it provides a more comprehensive view of market sentiment, allowing you to make more informed trading decisions. By analyzing multiple strike prices at once, you can identify potential support and resistance levels, as well as predict future price movements. Suppose you see a sudden increase of put options and a simultaneous decrease of call options, you can predict that the market may take a short cover from here and can go upside. Similarly, an increase in call options and a decrease in put options can initiate short selling.
Secondly, the multi-strike OI chart is particularly useful for options trading. By analyzing open interest data for multiple strike prices, you can identify potential opportunities for creating spreads or selling options. This can help you generate income and reduce your risk exposure.
Finally, the multi-strike OI chart can be used in conjunction with other technical analysis tools, such as put call ratio and volume analysis, to gain a more complete understanding of market trends.
V. FAQ
Multi-strike OI refers to a chart that displays open interest data for multiple strike prices simultaneously.
If the call open interest is high, it suggests that traders believe the market will go up, as they are buying more call options, which gives them the right to buy the underlying asset at a predetermined price. On the other hand, if put open interest is high, it suggests that traders believe the market will go down, as they are buying more put options, which gives them the right to sell the underlying asset at a predetermined price. By analyzing the multi-strike OI chart, traders can identify these patterns and use them to make informed trading decisions.
There are many websites that provide open interest analysis for the stock market. However, when it comes to the Indian stock market, StockManiacs.net is one of the best options. They provide live open interest charts for Nifty and Bank Nifty, which can be incredibly useful for traders. Additionally, they encourage to use of a virtual trading platform like NeoStox for practising options trading and offer a detailed technical analysis of the stock market.
Open interest can be used in intraday trading to identify the sentiment of the market and make informed trading decisions. Traders can use the multi-strike OI chart to identify the levels of support and resistance and determine which options are likely to be profitable. Additionally, they can use the put-call ratio to determine the overall sentiment of the market, with a high ratio indicating a bearish sentiment and a low ratio indicating bullish sentiment.
VI. Conclusion
In conclusion, open interest data is an essential tool for traders in the Indian stock market. Also, by analyzing open interest charts, traders can identify the sentiment of the market. They can also predict price movements, and make informed trading decisions. The multi-strike OI chart is a valuable tool for open interest analysis. It allows traders to see open interest data for multiple strike prices simultaneously. Sensibull is an excellent resource for accessing the multi-strike OI chart and analyzing it to make better trading decisions.
We encourage readers to visit Nifty Open Interest and Bank Nifty Open Interest pages on StockManiacs.net to access live OI data and stay up-to-date with the latest market trends. We also urge readers to consider opening a Zerodha trading and demat account. This will provide access to Sensibull and other valuable trading resources. With the right tools and knowledge, anyone can become a successful trader in the Indian stock market.
So, if you want to stay ahead of the game, start analyzing open interest data today and take advantage of the valuable insights it provides. Happy trading!