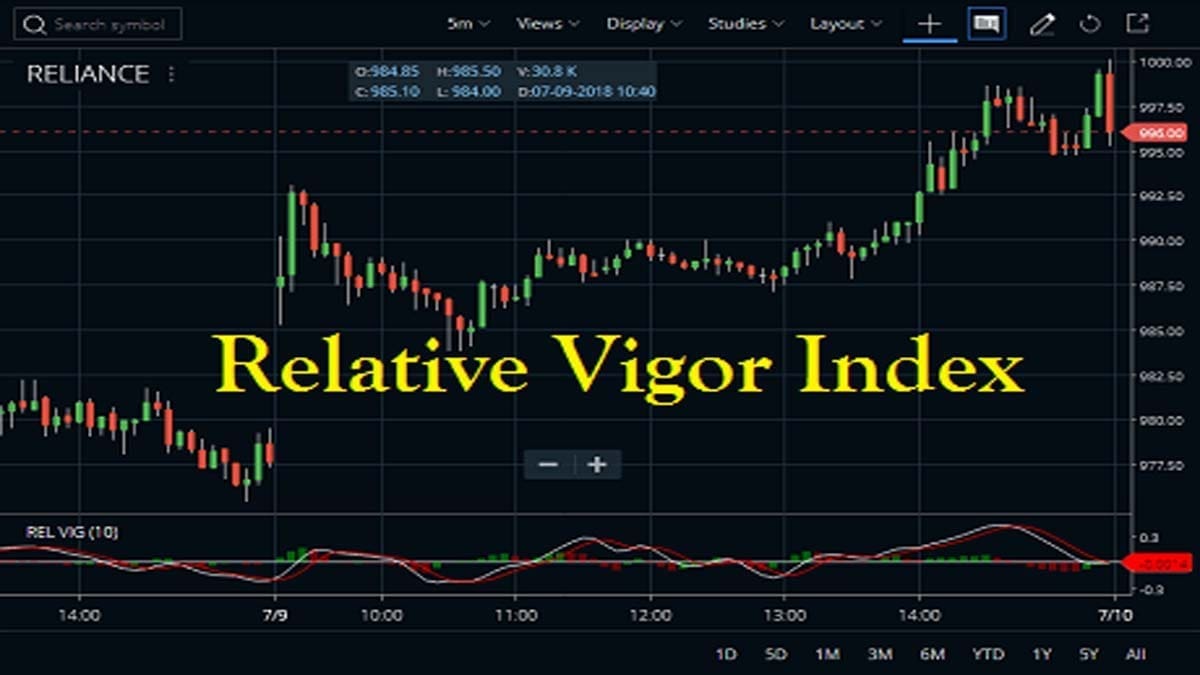
The Relative Vigor Index indicator or RVI is an oscillator. The indicator is based on the tendency for prices to close higher than the prices open in uptrends and to close lower than the prices open in downtrends. Basically, it is an oscillator that is in phase with the cycle of the underlying price. This is a typically centered oscillator rather than a banded oscillator. Basically, it means that it’s typically shown above or below the price chart and moves around a centerline rather than the actual asset price.
Features of Relative Vigor Index Indicator
- As it is a center oscillator, oscillates across a center line rather than a trend, higher or lower.
- The RVI indicator is similar to the Stochastic indicator. But it compares the close relative to the open rather than comparing the close relative to the low.
- The RVI indicator bounces above and below zero levels generating both positive and negative values.
- It attempts to give a guide to the trend of the market, to persist in a similar direction of that move – or for the price move to break it down.
The Formula of the Relative Vigor Index Indicator
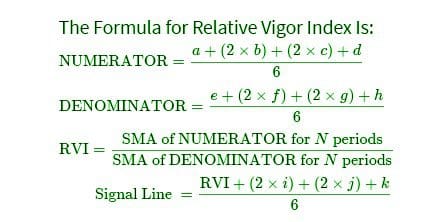
Here,
- a=Close−Open
- b=Close−Open One Bar Prior to a
- c=Close−Open One Bar Prior to b
- d=Close−Open One Bar Prior to c
- e=High−Low of Bar’a’
- f=High−Low of Bar’b’
- g=High−Low of Bar’c‘
- h=High−Low of Bar’d‘
- i=RVI Value One Bar Prior
- j=RVI Value One Bar Prior to i
- k=RVI Value One Bar Prior to j
- N=Minutes/Hours/Days/Weeks/Months
The Calculation
- First, choose an N period to examine.
- Then, identify the Open, High, Low as well as Close values for the current bar.
- After that, identify the Open, High, Low, and Close values for lookback periods prior to the current bar.
- So, calculate simple moving averages for NUMERATOR and DENOMINATOR over the N period.
- And, divide the NUMERATOR value from the DENOMINATOR value.
- Lastly, place the result in the Signal Line equation and plot it on a graph.
Attaching Relative Vigor Index Indicator on Charting Platforms
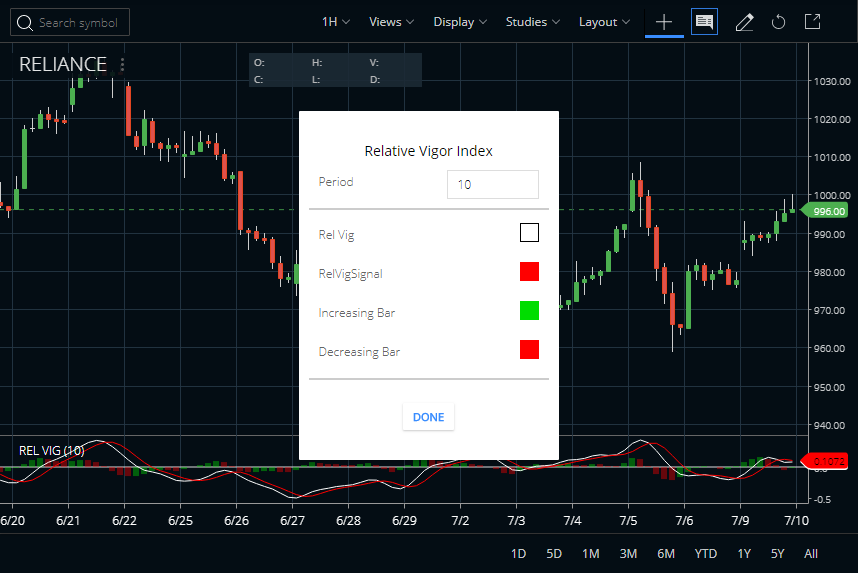
On Zerodha Kite
The traders can know more about the RVI indicator, then they can find it in the STUDIES section of Zerodha Kite. The Relative Vigor Index indicator is also available in Kite mobile App. The Period is 10 and you can set the value of it high and low. In this indicator on to any charts like daily, weekly, monthly, or intraday you can attach. You can also check how we attached the RVI indicator in Reliance Industries’ shares price chart.
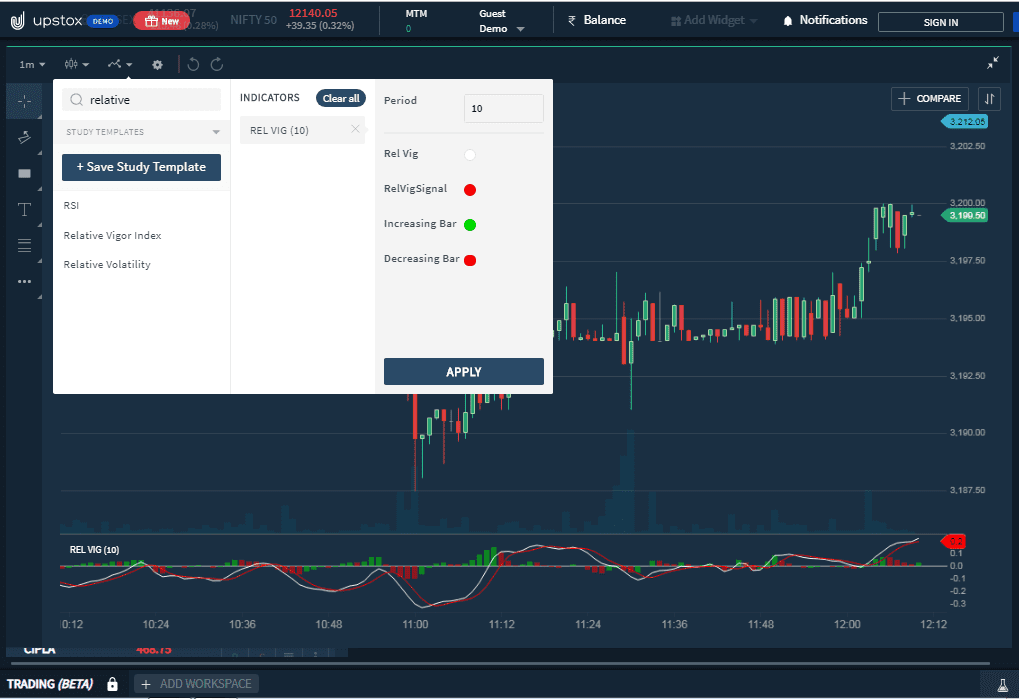
The next terminal I am going to show you, for instance, is Upstox Pro. So, here also, you need to open your account just like Zerodha Kite. Then open any of the charts and search for your indicator. Lastly, click on apply.
Trading Strategies of the Relative Vigor Index (RVI)
So, here is the list of the two most important trading signals of the indicator.
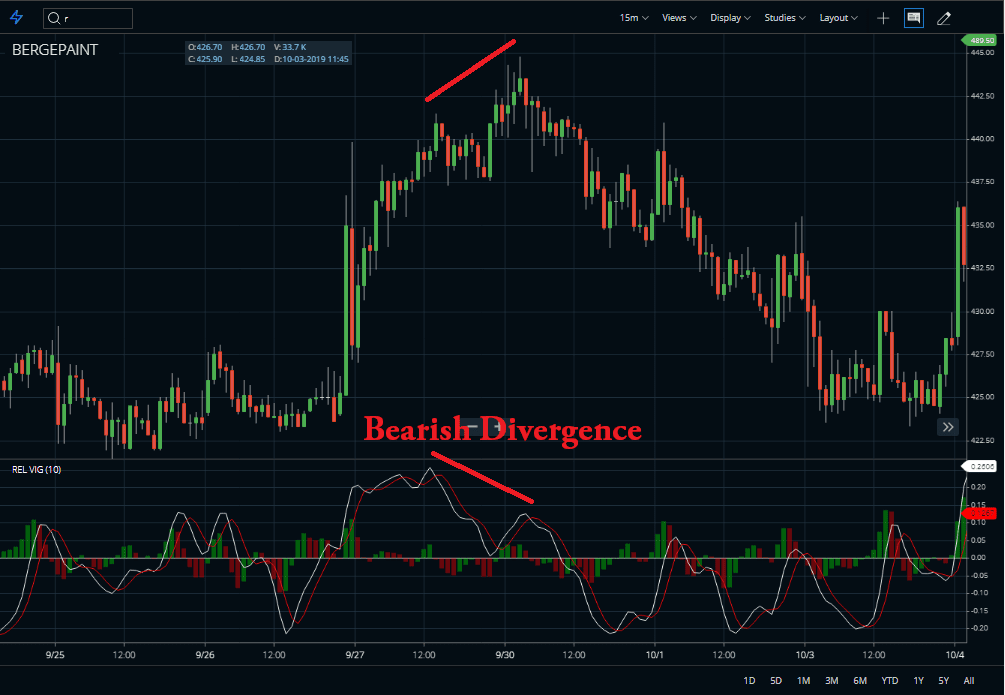
Divergences of RVI Indicator
The divergence between the RVI indicator and the price may suggest that the trend is going to change in the direction of the RVI’s trend. For instance, if an asset price is rising and the Relative Vigor Index is falling, it suggests that the stock may see a bearish reversal over the near term.


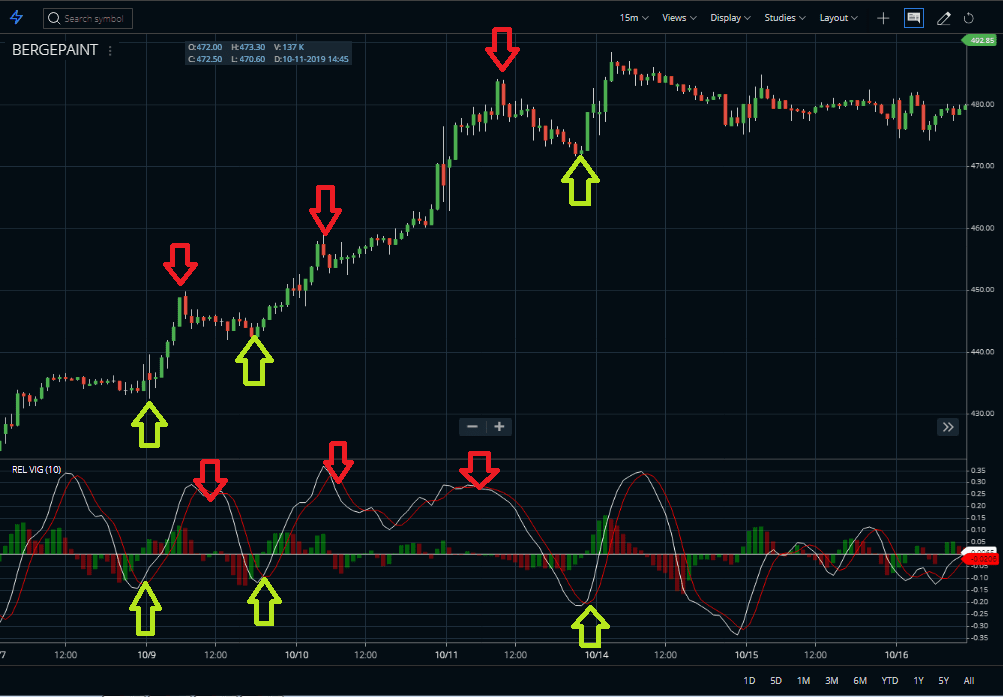
Crossovers of RVI Indicator
This indicator has a signal line. Another strategy is when the signal line (red line) crosses the RVI line (white) from below, you may sell there. Oppositely, when the RVI line crosses the signal line, you may buy.
Overbought and Oversold Levels in the Relative Vigor Index
The next strategy is overbought oversold levels. Overbought means when the buyers’ activity reaches an extreme point. From that level, the trend may reverse downwards.
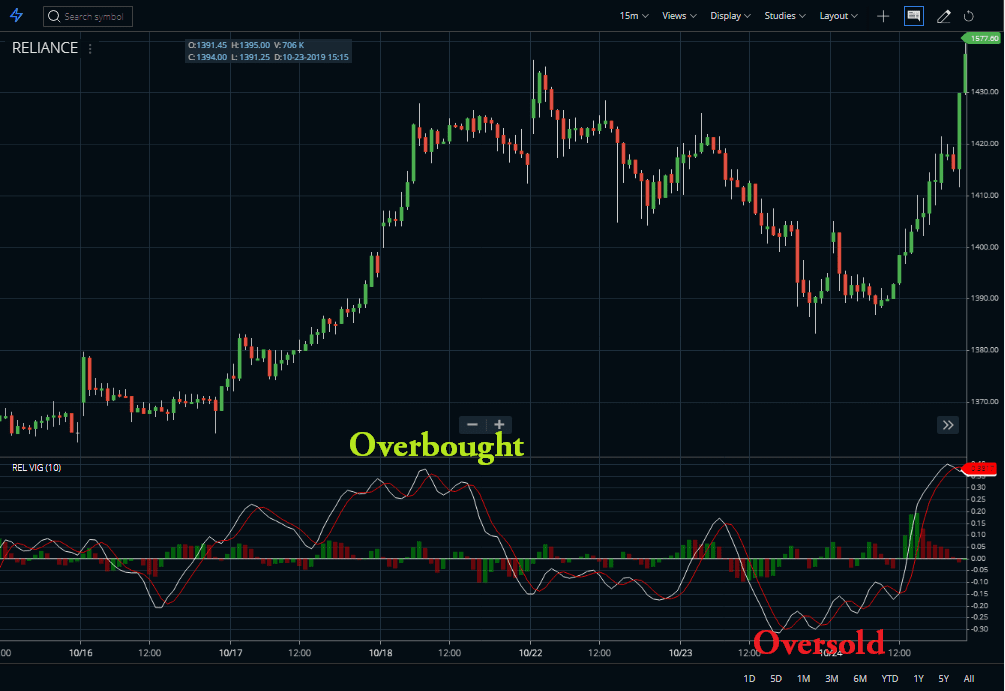
In the opposite way, when the indicator is at an oversold level, the sellers’ activities are highest. And, the trend is about to go up soon.
Zero Line Crossover
Here, the buy signal is produced once the RVI indicator is below zero levels and is heading up after the crossover of the particular indicator.
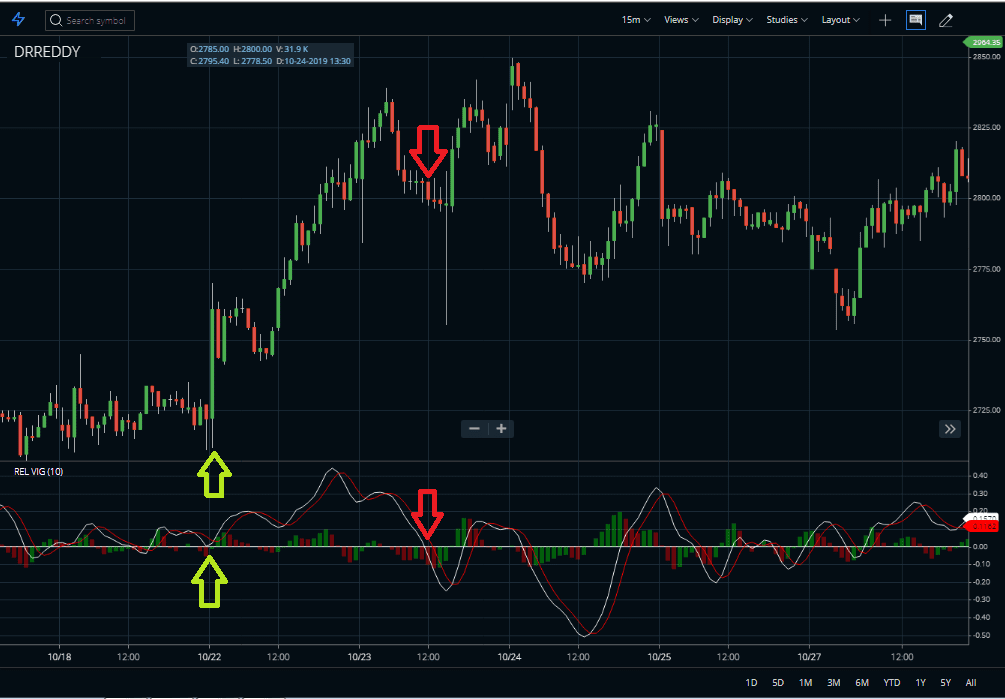
After crossing over of the Relative indicator occurs you just wait just for a bullish candlestick.
Then, place a buy-stop order at least 2 ticks above the high of that candle and place the stop loss 2-5 ticks below that candle’s low, or if that will be too close to the entry price, the place of stop loss just 2 ticks above the nearest swing low.
Therefore, aim for a take profit that is 2 or 3 times more than what the initial risk was, or if not use the prior swing high as one’s take profit target level. And even that, make sure it is 2 or 3 times more than what one risked initially.
Limitations of Relative Vigor Index
The Relative Vigor Index Indicator works best in trending markets while producing false signals in rangebound markets. So, improve results by setting longer-term lookback periods. And, in order to reduce the result of whipsaws and short-term countertrends.
FAQ
The default setting of 14 periods works well. For intraday trading, 5 to 10 minutes time frames work better.
An RVI indicator plots values along a separate window showing how bullish or bearish momentum is when compared to its recent past performance. It helps traders spot market reversals and follow trends in order to enter or exit trades at strategic points.
The Relative Vigor Index (RVI) signals are calculated by taking the ratio of today’s closing price with yesterday’s closing one on up bars or down bars relative to each other; then applying an exponential moving average on top of this ratio and subtracting it from 100%. This calculation creates two lines – Bull Power & Bear Power – which move in unison toward higher or lower levels depending on market sentiment conditions.
The RSI or Relative Strength Index measures differences in high & low prices over a given period while Relative Vigor Index (RVI) only looks at current days’ opening & closing prices over the importance constant value range as benchmarked against its previous day’s iterations – making it more sensitive than traditional RSIs across multiple markets including Forex, CFDs, Equities, etc.
Conclusion :
The Relative Vigor Index Indicator is classified as an “oscillator” since the values fluctuate between computed positive and negative values. In the bull market when the closing price is higher than this is the opening price. It is the other way around on the bear market. This RVI indicator has normalized the index to the daily trading range, dividing the change in price by the maximum range of prices for the day. In the RVI indicator, the concurrence of lines serves as a signal to buy or sell.
 Indicator Strategy")


Hello. Is there any screener which can filter Rvi crossover on live data. Example, you get notified when Rvi crossover happens on 5 minute time frame.
Thanks for such an amazing article.
Not seen anything like that.