Donald Dorsey developed the Relative Volatility Index (RVI) indicator. He actually understood that an indicator is not the holy grail of trading. The RVI indicator looks similar to the RSI or relative strength index. The basic difference is it measures the standard deviation (SD) of the high and low prices over a pre-defined range of periods.
What is the Relative Volatility Index (RVI)?
The RVI is a confirming tool, that helps to determine the market volatility. Many get confused between the Relative Volailiy Index and the Relative Vigor Index. The RVI indicator measures the relative volatility of the price compared to the previous period.
Calculation of Relative Volatility Index
The RVI indicator is calculated in a similar way as the RSI but using the standard deviation or SD of high and low prices rather than the absolute change in the price.
Usum = sum (u)/n.
Dsum = sum (d)/n.
where n is the bar period selected by a user.


- Usum is the average sum of STDs for positive days. If the close price is above the previous close, then u = STD (n) otherwise, u = 0.
- Dsum is the average sum of STDs for negative days. If the close is below the previous close, then d = STD (n) otherwise, d = 0.
How to Attach the Relative Volatility Index (RVI) Indicator to the Charts
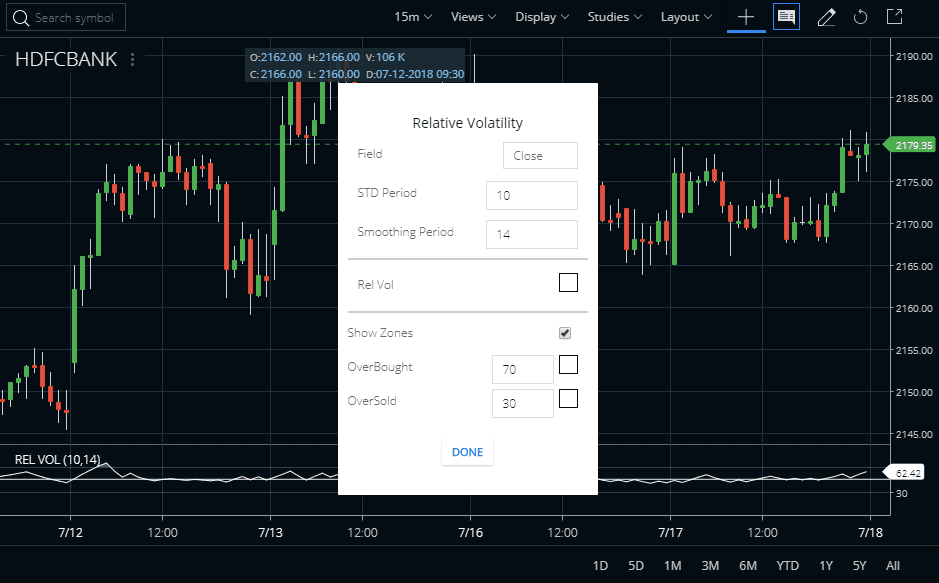
If traders want to know more about the indicator, then they can find it in the STUDIES section of Zerodha Kite. They can also use the Kite Mobile App to find out this RVI indicator. The Field is close and we can also set this. The STD Period is 10 and we can set it also. The Smoothing Period is 14 and we can change this value to high and low. Check the image below to understand how to attach the RVI to the HDFC Bank share price chart. You can attach this indicator to any charts like daily, weekly, monthly, or intraday.
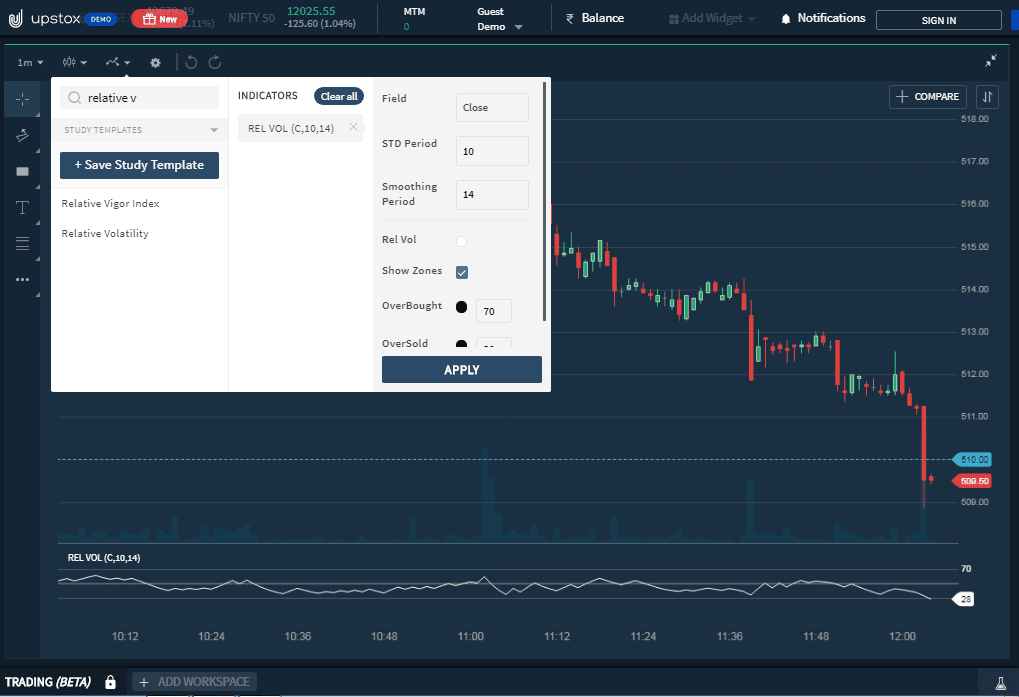
The next platform, I am going to describe is Upstox Pro. Here, I will show you how you can set up the RVI on your charts. First, open the chart and put the name of the indicator. After that, click on Apply.
How to Trade with the Relative Volatility Index?
Let us now discuss the various trading strategies using the RVI indicator.
Crossover of the 50 Line
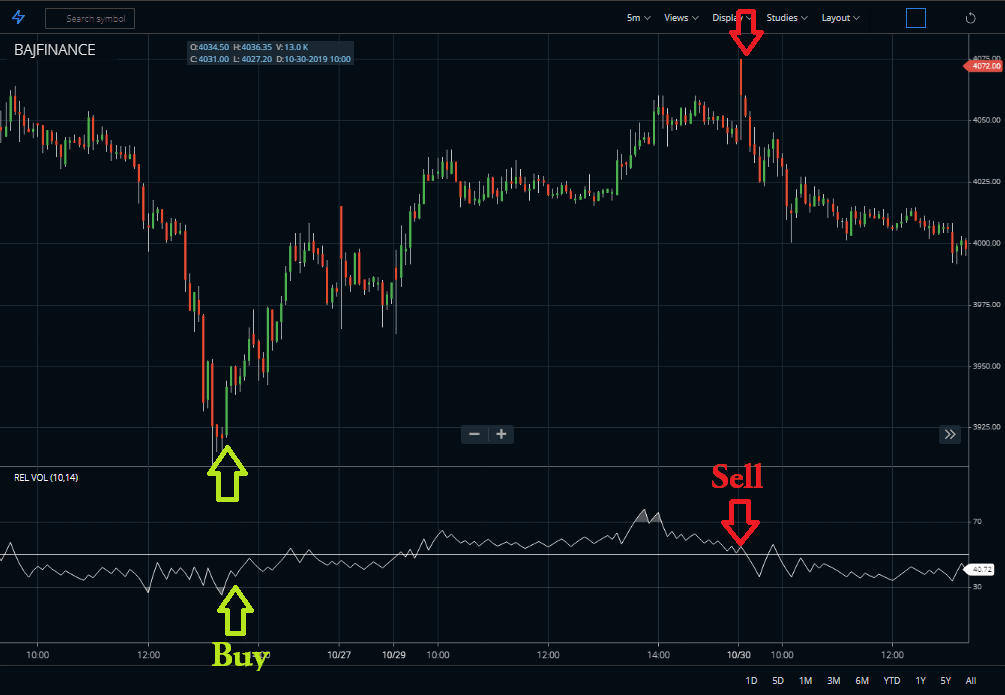
When the Relative Volatility Index (RVI) is above 50 it indicates that the volatility is to the upside, and when it is below 50, it indicates that the direction of volatility is to the downside. Thus, when the RVI is above 50, it confirms a potential buy signal; and when it is below 50, it confirms a potential sell signal.
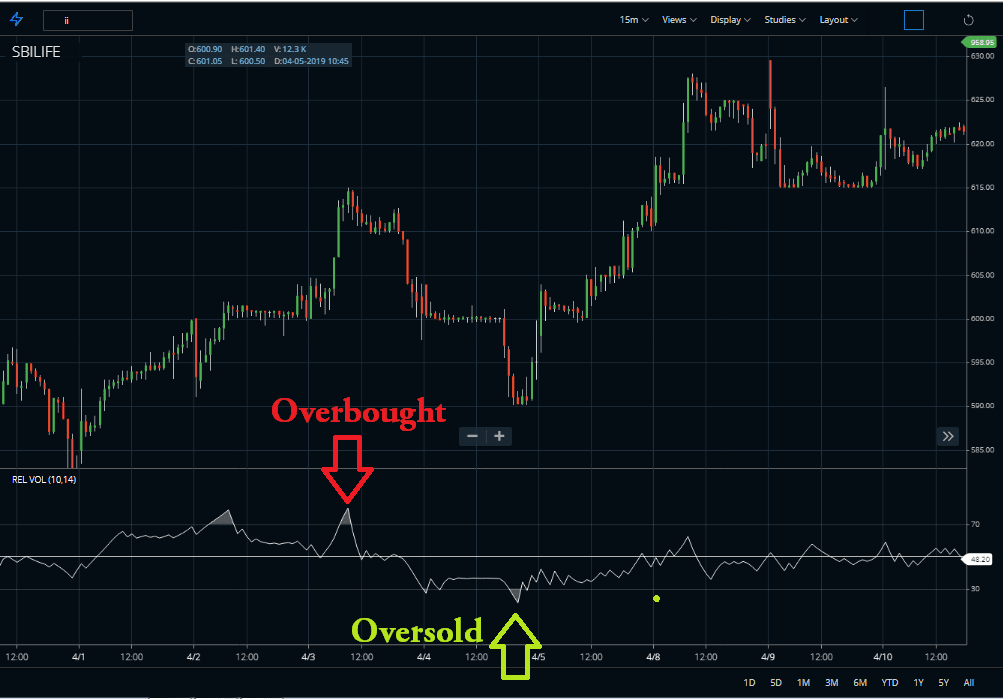
Using as an Overbought and Oversold Indicator
In some trading platforms, the RVI indicator is plotted around levels of 0 and 100 with the overbought and the oversold levels set to 70 and 30. This makes the indicator’s settings somewhat similar to the Stochastics oscillator or RSI (relative strength index) which also oscillates around the 70 and 30 levels.
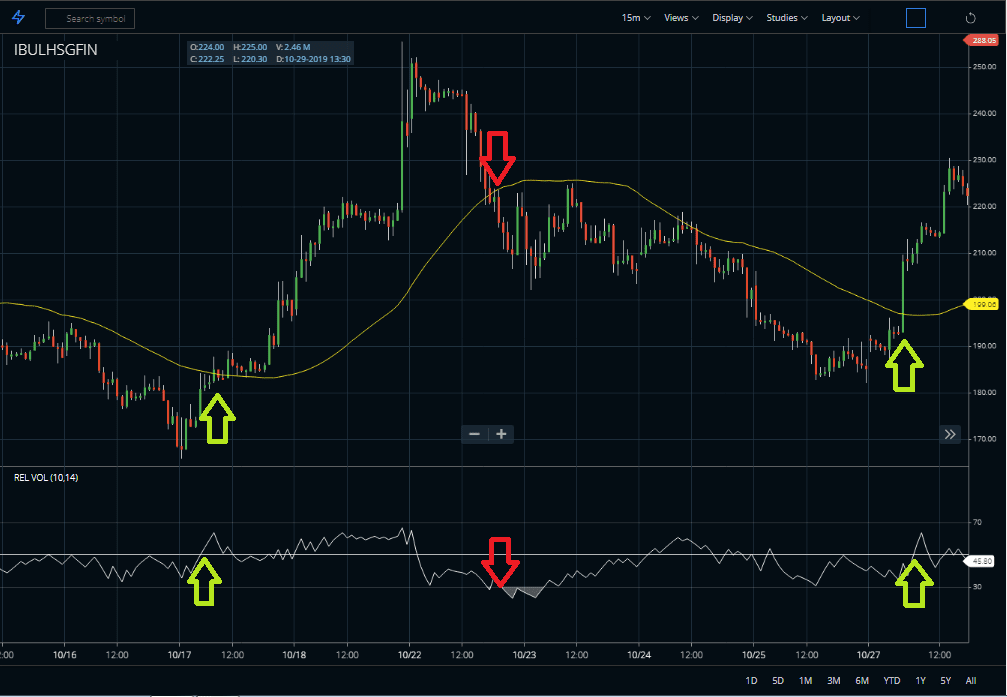
The indicator was not designed as a standalone indicator, but rather as a confirmation for trading signals. The Relative Volatility Index is most widely used in conjunction with moving average crossover signals.
Using a Moving Average
One of the significant benefits of this method is that the trading system provides enough time to react. Volatility does not rise and disappear within a limited period of time. Hence, depending on the bullish or the bearish positioning of the moving averages, one can simply just keep adding to positions and lock in good profits.
The way the RV index behaves is nothing different from other oscillators that one would more widely use. For instance, the peaks and troughs formed in the Relative Volatility Index are pretty much similar to what you would expect when using the relative strength index or the RSI indicator.
Buy and Sell Signals of Relative Volatility Index
- Buy if Relative Volatility Index (RVI) > 50.
- Sell if Relative Volatility Index (RVI) > 50.
- If a trader misses the first RVI buy signal buy when RVI > 60.
- If a trader misses the first RVI Sell signal sell when RVI < 40.
- When the RVI falls below 40 then close a long position.
- When the RVI rises above 60 then close a short position.
Features of the Relative Volatility Index
- The Relative Volatility Index behaves in a similar way as most oscillators do. Hence, the RVI can also signal multiple levels of volatility in the market.
- Once volatility rises, one can see that the indicator remains above the 50-level mark. However, you can see a peak above the 80-level as a strong indicator of volatility in the stock markets.
- Over many years, most traders have designed their own volatility based on useful trading systems. One of the facts with the indicator is that it can be applied to any market and multi-timeframe. As a result, this is one of the most popularly used indicators when it comes to day trading in the markets.
- On the other side, the Relative Volatility Index is not much available in many trading or charting platforms. So, one either needs to build one or create a customized indicator that can measure volatility as the RVI does.
- So, trading with rising and falling volatility can provide traders with an extra edge in the markets. This is possible by applying the Relative Volatility Index which is a simple yet effective tool to ride the volatility within the trend.
FAQ
The Relative Volatility Index (RVI) is an indicator used to measure the volatility of a stock or index. It helps investors and traders identify trends, assess market conditions and make decisions regarding their investments.
RSI (Relative Strength Index) measures the speed and change of price movements, while RVI (Relative Volatility Index) measures changes in underlying volatility. Both indicators are important for analyzing future prices movement but they have different uses.
The Relative Volatility indicator can be used to detect emerging trends by tracking patterns such as widening spreads or shifts in momentum among other signals. Once identified these signals could suggest that the trend may continue resulting in potential buying opportunities along with increased profit margins from trades entered at current levels.
The RVI volatility indicator compares recent market activity with historical price data to indicate relative strength over time periods which allows traders to gain insight into what direction investor sentiment might be headed next, whether it’s up, down, or sideways markets!
Conclusion
In conclusion, the Relative Volatility Index is a simple but efficient market indicator that helps to measure the rise and fall in the volatility of an asset. Many traders use the particular index in the stock as well as the futures markets, but you can also apply this to the forex markets too.


