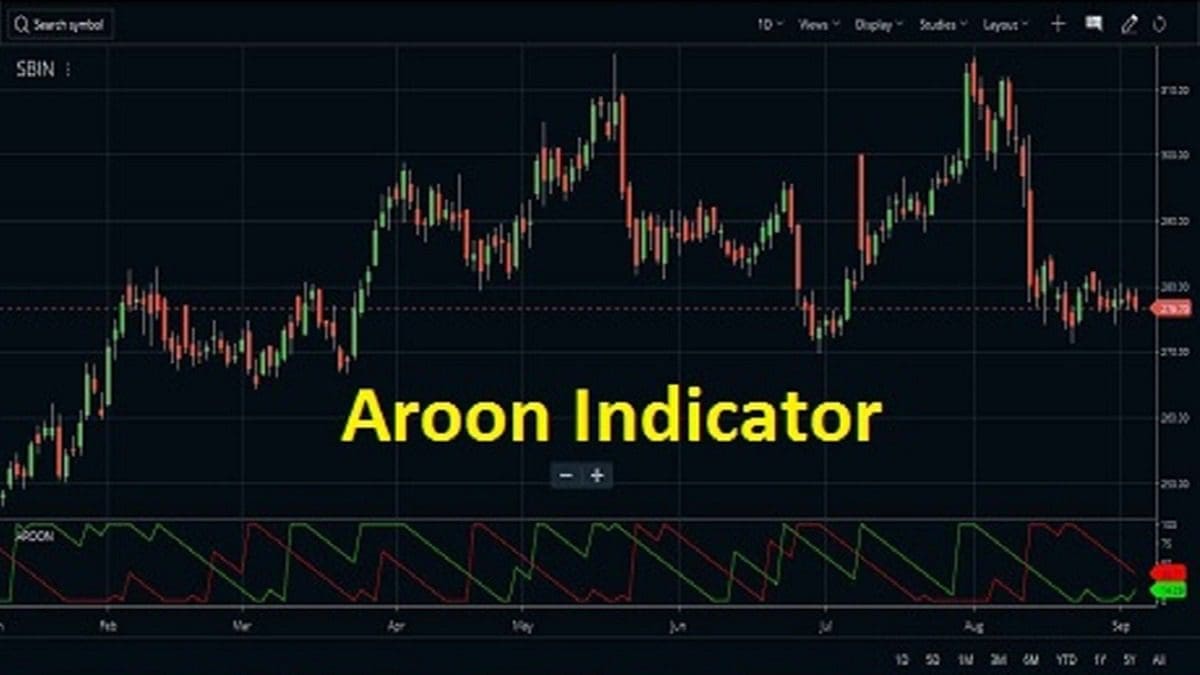
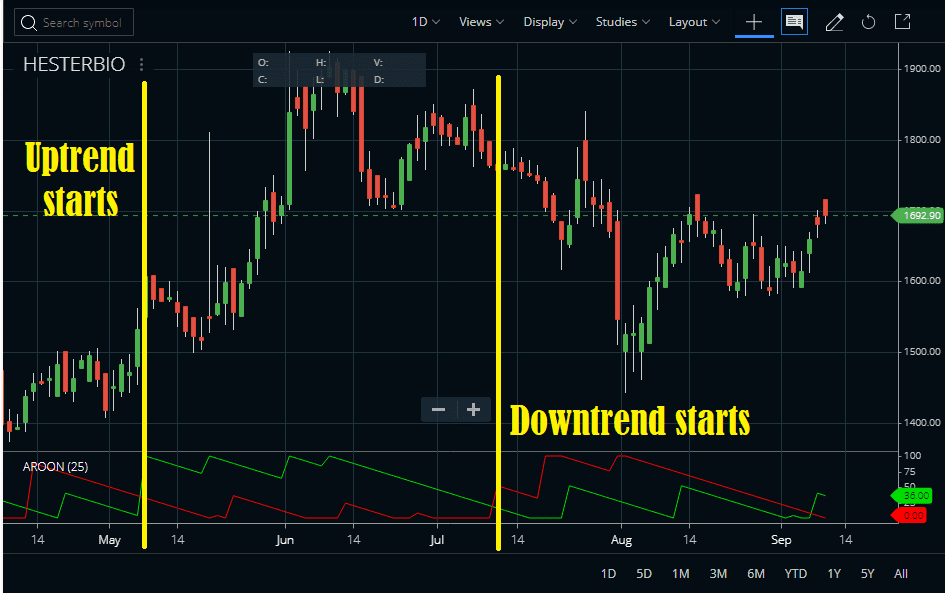
The Aroon indicator was developed by Tushar Chande to determine the price trend of a stock and also to understand how strong is the trend of the stock price. There are two lines in the indicator. The green line shows an uptrend and the red line shows a downtrend. The green line is known as Aroon Up and the red line is known as Aroon Down. When any of the lines touch 100, it indicates the trend is going to reverse. Similarly, when any line touches zero it also shows the imminent trend reversal. A combined reading of the up and down lines gives the real market trend.
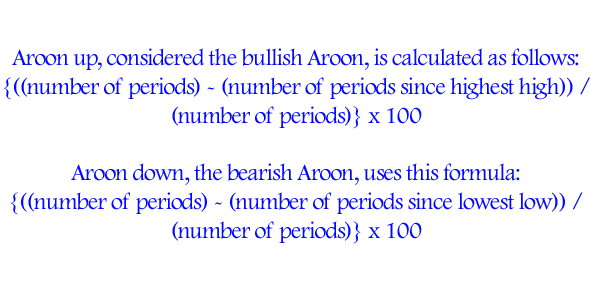
Arron Indicator Formula
How to set up the Aroon indicator on a chart?
Nowadays, this indicator is a part of the studies of various easily available trading platforms. Most brokers have added this indicator to their arsenal. A few major platforms that have the Aroon Indicator are Zerodha Kite and the Upstox Pro platform.
Zerodha Kite
Time needed: 1 minute
How to attach the Aroon indicator on Zerodha Kite charts
- Open the stock chart
You must log in to Kite and select your MarketWatch. Then select the stock you want to trade. Next, right-click on the stock and select its chart from the graphic icons. The chart window of the stock will open.
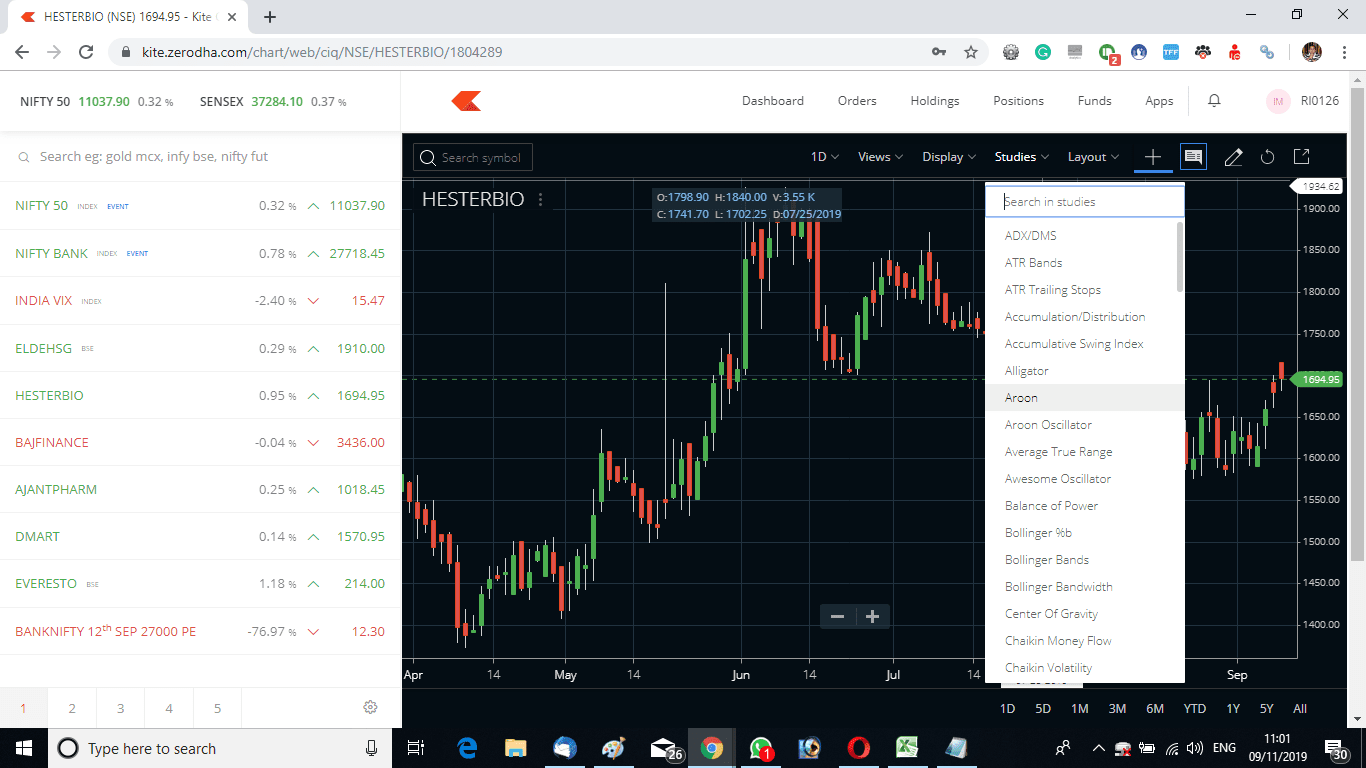
- Select the indicator from the studies
Now go to the studies section by selecting studies. Go to Aroon and click on it.
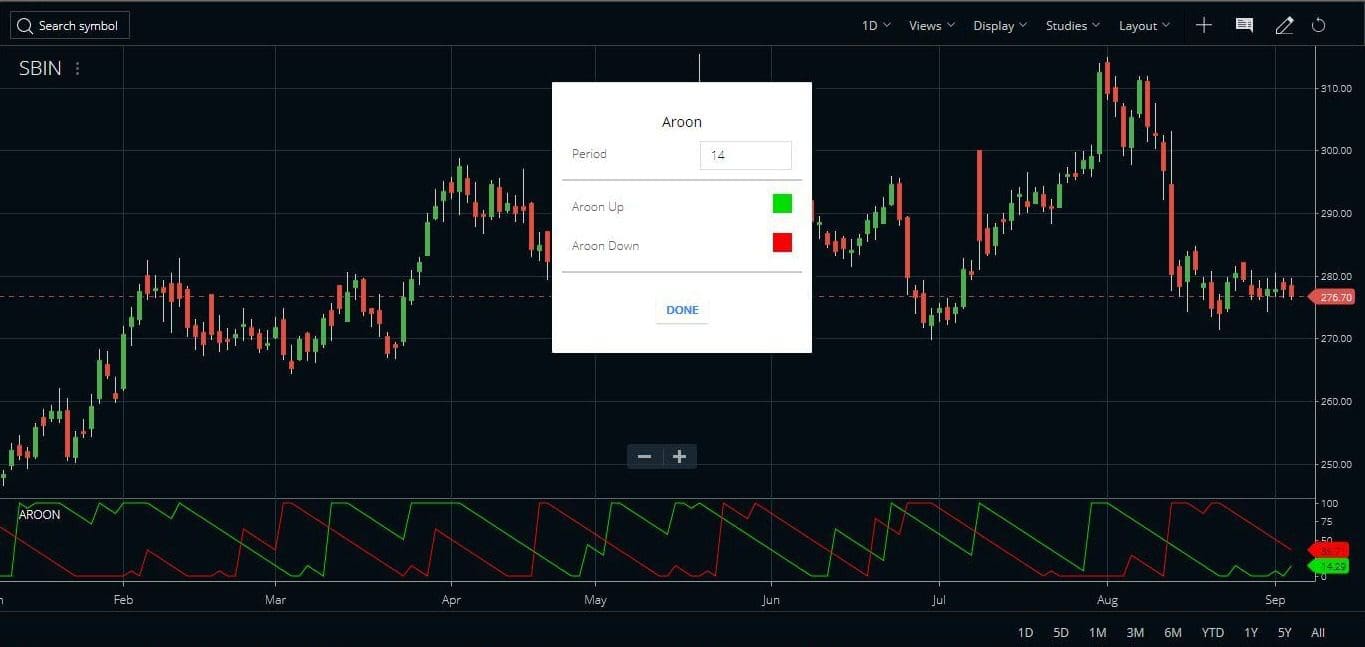
- Attach the indicator on the chart
A small window opens with the default parameters of the indicator. Once we select the desired parameters and choose the Done command, the parameters window goes off the screen and the indicator is plotted on the stock price. The default values can be changed as per our own requirements. By default, the Aroon indicator considers a 14-period for plotting the chart.
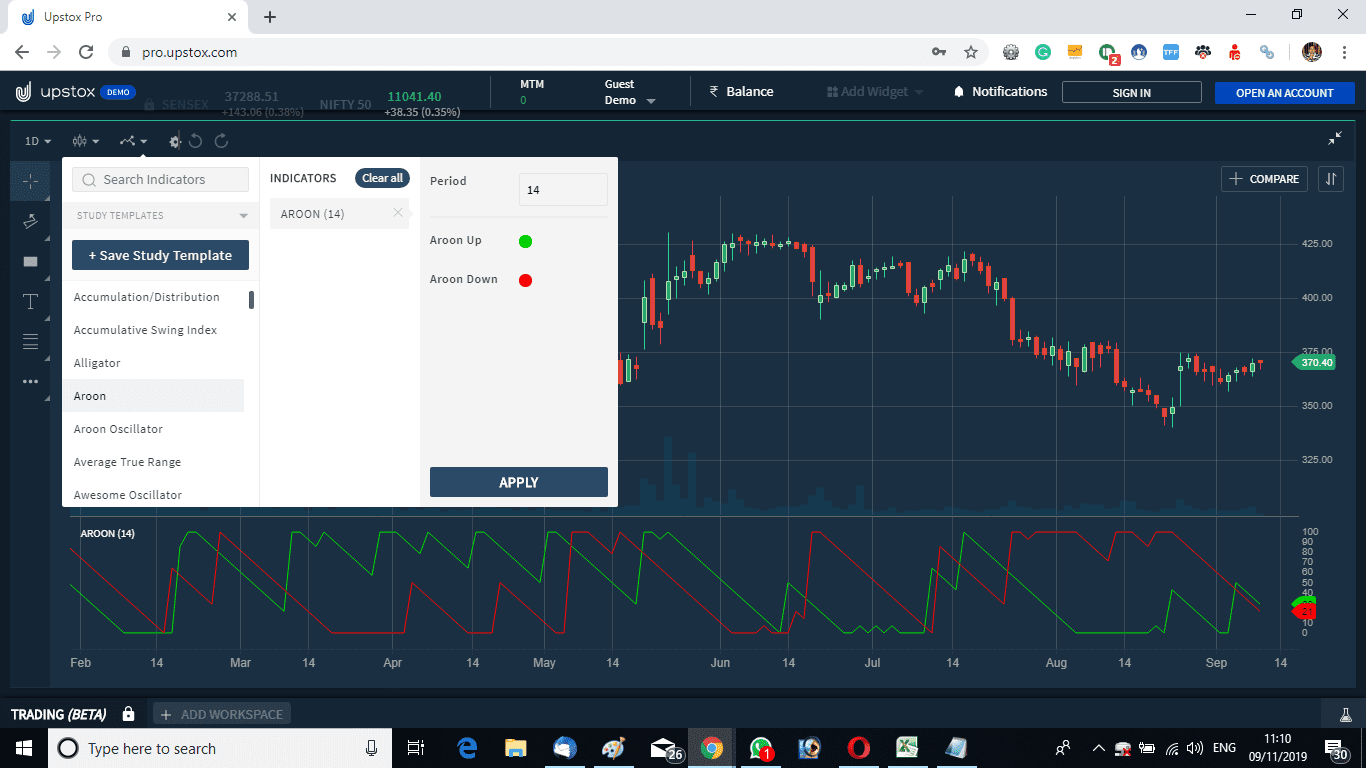
Upstox Pro
In a similar fashion, the Aroon indicator can be attached to the Upstox Pro terminal also. Check the image below to understand how to add this to the RKSV terminal.


Aroon Indicator FAQ
Aroon was developed by Tushar Chande. This indicator identifies an uptrend or a downtrend. And just like the ADX/DMS, this indicator also identifies how strong the trend is.
There are two lines in this oscillator. One is Aroon Up and another is Aroon Down. Aroon Up is calculated by the number of periods minus the number of periods since the highest high is divided by the number of periods multiplied by 100. Similarly, the Aroon Down is calculated by the number of periods minus the number of periods since the lowest low is divided by the number of periods multiplied by 100. Check the formula section above on this page.
In Zerodha Kite or other trading terminals, the default setting for Aroon is 14-period. But I have checked that changing this default to 25 minimizes the whipsaw to a large extent. Check the attached image. Remember you can play with the parameters and tweak the defaults as per your need. If you find a reliable parameter do share it with the blog readers in the comment box below.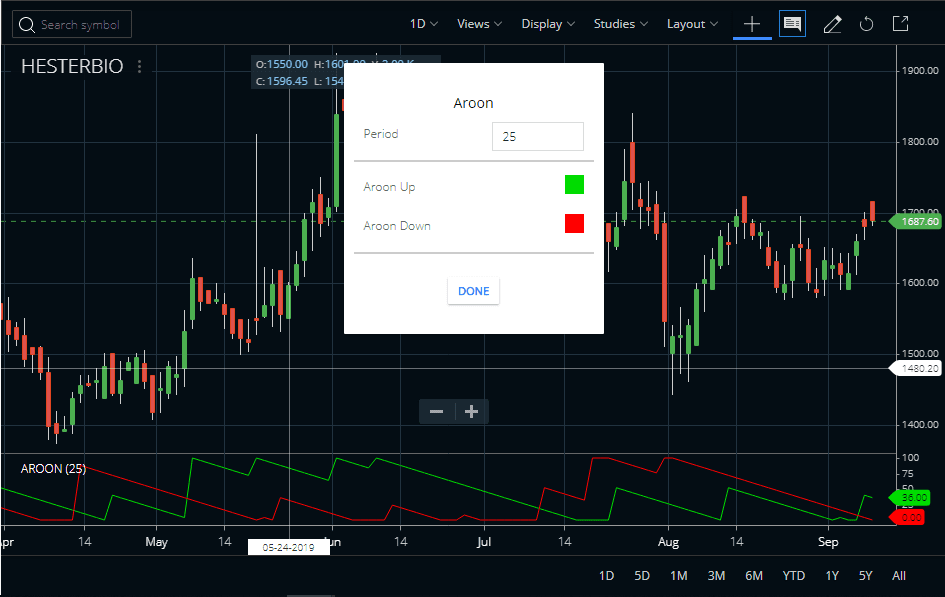
Aroon indicator strategy
- The Aroon indicator works well in all time frames.
- The picture above shows Britannia Industries’ stock price movement with respect to the indicator.
- This is a chart of 5 min. timeframe.
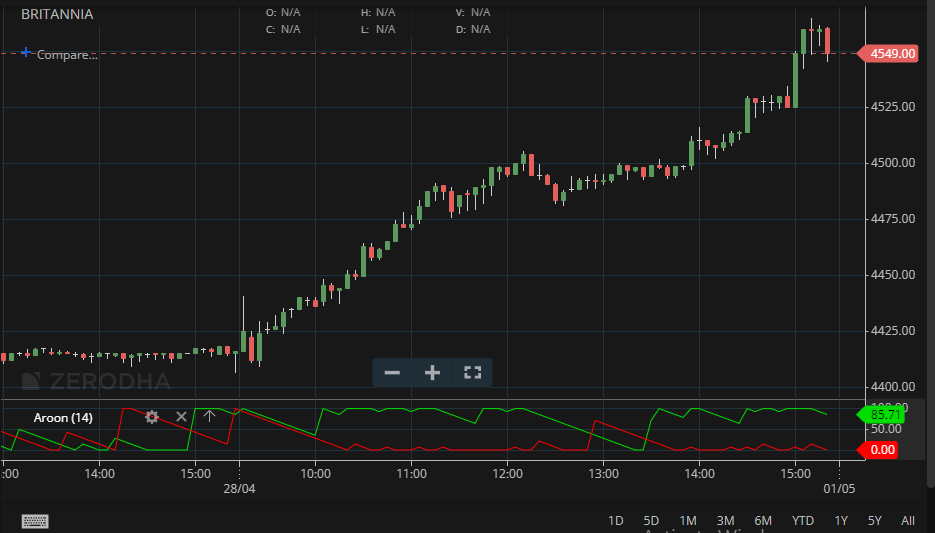
- A long position is created when the green line or Aroon up line touches starts moving up from the zero lines and the red line or the Aroon down line starts falling from the 100 marks.
- When the green line touches 100 it is still an uptrend till it stays at 100
- If the green line is at 100 and the red line is near zero it is a strong trend on the upside.
- The long position is closed when the green line starts coming down from 100. A strong downtrend is when the green line touches zero and the red line touches 100 showing trend reversal.
- As a thumb rule till the green line is above the red line, it is an uptrend and when the red line moves above the green line it is a downtrend.
- Traders can trade this indicator using these rules.
Combining with other indicators
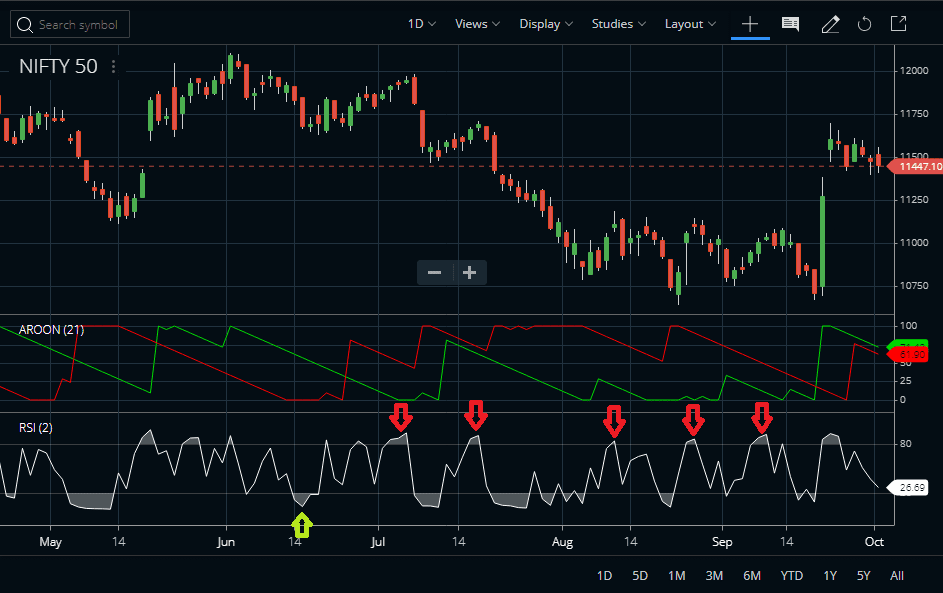
The Aroon indicator can be combined with other indicators like the Relative Strength Index. We can trade a 2-period RSI with this indicator. When the Aroon indicates an uptrend buy all RSI dips and when the Aroon indicates a downtrend short sell all RSI rallies. Check the image below to understand the strategy better. Remember, I have denoted the entries on the image as per the strategy. You need to exit using some money management rules. Or you can exit when the RSI moves back from the extreme to neutral zones.
Suggested Reading
There is no particular book available on only the Aroon indicator. But you can read Technical Analysis from A to Z, 2nd Edition which covers almost all major indicators.
Aroon Indicator PDF
Here we provide you with a PDF file that covers some of the secret trading strategies using the indicator. You can download the PDF by clicking here. This PDF has been prepared by Jay West.
Conclusion
The Aroon indicator can be an effective tool for traders to identify possible price trends and measure the strength of a trend. It is also useful in analyzing the possibility of reversal or continuation, as well as spotting potential entry and exit points. The main benefit of this technical indicator is that it helps users form insights into future stock prices based on examining past behaviors. This versatile tool may potentially offer many benefits for different types of investors looking to maximize their profits within the market.
Aroon works well in both the bull and bear markets. Traders can use this indicator as an alternative to the ADX or along with the ADX indicator.


