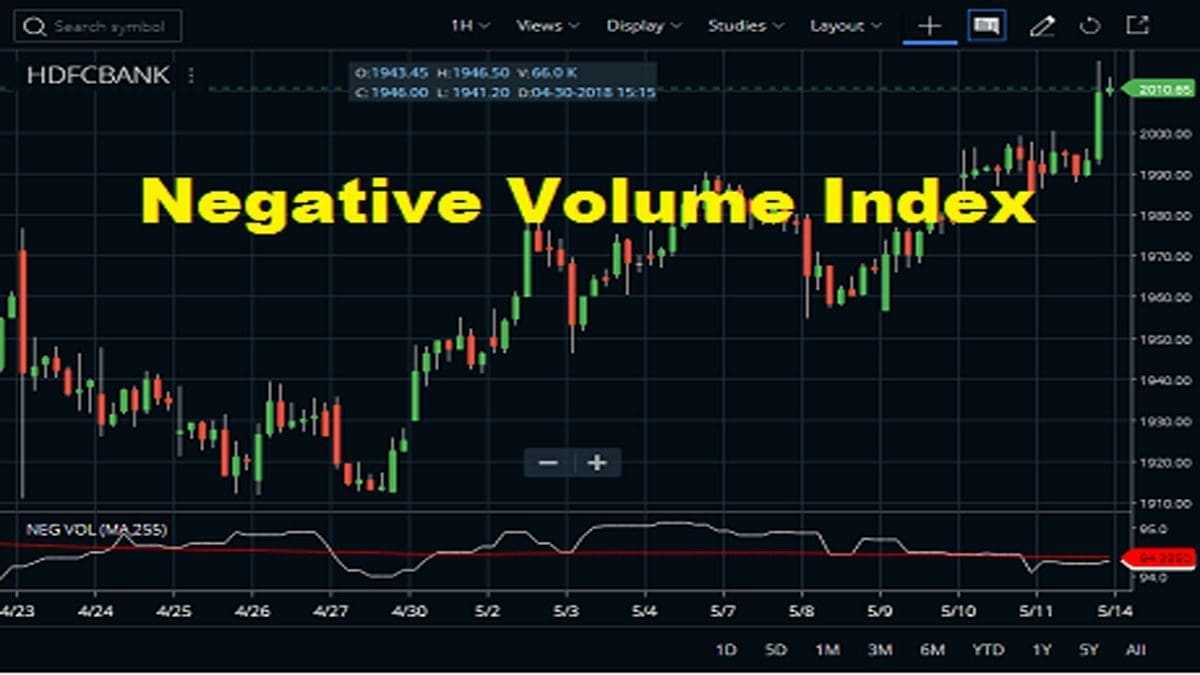
The Negative Volume Index indicator or NVI is a cumulative indicator. It uses the change in volume to decide when the smart money is active. This indicator is first developed by Paul Dysart in the 1930s. The Market Technicians Association selected Dysart for its annual award in 1990. This indicator works under the assumption that smart money is active on days when volume decreases. Also, it works under the assumption the not-so-smart money is active on days when volume increases.
Negative Volume Index Indicator FAQ
The negative volume index is a trendline that can help an investor to follow how a security’s price is changing with the effects of volume. The NVI is higher when the price is increasing with decreased volume and vice versa. This means a large number of investors are investing in it.
Negative Volume Index is one of the oldest indicators, used in modern-day charting. Basically, the negative volume is a technical indication line that uses to identify the market trend and reversal.
Positive Volume Index (PVI) measures the amount of trading activity in a particular stock by comparing day-to-day volume. If today’s volume is higher than yesterday’s, then PVI is positive. Conversely, if today’s volume is lower than it was the day before, then Negative Volume Index (NVI) applies and consequently signals the bearish state of the market. It typically indicates liquidity flow has shifted from buyers to sellers over time as investors become more pessimistic about future prospects.
How to Calculate the Negative Volume Index?
Negative Volume Index (NAI) calculation can be done through some quick and straight steps. It has a formula:
NVI= PNVI+(TCP − YCP/YCP×PNVI)
- Here, PNVI= Previous NVI
- YCP= Yesterday’s closing price
- TCP= Today’s closing price

To calculate the Negative Volume Index, compare the current day’s volume to the previous day’s volume. When today’s volume is greater than yesterday’s volume then today does not qualify as a Negative Volume day. Therefore, today’s net price change is assumed to be zero then it remains unchanged at yesterday’s level. But, if today’s volume is less than yesterday’s volume, then today does qualify as a Negative Volume day.
How to Attach the Negative Volume Index on Charts?
Here, you will get step-by-step guidance on the usage of the indicator with different trading platforms. Let’s start with Zerodha Kite.






On Zerodha Kite
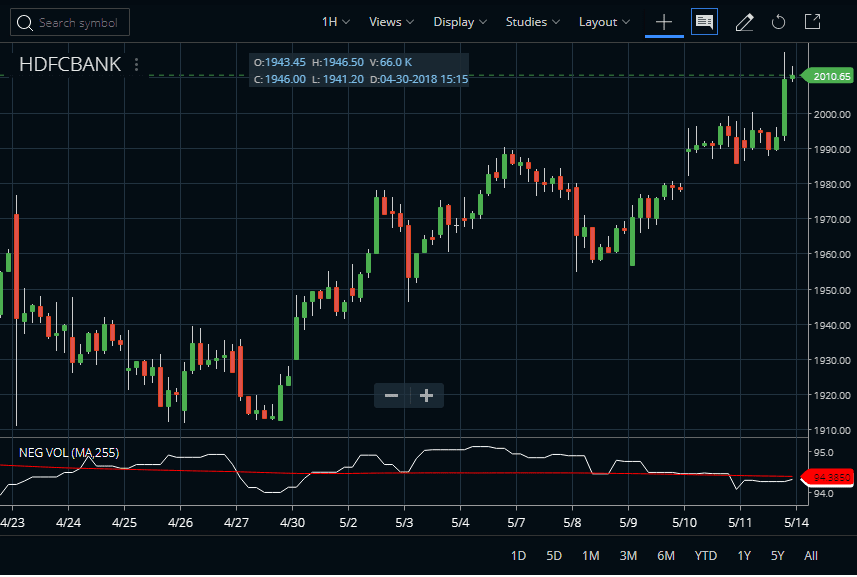
The Negative Volume Index indicator can be found in the STUDIES section in the Zerodha Kite browser app as well as in the Kite mobile App.
We can attach the NVI indicator to any charts of Zerodha Kite- be it daily, weekly, monthly, or intraday. Check the image below to understand how we attached the NVI indicator in the HDFC Bank share price chart and what are the default parameters for NVI. The Periods are 255 and we can set the price field open, high, low, or close. The default Moving Average Type is simple. However, traders can change the PERIOD and Moving Average Type and Field at their convenience.
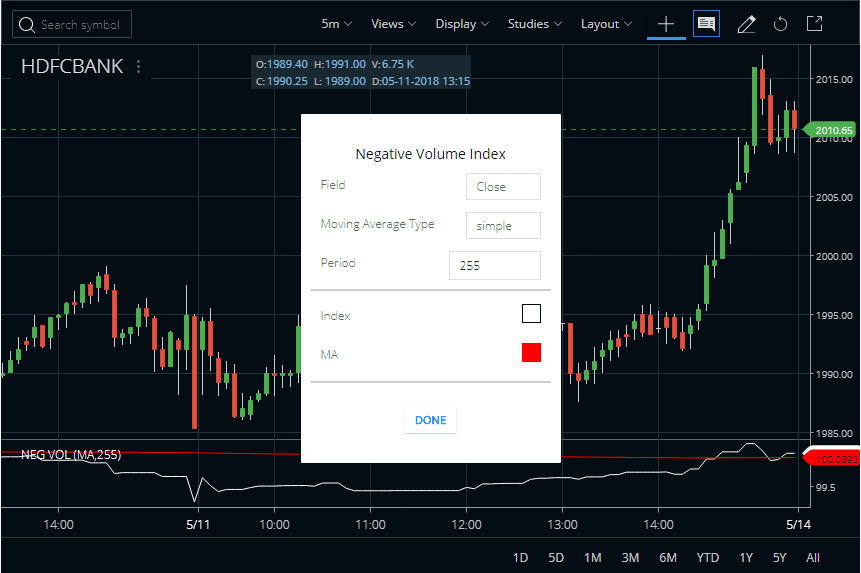
We may calculate the Negative Volume Index for any time interval, such as minutes, hourly, daily, weekly, and monthly. Traders may calculate this indicator using any market index, stock, or commodity, as long as there is data for closing price and volume.
On Upstox Pro
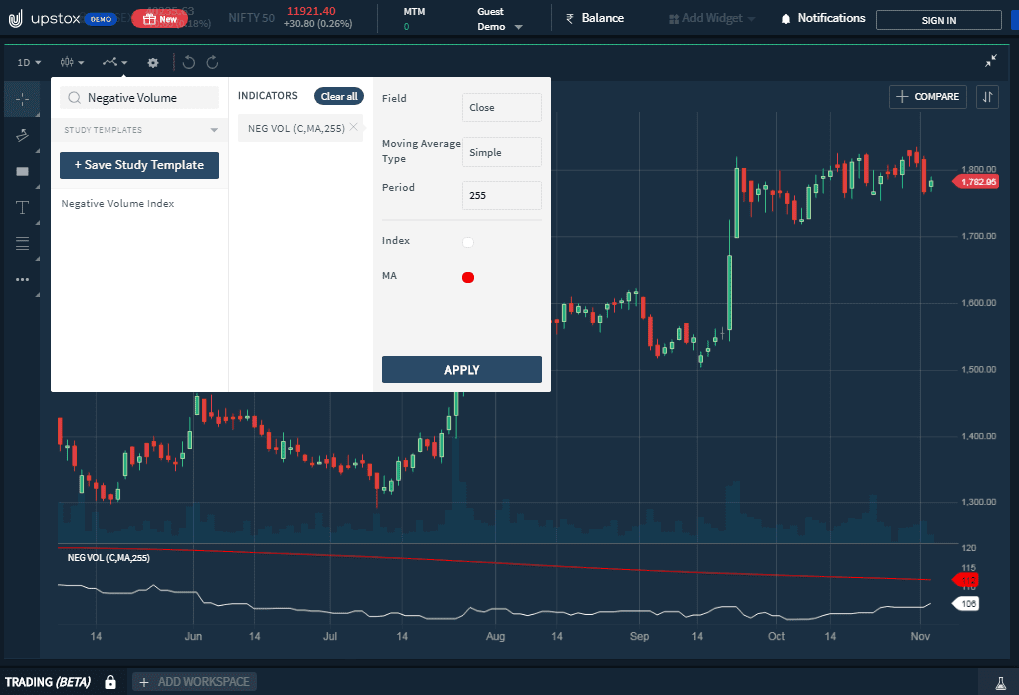
Now, let’s check the Upstox Pro platform. First login your account, then open any of your preferred charts. After that, open the indicator section, there search for the Negative Volume Index indicator. If you want to do any customization, you can do it with the available options. Lastly, click on the Apply option to get the indicator on your chart.
Negative Volume Index Indicator Technical Strategy
Now, come to the most vital part of the content, Negative Volume Index Indicator Technical Strategy. Here, first, have a look a the most simple strategy co-related with volume.
Simple Trading Strategies
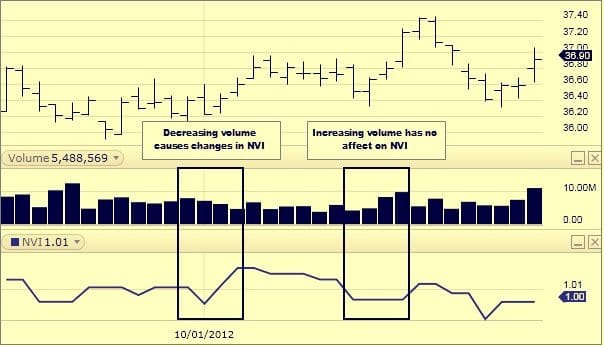
Look at the picture, here, NVI (Negative Volume Index) rises on days of a positive price change on lower volume. On the other side, NVI falls on days of a negative price change on lower volume. Besides this, NVI is unchanged on days of higher volume no matter what price action moves.
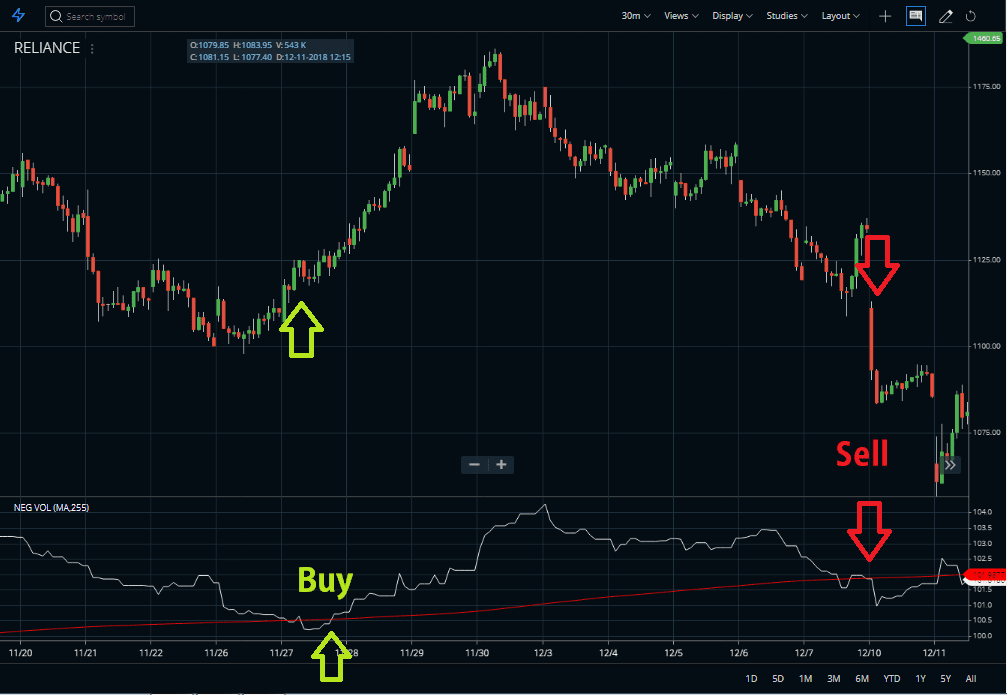
Here, comes the 2nd strategy. As you know, the red line is a 255-period simple moving average. When the index line crosses the MA line from below and goes above it, the bullish trend is coming forward. Hence, you can buy or take the entry from the crossing level. The exact opposite scenario happens during a bearish trend. When the index line crosses the MA and goes below it, sellers can take entry there.
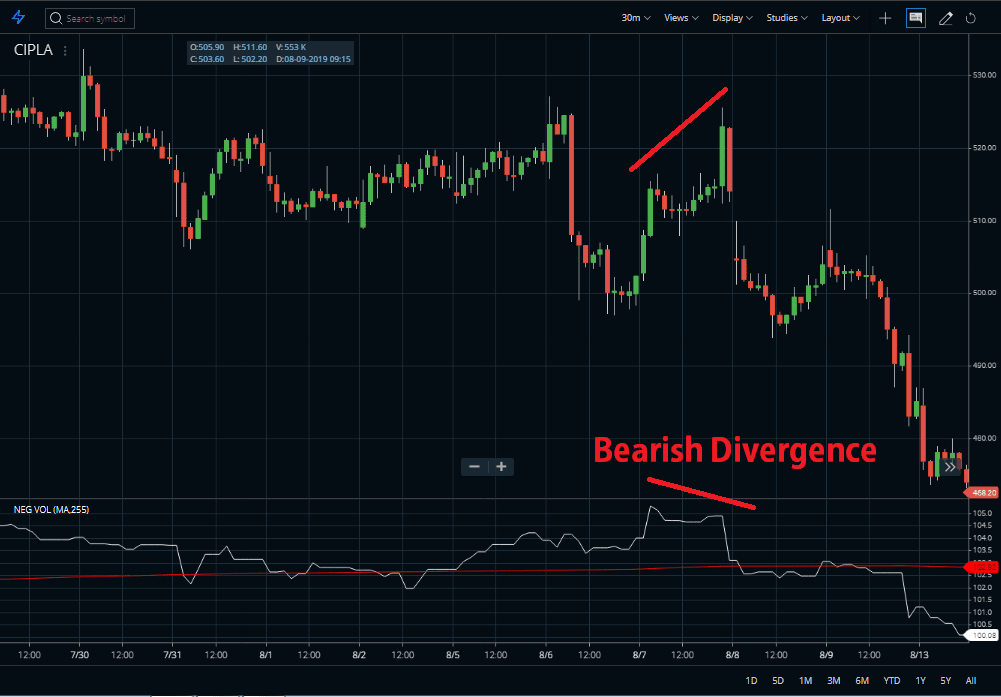
Divergence in Negative Volume Index
The next strategy is Divergence. Divergence happens when price and index direction do not match one another. Like the above picture, when the price makes higher highs but the indicator makes a lower low, the price is going to slow down.
Features of the Negative Volume Index
- The NVI combines both price inputs as well as volume to form an indicator of when so-called smart and not-so-smart money is active.
- Generally, markets moving off high volume are virtually ignored by the NVI indicator.
- The indicator should not be traded in isolation. All indicators should be used in other methods of technical analysis.
- The Negative Volume Index measures volume on the points where the volume is less than the previous point.
Conclusions
The Negative Volume Index is a hybrid indicator. It combines inputs from Paul Dysart and Norman Fosback. They designed this indicator for broad market indices and exchange volume. In the Negative Volume Index, the counts’ price changes when volume decreases, and the discounts price changes when the volume increases. Traders can use this technical indicator on stocks and ETFs, but NVI does not always act as expected. The Negative Volume Index will produce some great bullish/bearish divergence signals with some stocks. Traders should not take decisions only on the basis of NVI, as with all indicators.