The Advance/Decline (A/D) line is a market breadth indicator that mainly shows the degree of participation of individual stocks in a market rise or fall. Mainly, it plots the difference between the number of advancing as well as declining stocks on a daily basis. So, first, let’s see the definition of the indicator, and then I will move to the usage and settings.
What is the Advance-Decline Indicator Line (A/D)?
This advance/decline (A/D) line shows market sentiment, as it tells traders whether there are more stocks rising or falling. We can use this line to confirm price action trends in major indexes, and can also warn of reversals when divergence occurs. Basically, The Advance-Decline Line is mainly a breadth indicator based on Net Advances. That is the number of advancing stocks is less than the number of declining stocks.
How to Calculate the Advance/Decline Line?
The actual value of the AD Line generally depends on the starting point for the calculation. Since this has to start somewhere, so the first calculation for the AD Line is simply Net Advances for one period. We can calculate subsequent values using the AD Line value for the past period’s value plus Net Advances for the current period.
Subtract the number of stocks that finished lower on the day from the number of stocks that finished higher on the day. This will give you the Net Advances. If this is the first time calculating the average, the Net Advances will be the first value used for the indicator. On the next day, calculate the Net Advances for that day. Add to the total from the prior day if positive or subtract if negative. Repeat steps one and three daily basis.
The Formula of the AD line
Advance/Decline line (A/D) = Net Advances + { Previous Advances, if Previous Advances value exists or 0, if no Previous Advances value
Where:
Previous Advances = Prior indicator reading. Net Advances = Net Advances is the difference between the number of daily ascending and declining stocks.


How to Add the Advance/Decline Indicator to Charts?
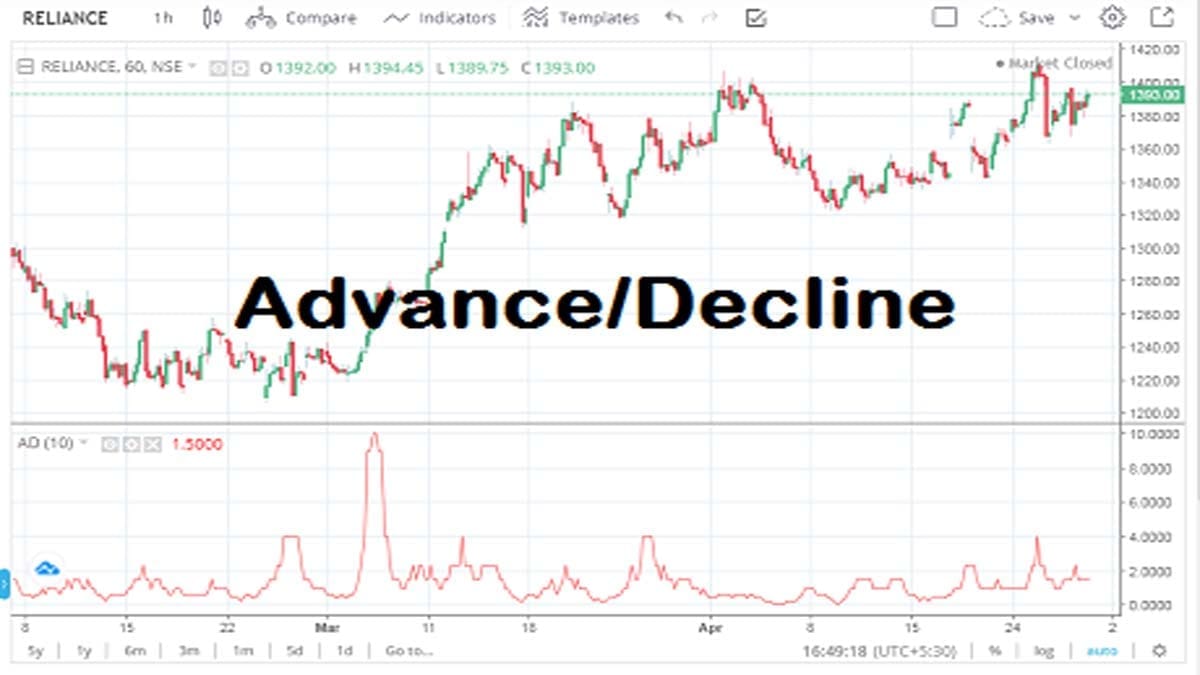
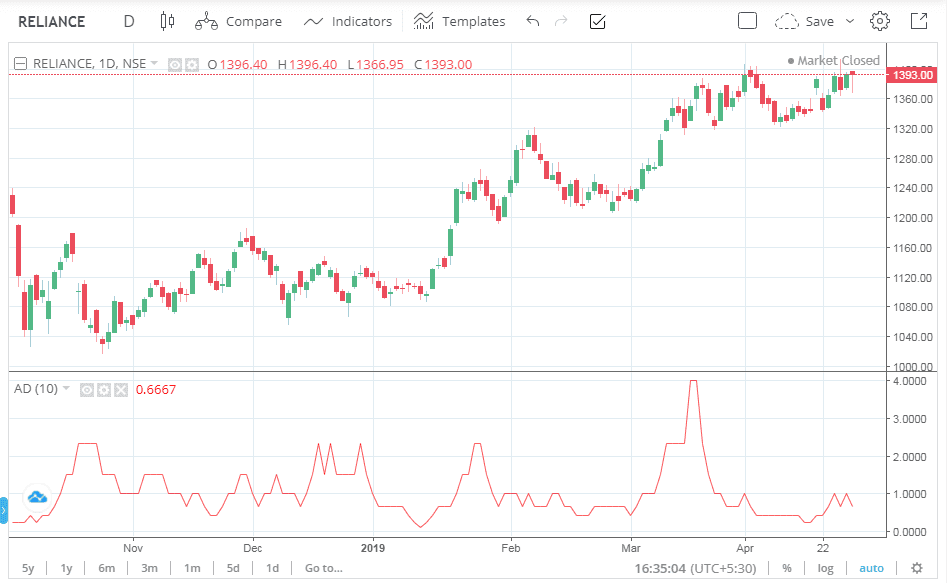
The traders can find the Advance/Decline indicator In the Zerodha Kite platform, under the STUDIES section. Zerodha has two charts set up, one is a TradingView and the other is ChartIQ The Period is 10 and if you can change this value then you can change it. The traders can check how they attached the indicator in the Reliance Industries shares price chart. The traders can attach the Advance/Decline indicator to any chart like daily, weekly, monthly or even intraday.
Trading Strategies for the Advance Decline Indicator
This advance/decline line (A/D) is a breadth indicator that is used to show how many stocks are participating in a stock market rally or decline.
Trading Strategy Based on the Slope of the A/D Line
When major indices are rallying, a rising advance/decline line (A/D) confirms the uptrend showing strong participation. On the other hand, if major indices are rallying and the advance/decline line (A/D) is falling, it shows that fewer stocks are participating in the rally. This means the index could be nearing the reversal or the end of its rally.
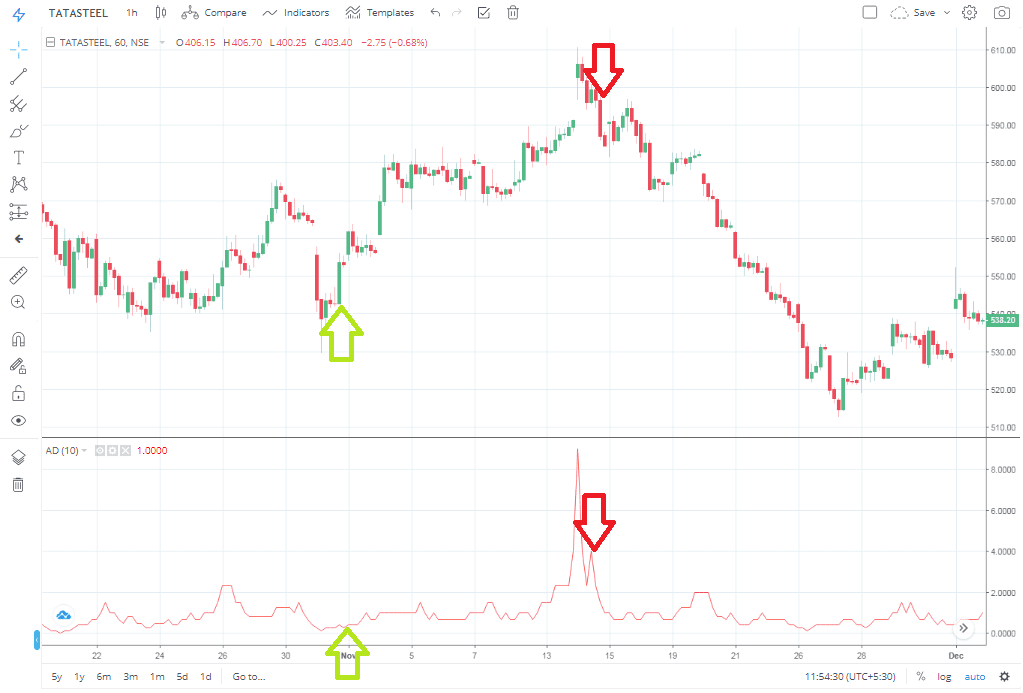
Similarly, when major indices are declining, a falling advance/decline line (A/D) confirms the downtrend. If major indices are declining and the A/D line is rising, fewer stocks are declining over time. This means the index may be near the end of its decline.
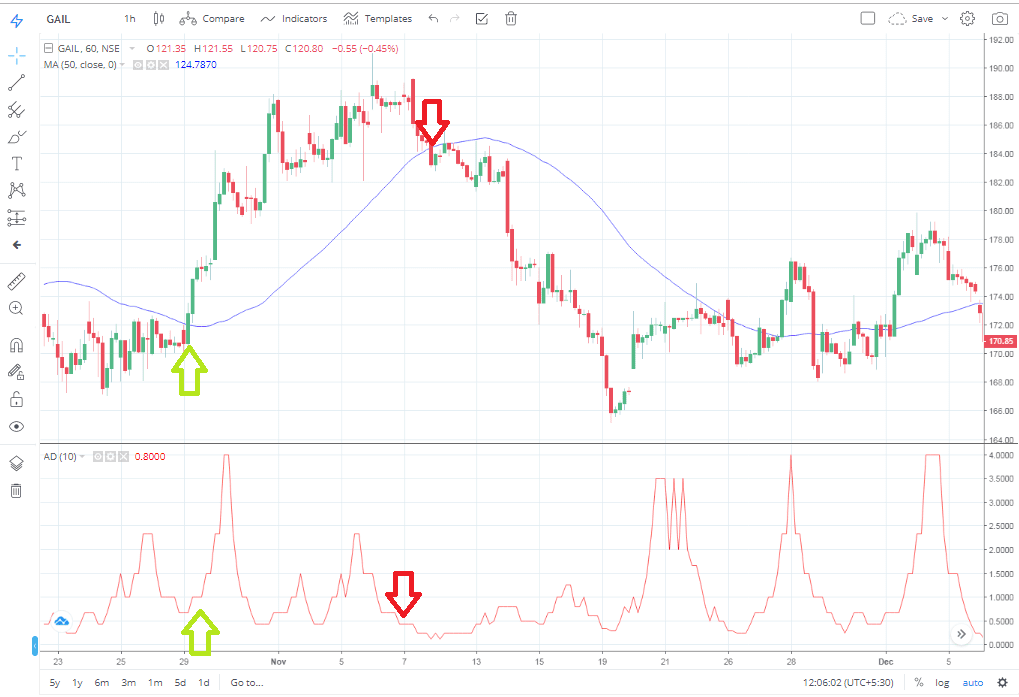
Adding a Supporting Indicator to Create a Strategy
Here, I have added a 50 Moving Average along with the Advance/Decline indicator. I take the buy signal once a big bullish candle crosses the MA line from below. And the AD line moves in an Upward direction. The reverse pattern happens during the sell signal.
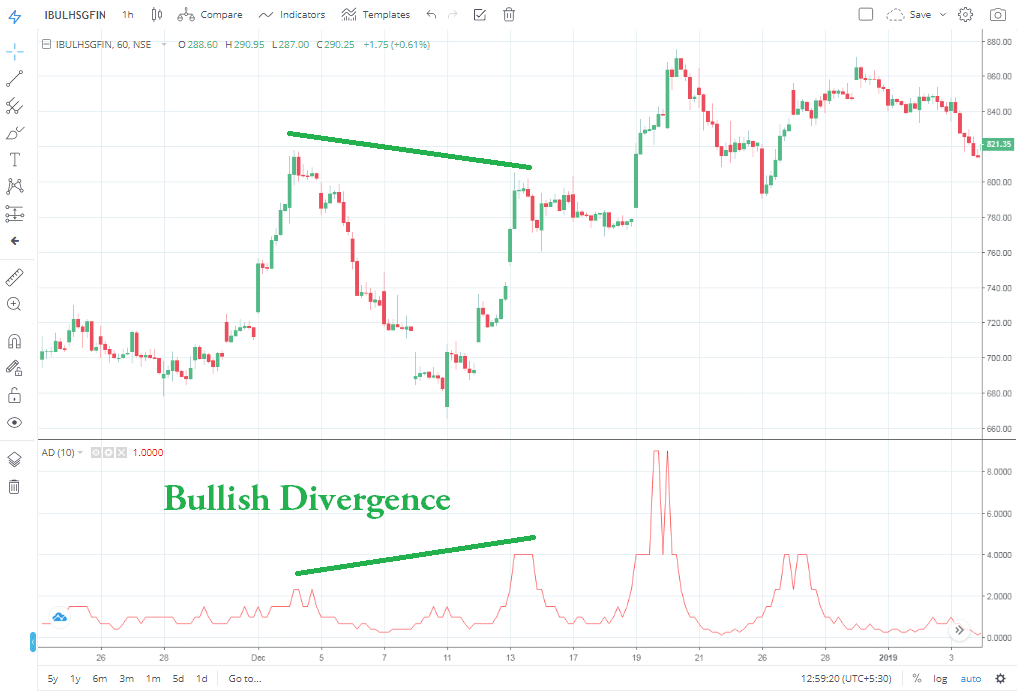
Trading the Divergence
We can also trade divergence with this indicator. A bullish divergence forms when the advance/decline line (A/D) fails to record a lower low along with the security price.
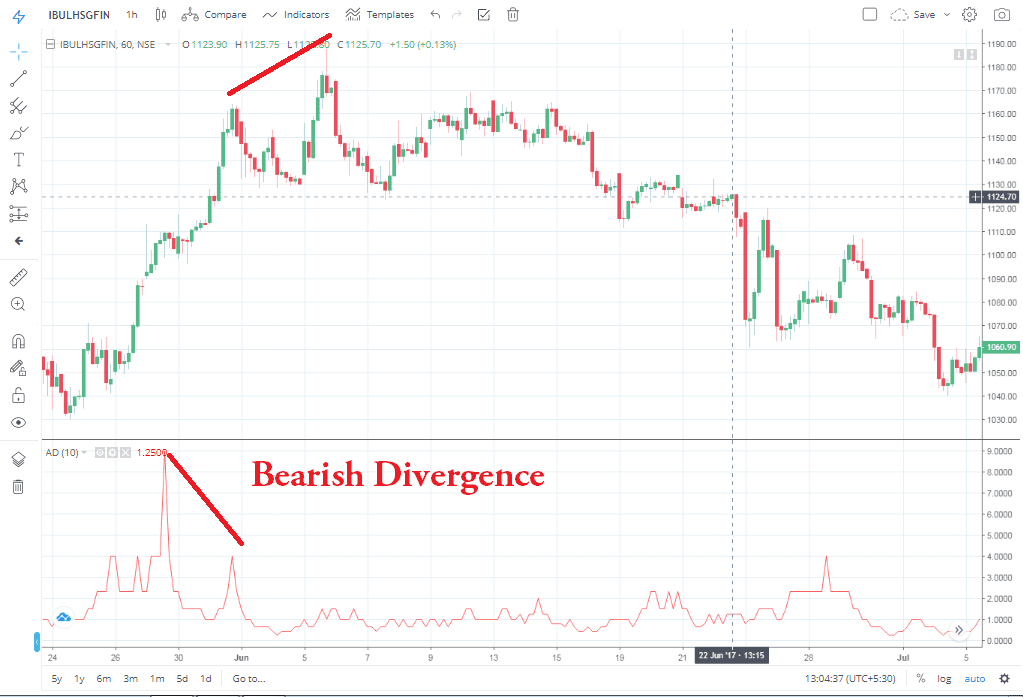
The next example I am going to place is bearish divergence. In it, the price makes higher highs but the indicator makes lower lows.
Limitations of Using the Advance/Decline Indicator
Another thing to be aware of is that some indexes are market-capitalization-weighted. This means that the bigger the company the more impact they have on the index’s movement. The advance/decline line (A/D) gives equal weight to all stocks. Therefore, it is a better gauge of the average small to mid-cap stock and not the fewer in number large or mega-cap stocks.
Features of the A/D Indicator
- The advance/decline line (A/D) measures the degree of participation in an advance or a decline.
- An advance/decline line (A/D) that rises and records new highs along with the underlying index shows strong participation that is bullish.
- An advance/decline line (A/D) that fails to keep pace with the underlying index and confirm new highs shows narrowing participation.
- Market strength is undermined when fewer stocks participate in an advance of this advance/decline line (A/D).
- On the downside of this indicator, we can consider the market as weak when the advance/decline line (A/D) moves to new lows along with the underlying index.
FAQ
The Advance-Decline (AD) indicator is used to track market sentiment by determining whether advancing or declining stocks outweigh each other on any given day based on their stock prices. It compares the number of advancing and declining stocks from all traded exchanges over a single trading session, usually daily or weekly.
A ratio below 1 means there are more decliners compared to advancers. Similarly, a ratio above 1 indicates there are more advancers than decliners in the investor’s portfolio which can be beneficial for long-term investments as it typically reflects healthy growth that has been maintained over time. An ideal ADR would be around 2. However, this ultimately depends on your own needs/goals when investing in Indian stock market newcomers.
The AD line provides an immediate and accurate indication of swings in either direction depending on whether it rises or falls compared with its previous levels. If there are more Advances over Declines then it will be above its previous level indicating an upswing. Whereas, if there will be more Declines compared with Advances then it will remain below its previous level illustrating a downtrend.
The Advance/Decline Ratio (ADR) divides advances against declines so as to gauge when trends emerge from sideways trading or during periods of volatility within existing trends allowing traders to understand ongoing market conditions quickly and easily without looking through tons of data every day.
Conclusion
The advance/decline line (A/D) is a breadth indicator that reflects participation. A broad-based advance shows underlying strength that lifts most boats of this indicator and then this is bullish. Also, the advance/decline indicator’s narrow advance shows a relatively mixed market that is selective. Narrowness participation in an advance (or decline) sets up the divergence signals of this indicator. An advance with narrow participation is unlikely to keep up with the underlying index. And a bearish divergence will form this advance/decline indicator.
In the same way, a decline with few stocks participating is unlikely to keep up with the index and a bullish divergence will form. These divergences can help chartists identify potential reversals in the underlying index of this indicator.


