The Psychological Line Indicator (PLI) works like other oscillators. It is based on the assumption that traders will resist paying more for a share than others unless obviously, the share continues to move up. Oppositely, traders resist selling a share for less than the price others have been getting for it, except if the price continues to decline. Lastly, traders who purchase the stock at the top trading range will tend to wait until the price comes back before they get out of it.
How the Psychological Line Indicator Works?
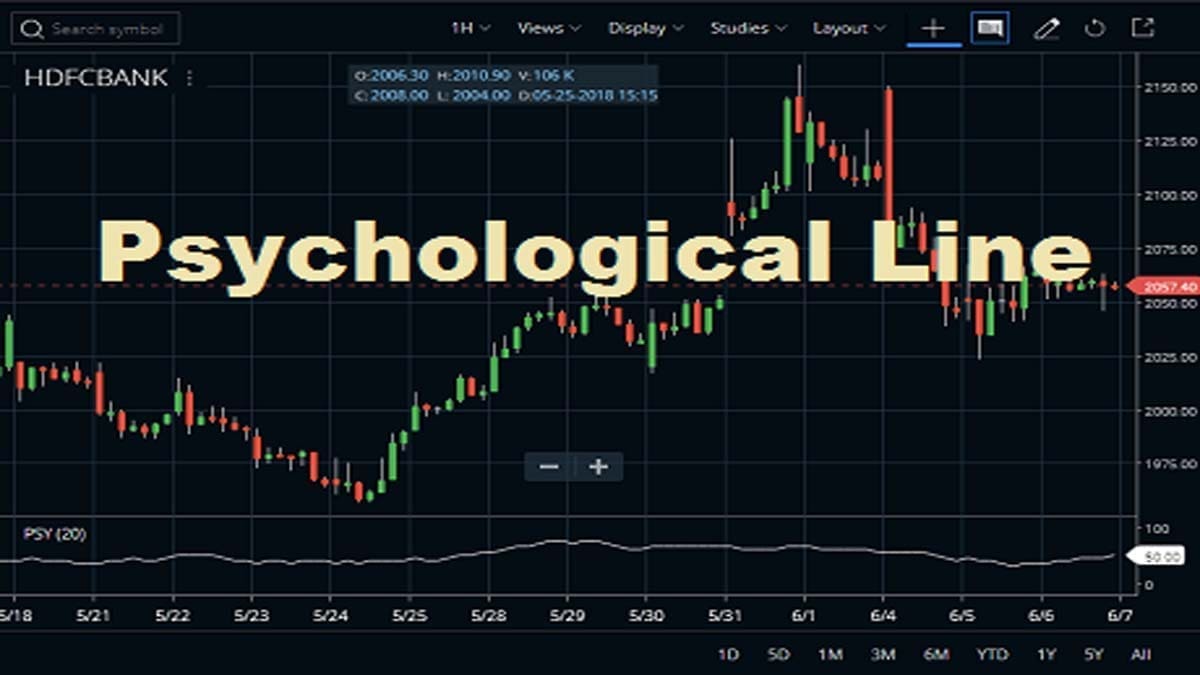
- Being a technical oscillator, the psychological Line fluctuates between the range of 0 and 100.
- If the indicator is above 50, buyers dominate the market, and also the overall sentiment is believed to be bullish.
- And, if the reading is below 50, sellers are in control of the market and the overall sentiment and it is bearish.
The Calculation of the Psychological Line Indicator
The calculation of the Psychological Line Indicator is the percentage of bars that close above the previous candle close within the PLI calculation period. This is then plotted as an oscillator in the indicator pane.
You can customize the indicator calculation period by the parameter period. To change the parameter value of this indicator, traders can change the default value of 20 while attaching the indicator to any chart.






How to Attach the Psychological Line Indicator to Chart?
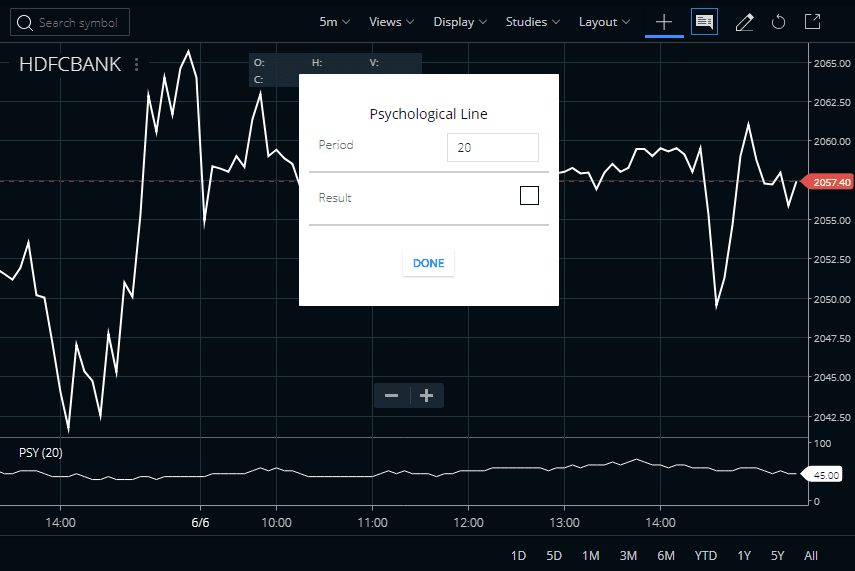
Traders can find the Psychological Line indicator under the STUDIES section in the Zerodha Kite browser app and it is also available in the Kite mobile App. The Period is 20 and we can set the value of the period high and low. You can attach this indicator to any charts like daily, weekly, monthly, or intraday. Please check the image below to understand how we attached the Psychological Line indicator to the HDFC Bank share price chart.
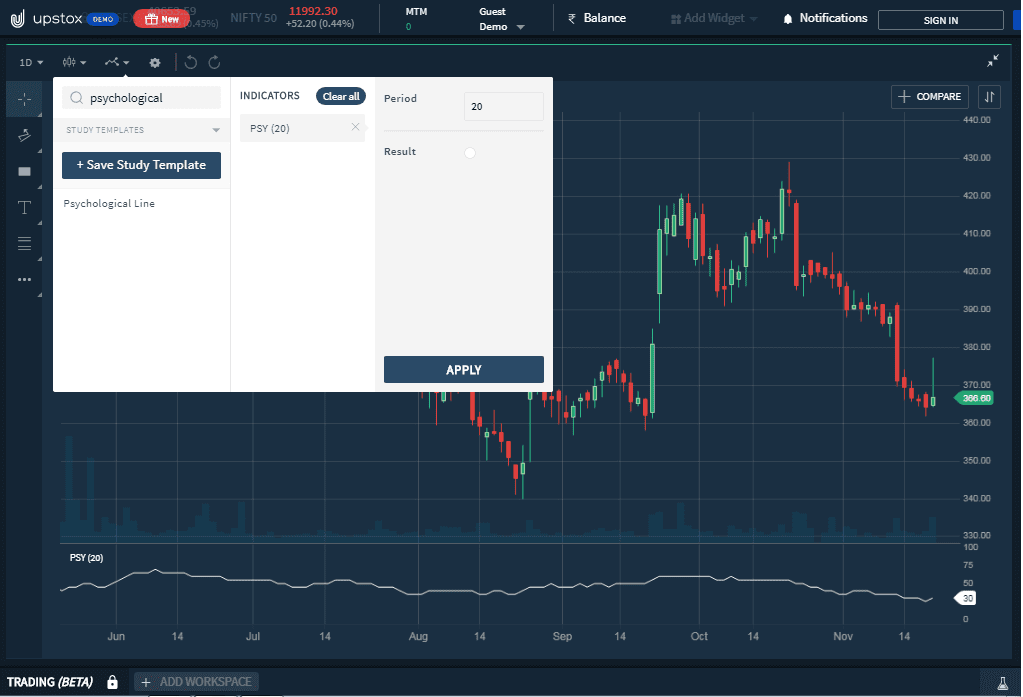
The next charting platform, we are going to see is Upstox Pro. Here, open chart and indicator section. Then search for the indicator and click on apply.
Prime Features of the Psychological Line Indicator
- You can use the psychological Line indicator to generate trading signals.
- One of the methods is to use it to generate counter-trend trades.
- When the indicator reaches upper extreme levels, you can open the sell position.
- In this indicator, the price reversal can be confirmed by candlestick patterns, then trade can initiate and this indicator shows overbought market conditions.
- When the indicator reaches the oversold levels and an upward reversal candle appears then it can be opened the buy positions.
How to Trade Using the Psychological Line Indicator?
Basic Trading Strategies
- The rising indicator line indicates an uptrend and the falling indicator line implies a downtrend.
- The values of the above 70 are overbought and the value of below 30 is as oversold.
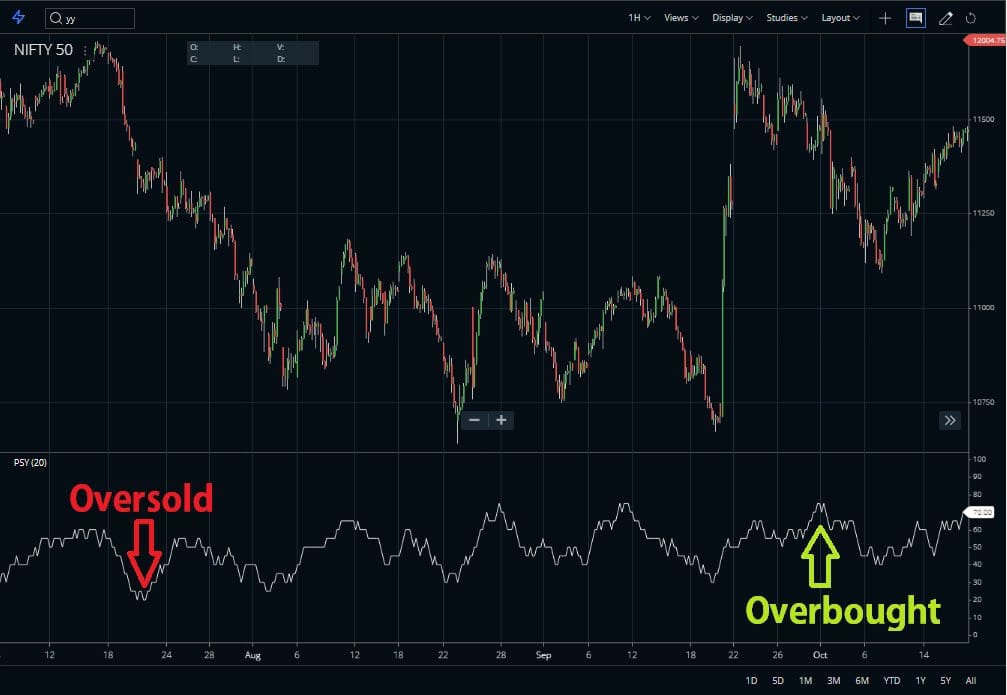
- When this indicator remains at the higher extreme levels, it means the market is trending upward with strength.
- The higher the indicator, the stronger the positive trend. Conversely, the lower the indicator, the stronger the negative direction. Using the readings of this indicator you will be able to make sound trading decisions.
- A strong uptrend of this indicator usually leads to overbought market conditions and consolidation or trend reversal is imminent.
- The opposite situation of this indicator is happening in strong downtrends.
- Also, this indicator can warn about short-term price extremes.
Divergence Trading
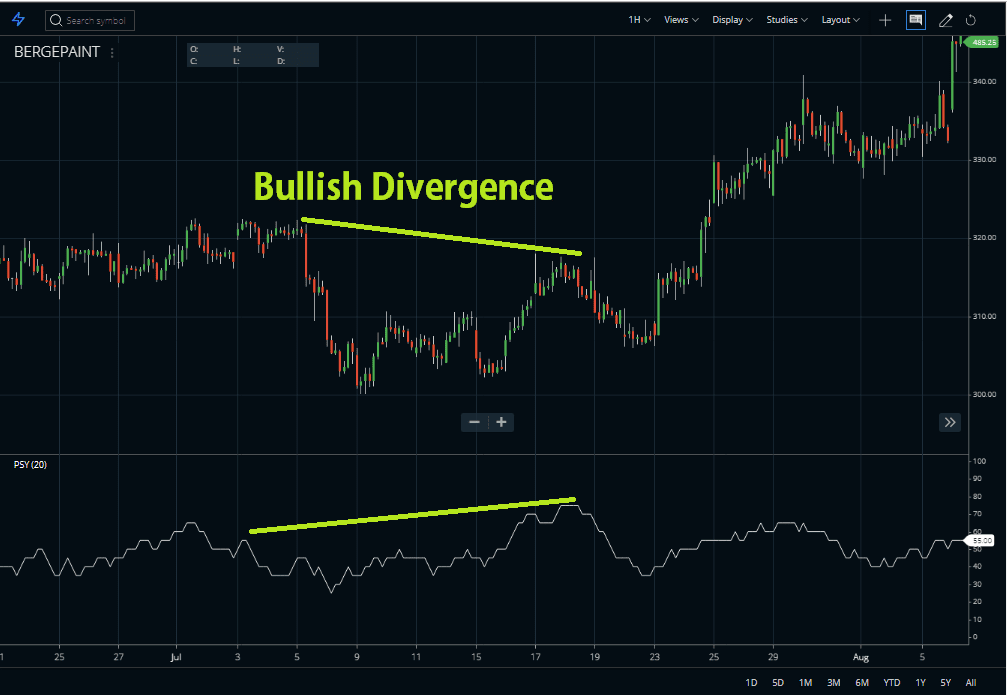
- Now, see the chart below. There you can see a bullish divergence. Any kind of divergence occurs when the price and indicator move in the opposite direction from one another. Bullish divergence is when the price makes a lower low but the indicator makes a higher high, the price is about to go up soon. You can see the scenario from the above chart. The opposite happens during the bearish scenario.
Adding a Supporting Indicator
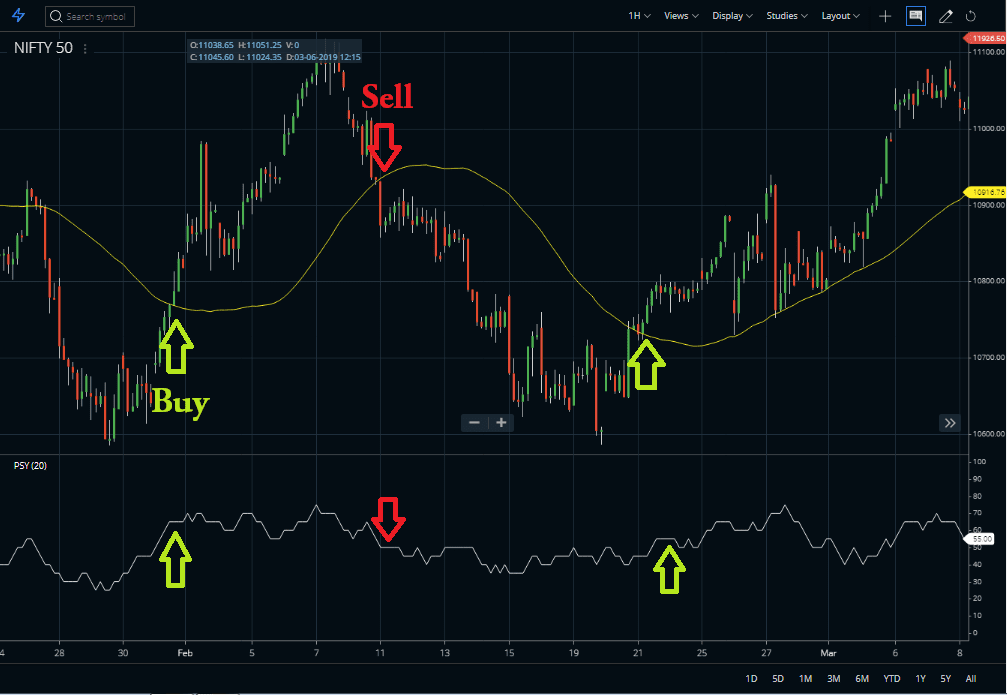
- The next strategy is with the moving average. I have taken 50 SMA (simple moving average) along with the PLI. As you can see, I took the buy position once the price crosses the MA line from below. And, take a sell signal when the price crosses the MA line from above.
- Even when the Psychological Line Indicator acts as the primary indicator, we should always confirm its readings by indications of other types of indicators.
FAQ
To use a psychological line indicator, first, select the data that you will analyze from your charting software. Then set up an oscillator with parameters such as period range and frequency of updates. Finally, view the lines displaying overbought/oversold readings and confirm whether a market reversal is indicated or not.
The Psy Level (Psychological Resistance Line) indicates when prices are likely to reverse direction due to hitting a certain price level psychologically identified by technical analysts. By monitoring this area of resistance on charts, traders can predict when prices may start trending down rather than up in order to open short positions or exit existing long ones ahead of time before losses occur.
There are four main categories of financial indicators that traders commonly use for analysis in trading markets. These include trend-following, volatility-based, momentum-measuring, and volume-related indicators. Examples include moving averages, Bollinger Bands®, Relative Strength Index (RSI), Stochastic Oscillators, MACD (Moving Average Convergence Divergence), On Balance Volume (OBV), etc.
Conclusion
However, now, that you know how to set up the indicator, you can easily go to the platform and give it a try. Chances are it will become an integral and immense part of your trading strategy. But even if not, you will surely get a chance to broaden your trading horizons and learn something new.