Technical Analysis or TA is the study of past market behavior that is followed by a technical analyst. Essentially TA is the play of price and volumes. Plotted on a 2-dimensional scale we see a picture, and as they say “One look is worth a thousand words”, technical analysts get an intangible feel of price. Take a look at the adjacent charts and I’m sure you will agree with me that a quick glance and you know how these asset classes play out in 2016.
What is Technical Analysis?
So far for its visual attributes, the study of technical analysis has evolved since the days of The Great Depression of the 1930s, through several schools of thought, simple mathematics and statistics, and technology. Today on our so-called “smartphones” we can quickly check the chart of almost any exchange-traded asset class in any time frame, such has been the boon of technology to the financial markets and technical analysis. Several technical analysis software has evolved that plot simple and very complex indicators at the click of your mouse. Old-school technical traders probably will say that the feel of price, when you draw charts manually is missing in this software, but we cannot deny the benefits technology has provided to this school of market analysis.
The Difference of TA with Fundamental Analysis
Now, if you compare the important & conventional fundamental analysis, with technical analysis, many will say that the latter is for the short-term and is a good timing tool. For long-term investments, fundamental analysis is the only option. I agree, but not completely. In fact, this is where I feel, comes the biggest strength of a technical analyst, irrespective of the time frame he or she wishes to trade. Let’s take a look at these charts.
A Technical Analyst Follows Charts
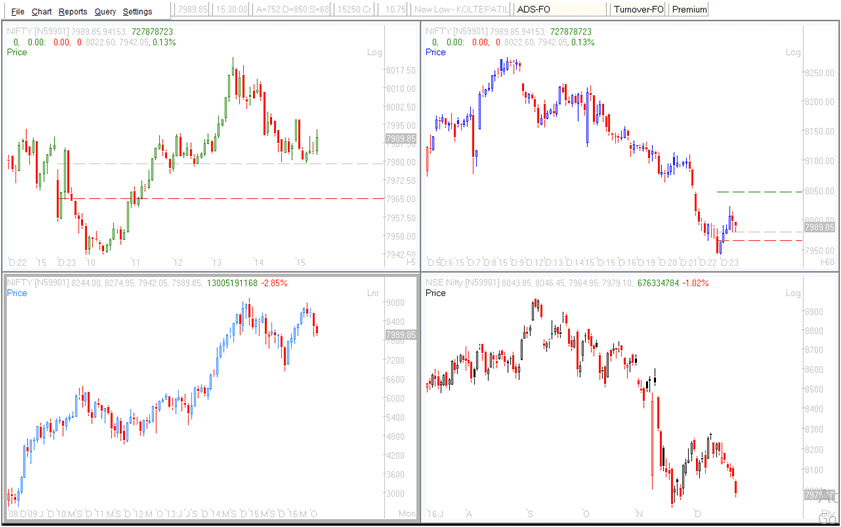
Wonder which stocks or index or asset class are these charts? Well, all these charts are of the same instrument – Nifty Spot. In clockwise order, it’s the 5min, 60min, Daily, and Month charts. I have shown only four, but in reality, technical analysts can literally play with time, when it comes to plotting charts. Say, for example, I am an intraday trader, then I will focus on shorter time frames like 5-15min charts and technical analysis provides that.






My good friend hates the emotional roller coaster that comes with intra-day trading, and so prefers swing trading, for which he will analyze charts within 30-90 mins and yes, technical analysis provides that as well. And finally, our very good common friend is a busy businessman and has limited time when it comes to trading and chooses medium-to-long-term trades and investments. For him also technical analysis will provide Daily, Weekly, and Monthly charts which will help him to passively trade his portfolio. And the cherry on top of this is the fact that all theories and concepts and strategies work equally well in almost all time frames.
Tools for the Technical Analyst
There are several tools and software available for technical analysis. TradingView is a popular platform used by traders for chart analysis and trading. Zerodha Kite is another popular trading platform used in India that offers advanced charting tools and real-time data. There are also virtual trading platforms like NeoStox that allow traders to practice trading without risking real money.
Apart from these platforms, there are several technical analysis software like AmiBroker, Metastock, and Advanced Get that offer advanced charting tools and technical indicators. This software is used by professional traders and investors to analyze the stock market.
So, if you’ve given enough time and effort to read and understand charts, you can trade any time frame. I guess the conventional method lacks. And this is the biggest strength of the technical analysis. As you read this and if you are amongst the new generation of technical traders who wish to “trade for a living”, I suggest learning first before you focus on earn, and for that, there is an ocean of knowledge out there waiting. A good place to start online learning is Investopedia. This offers you a nice mix of elementary and advanced teachings in the subject.
How to Become a Technical Analyst?
After a little over a dozen years in the Indian financial markets analyzing and trading through the lens of charts, I today see the chart as the WHOLE market itself – as if it is asking me, what do I seek from it? So, one simple word of advice, know yourself first in terms of which time frame(s) and strategies you wish to trade, and accordingly prepare yourself and take a calculated risk with the market. Trust me, like any successful professional, will tell you, in markets, the better you prepare, the luckier you get. Trade Well. Trade Wise.

This is a guest post by Mr. Abhijit Paul a veteran technical analyst and a good friend of mine. Mr. Abhijit Paul is a Knowledge Head at Elearnmarkets.com.
FAQ
If you have a strong interest in the stock market and enjoy analyzing data, then becoming a technical analyst can be a fulfilling and lucrative career. However, like any job, it requires dedication and hard work to succeed. The demand for technical analysts is increasing as more traders and investors rely on technical analysis to make informed decisions. As such, technical analysts can expect to earn a good salary and have opportunities for growth and advancement.
There is no specific qualification required to become a technical analyst. However, having a degree in finance, economics, or a related field can be beneficial. Additionally, obtaining certification in technical analysis can demonstrate your expertise and enhance your job prospects. Some popular certifications include the Chartered Market Technician (CMT) and the Certified Financial Technician (CFTe).
The salary of a technical analyst can vary depending on experience, location, and industry. According to Glassdoor, the average salary for a technical analyst in India is around ₹5,00,000 per year. However, with experience and expertise, technical analysts can earn significantly more.
Conclusion
Technical analysis is a powerful method used by traders and investors to analyze stock prices and make informed trading decisions. By combining chart analysis with technical indicators, traders can identify potential trading opportunities and predict future trends. If you are interested in pursuing a career as a technical analyst or simply want to improve your trading skills, there are a number of resources available to help you get started.