The On Balance Volume or OBV is a technical analysis indicator that measures buying and selling pressure. It was developed by Joe Granville. This is introduced in Joe Granville’s 1963 book, Granville’s New Key to Stock Market Profits. It was one of the first indicators to measure positive and negative volume flow. In this article, you will get an entire picture of the OBV indicator along with some of the best profit-making strategies.
Let’s start the content with some of the most frequently asked questions and their answers.
On Balance Volume Indicator FAQ
On Balance Volume is a momentum technical indicator that uses volume flow to determine changes in stock price. Joseph Granville first developed the OBV metrics in his book “Granville’s New Key to Stock Market Profits” in the year 1963. It basically identifies the major moves of the market, based on volume change.
As a cumulative indicator, OBV (On Balance Volume) measures buying-selling pressure, by adding volume in the up days and subtracting volume in the down days. Once the security closes higher than its previous close, all the day’s volume is taken as up-volume.
Yes, on-balance volume (OBV) is a useful technical analysis tool that can help you measure the buying and selling pressure of an asset. It’s especially helpful in determining whether momentum is likely to increase or decrease.
OBV measures changes in the price of a security by looking at how trading volume affects it over time. For example, if prices are increasing but the trading volume decreases, then it could indicate investors aren’t quite sure about taking long positions yet and expect prices will go down again soon.
How to Calculate On Balance Volume?
The calculation of OBV is quite straight. Let’s have a quick look at the formulas below:
- When the closing price is above the previous closing price, Current OBV=Previous OBV+Current Volume
- Once the closing price is below the previous closing price then, Current OBV=Previous OBV-Current Volume
- Now, if the closing price equals the previous closing price, Current OBV=previous OBV (no change)
How to Attach On Balance Volume Indicator on Chart?
Now, I will show you how you can attach the On Balance Volume Indicator to Chart. For instance, I’ve taken two charting platforms, Zerodha Kite and Upstox Pro. I choose these platforms for their popular trading terminals.
Attaching OBV Indicator in Zerodha Kite
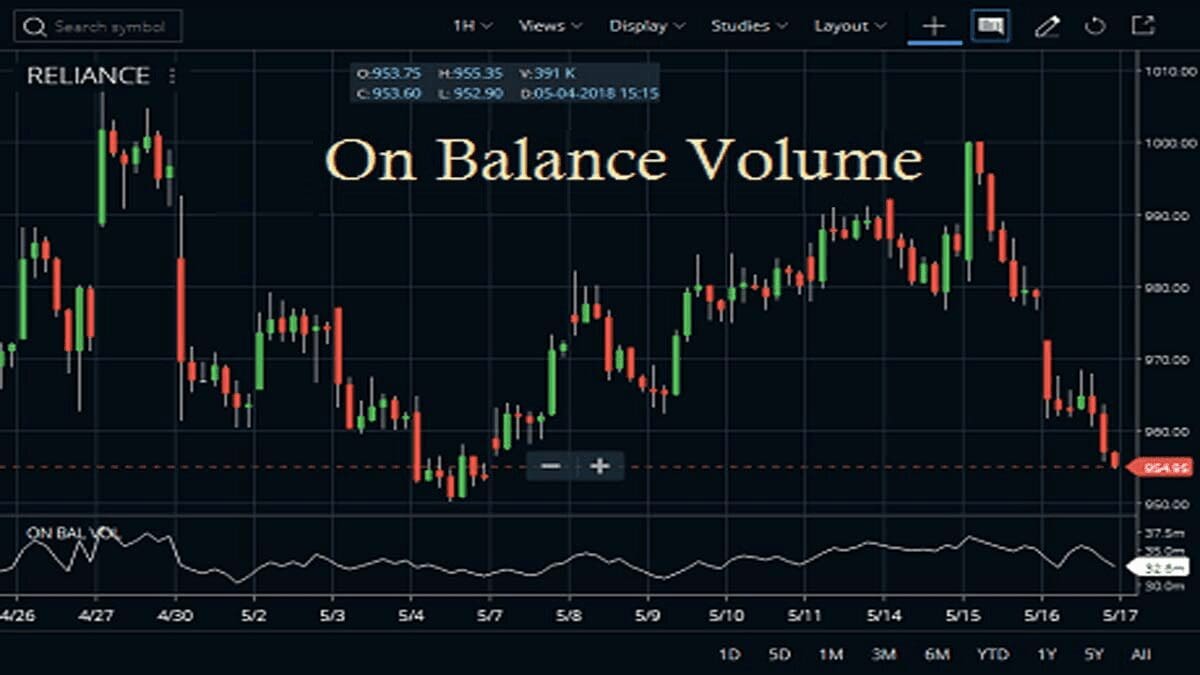
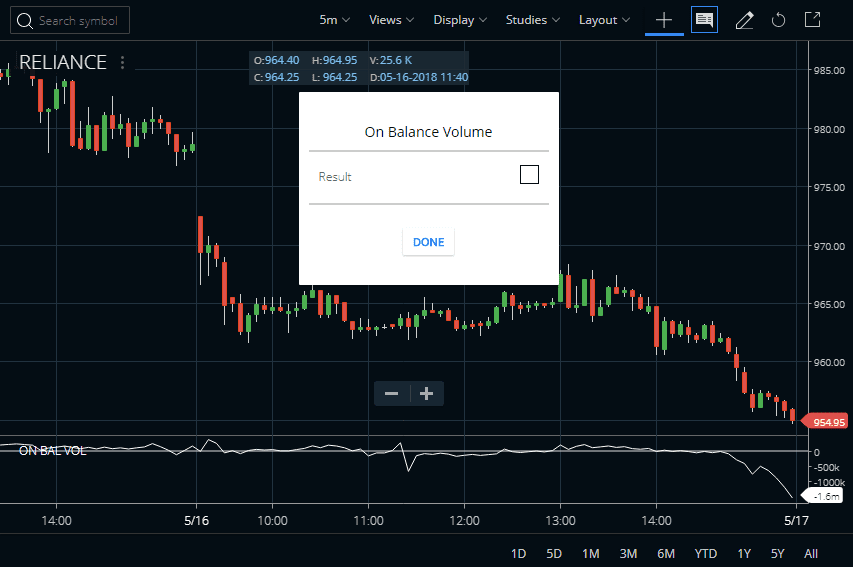
Traders can find the On Balance Volume indicator inside the STUDIES section in the Zerodha Kite platform. You can attach it to any chart from there. Check the image below where we attached the OBV indicator on Reliance Industries’ shares price chart. One customizable option is also available, you may change the color of the result just like I set white here.
Attach OBV in Upstox Pro
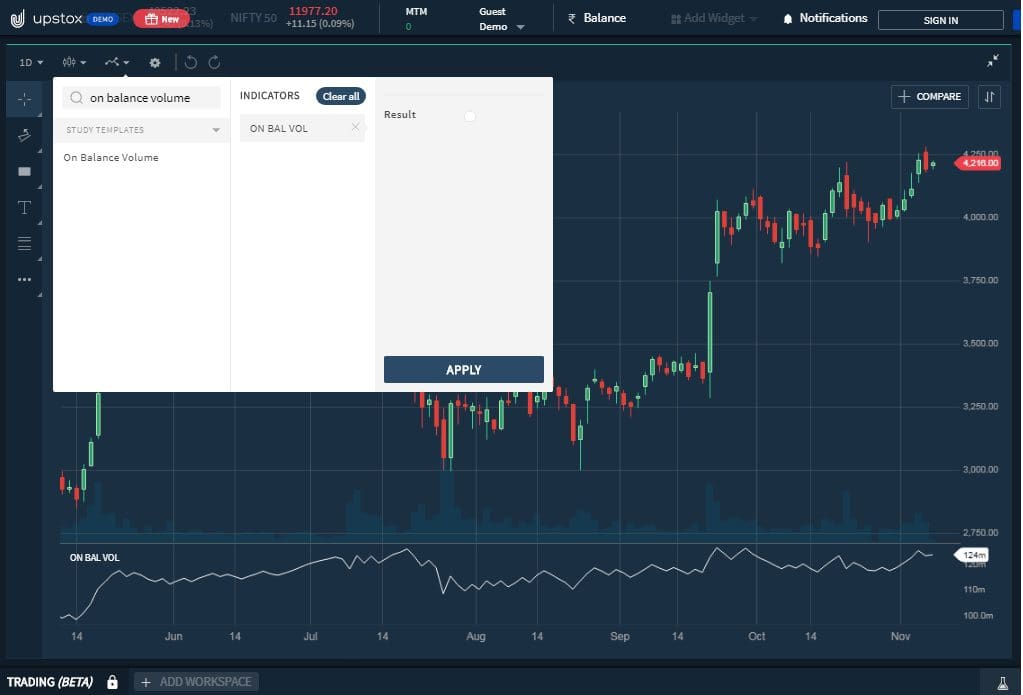
First of all, go to your account dashboard in Upstox. Then open a chart of any security. After that, open the indicator section. Type the name of the indicator, customize it as per your choice, and click on apply. Once you click on apply, the indicator will come there.


Features of OBV Indicator (On Balance Volume)
There are some of the key features of the On Balance Volume Indicator. So, just check the features carefully. After it, we will move to the strategic part.
- The indicator works by keeping a running tally of volume in accordance with the direction of an asset.
- We can use the indicator to confirm the price trend. Otherwise, it warns of the potential price reversal.
- The reversal pattern can be determined by using the divergence strategy.
- For traders, the value of the indicator is not important, rather it is the rate of change it is used to help generate trade ideas.
- If the On balance volume is moving notably in one direction, it could give you the idea that a big move could be coming in that price direction.
- The actual indicator value is not important since the number can be huge, near-zero, negative, or positive.
How To Interpret the On-Balance Volume Indicator?
Here, I am going to explain various types of technical strategies by using OBV. Let’s start from the very basics and then we will head forward to advanced.
Identifying the Trend with OBV Indicator
First of all, remember one thing that, the On Balance Volume Indicator moves up or down faster than the corresponding move in price.
Downtrend
In this indicator, when both price and indicator are making lower peaks, the downward trend is likely to continue.
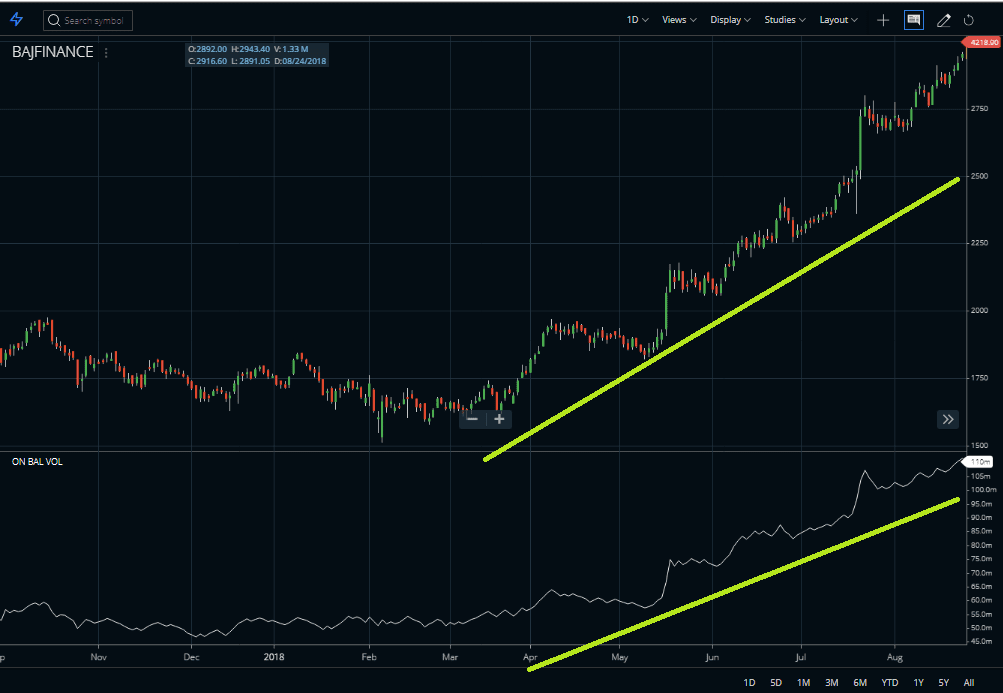
Uptrend
In this indicator, when both price and indicator are making higher peaks, the upward trend is confirmed.
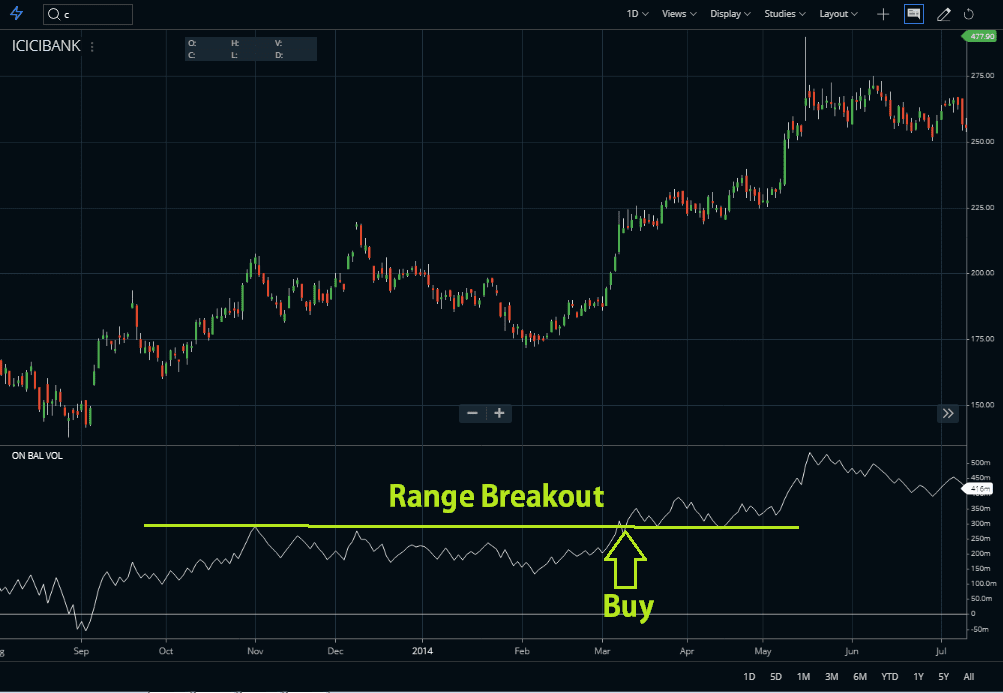
Trading Range
During a trading range, rising On Balance Volume indicates accumulation and hence chances of an upward breakout. Now, have a look at the picture below, there on the conjunction of the range breakout, you may enter into it.
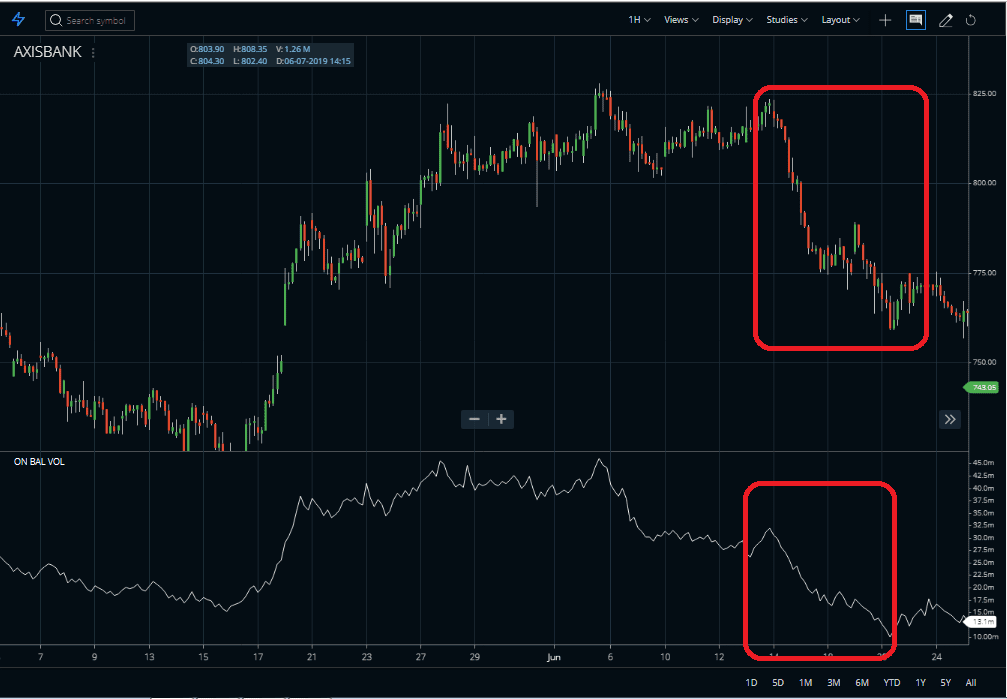
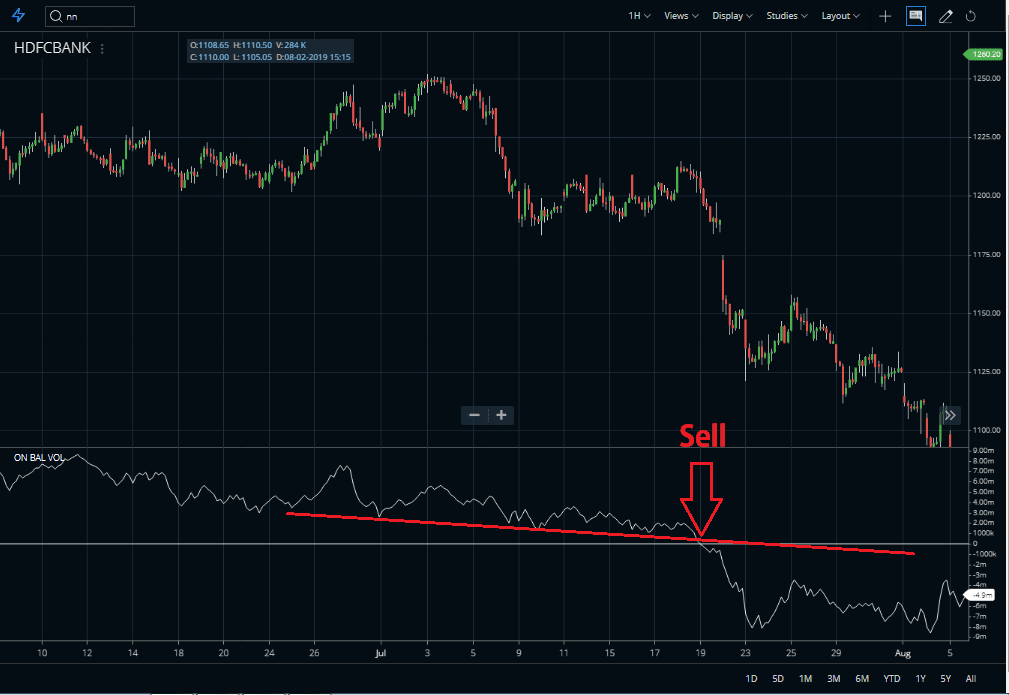
Breakout or Breakdown
During a trading range, falling OBV indicates the distribution and hence chances of support breakdown.
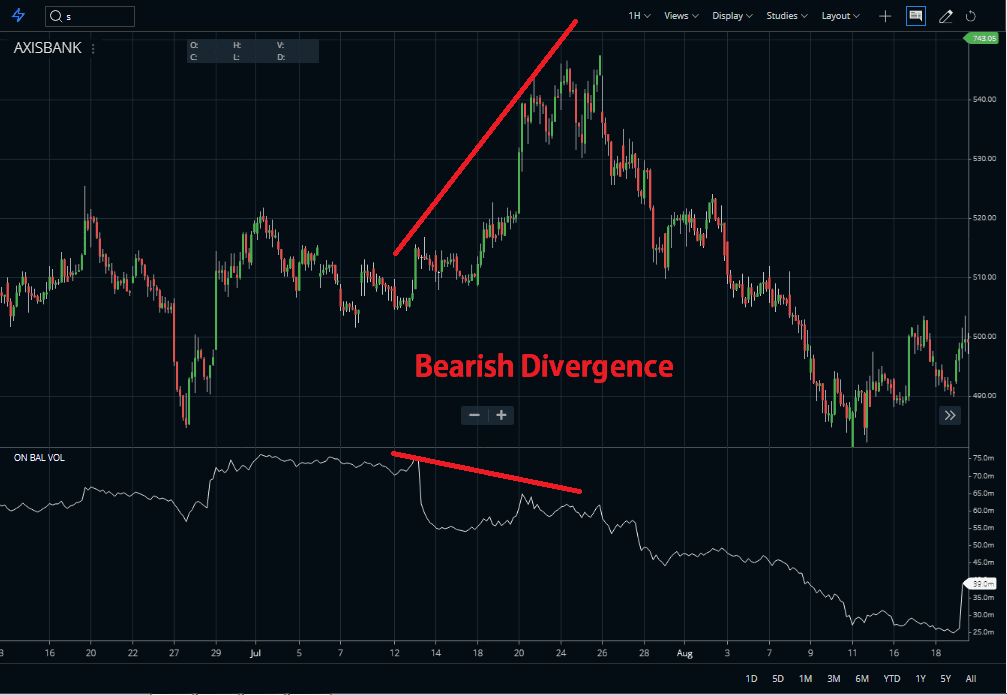
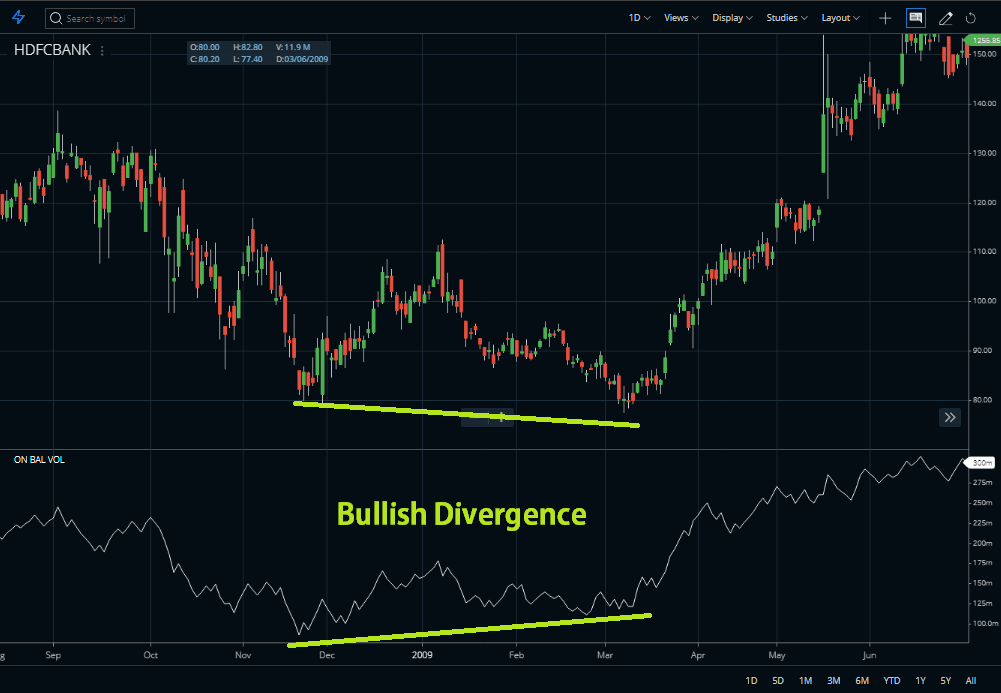
Identifying the Divergence with OBV Indicator
Now, come to the divergence point, the bearish divergence comes when the price continues to make higher peaks and OBV fails to make higher peaks, then the upward trend is likely to stall or fail.
Positive divergence is when the price continues to make lower troughs and OBV fails to make lower peaks, the downward trend is likely to stall or fail.
Conclusion
This is a simple indicator that uses volume and price to measure buying pressure and selling pressure. In this indicator, buying pressure is evident when positive volume exceeds negative volume and the OBV line rises and selling pressure is present when negative volume exceeds positive volume and the OBV line falls. Like all the other technical indicators, it is important to use the OBV in conjunction with other aspects of technical analysis. It is not a standalone indicator and thus should be used prudently.


