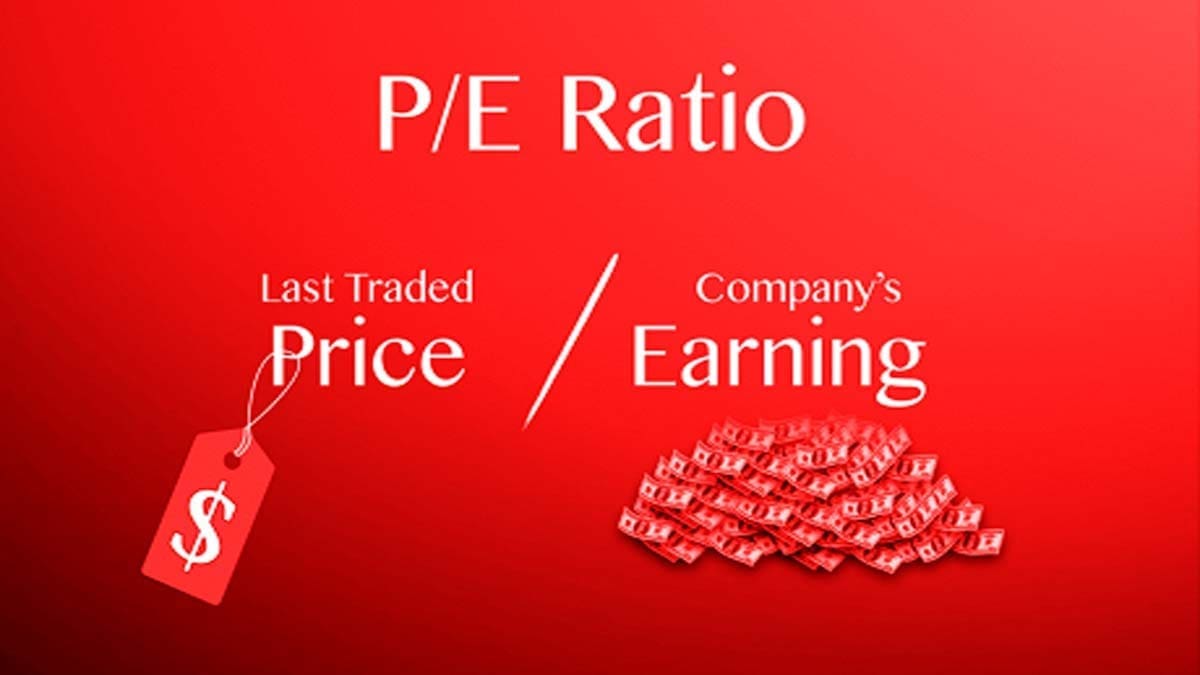
PE Ratio, often called the price-earnings ratio is a quite prominent indicator for an investor. This ratio helps to evaluate a company’s financial position and the stock’s fair market value. The price-to-earnings ratio gives the idea of the growth potentiality of the stock market.
Mainly it indicates what the market is willing to pay for the earning of a company. By calculating PE, an investor can get a fair scenario regarding stock price and profit. P/E Ratio meaning and formula are quite important in fundamental analysis to understand profitable investment planning.
Popular FAQ about PE Ratio
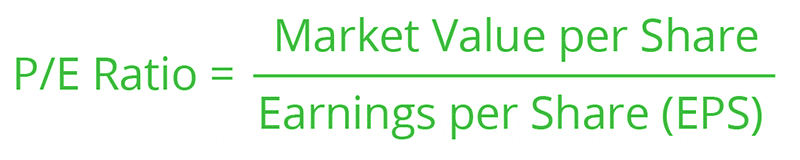
The P/E ratio is one of the most popularly used tools for stock selection. You can calculate it by dividing the current market price of the stock by EPS or earnings per share. It reflects the sum of money you are paying for each rupee worth of the earnings of the company.
Basically, a high P/E ratio shows that investors are expecting higher growth in the future. The current average market P/E ratio is approximately 20 to 25 times earnings. Companies that are losing money do not have a high P/E ratio. They have a low price-to-earnings ratio.
You can calculate it by dividing the market value price per share by the EPS. A trailing P/E ratio happens when the EPS is based on the past period. Leading price-to-earnings ratios to happen when the EPS calculation depends on future predicted numbers.
A stock is simply overvalued if its present price isn’t supported by its P/E ratio result or earnings projection. The P/E ratio is also referred to as earnings multiple. Suppose, a company’s stock price is 50 times earnings, the company is likely overvalued in comparison to a company that’s trading for 10 times earnings.
What is the Price to Earnings Ratio?
Before we go through the discussion of PE Ratio meaning and formula, let’s take a short look at EPS. In order to understand the P/E Ratio in detail, it’s necessary to calculate EPS first. EPS stands for earnings per share. To calculate dividends must be subtracted from the annual income and then divide the amount by the weighted average number of shares. Therefore we can get profit per share.
PE Ratio Meaning and Formula
Price earnings ratio is a ratio between market price or stock price and EPS (earnings per share). PE helps investors to research and analyze what should be the stock price based on the company’s current earnings. Basically, there are two prices to earnings ratios, Forward PE and Trailing PE Ratios.
Forward Price To Earnings Ratio or Forward PE
The calculation of this ratio requires the previous period of earnings per share. To calculate it, we require the last four quarters’ earnings. The future price-to-earnings (forward P/E) ratio is also a variation of the price-to-earnings (P/E) ratio that employs expected earnings to calculate the P/E. While the earnings utilized in this calculation are only estimates and not as trustworthy as current or historical data of earnings, projected P/E analysis still has advantages.

Calculation of Forward PE
Suppose a company holds a current share price of 50k rupee and the present year’s EPS is 5k so now it is quite clear that the forward P/Eratio will be 10%. This 10% is the company’s growth rate according to an analyst. In the following, I have calculated the ratio so that you can have a clear view.







Trailing Price To Earnings Ratio or Trailing PE
This ratio is an estimation of the upcoming quarter’s earnings. Trailing PE calculation is based on the future number. Dividing a company’s stock price by its most recent fiscal year’s earnings helps to calculate this ratio. When individuals talk about the P/E ratio in general, they usually mean the trailing P/E. Multiplying the current market value or share price, by the prior year’s earnings per share (EPS) helps to direct the correct ratio.
The income statement in the annual report contains the earnings for the most recent fiscal year. At the bottom of the income statement there, they present yearly EPS. To get the trailing P/E ratio, divide the current stock price by this value.

Calculation of Trailing PE
Suppose a company has a stock price of 50,000 rupees and their trailing EPS is 2,000 for 12 months. So the trailing will be 25%. As I have attached a calculation previously so I hope it won’t be a problem for you to calculate any company’s trailing P/E ratio by yourself.
Average PE Ratio
The limit of the average ratio is 20-25. Low PE indicates undervalue and a high ratio indicates the overvalue of shares. So one should not buy shares only by the profit-sharing ratio indication. There are other factors too. Investors must analyze these factors should before investing in a stock. These are as follows:
- Market Capitalization
- The growth rate of a company
- Debt
- Risk
- consumer market
- Market segments
Why is PE Ratio Important?
The price of a company follows the earnings over the long term. When earnings go up, the stock price goes up. As the earnings go down, the price goes down. The ideal PE ratio for most stocks is between 15 to 20. The price-to-earnings ratio also indicates the growth of a company. As per Ben Graham PE of 8.5 indicates zero growth per year, PE of 18.5 indicates 5% growth per year while PE of 48.5 indicates 20% growth per year.
Features of PE Ratio
- The PE or price-to-earnings ratio relates to a company’s share price to its EPS or earnings per share.
- A high P/E ratio may also reflect that a company’s stock is over-valued otherwise else that investors are expecting high growth rates in the future.
- Companies that have no earnings or that are losing money do not have a price-to-earnings ratio. Since there is nothing to put in the denominator.
- Two types of P/E ratios – forward and trailing P/E. Therefore, investors use both of them in practice.
Comparison of P/E Ratio
In the following we are going to compare the P/E ratio to different aspects and also to different companies.
Peer Comparision of the P/E Ratio
As we previously knew that we can not find a company’s current situation based on its P/E ratio. Because it can be determined by some false statement. As you compare different companies in the same sector which is also known as peer comparison will help you to understand, the true value of the stock you want to invest in. Here we will compare different companies’ P/E ratios by using peer comparison.

These are some of the similar companies which belong to the same sector. Here, I have highlighted their P/E ratio to show how it differs from company to company. After observing this, it is quite clear that there is nothing called an ideal P/E ratio. As high the ratio is that high the company value is.
Industrial P/E ratio
There are so many companies belonging to the same sector. These industrial sectors hold an average P/E ratio which also uses as a standard ratio. Suppose the industrial P/E ratio is 20% but a company named ABC Ltd. holds less than 20% of the P/E ratio. That means the company is not that promising. There are so many other companies from that same sector that holds a better position in the stock market of India. Investing in those companies can be more beneficial.
Nifty Stock’s P/E ratio
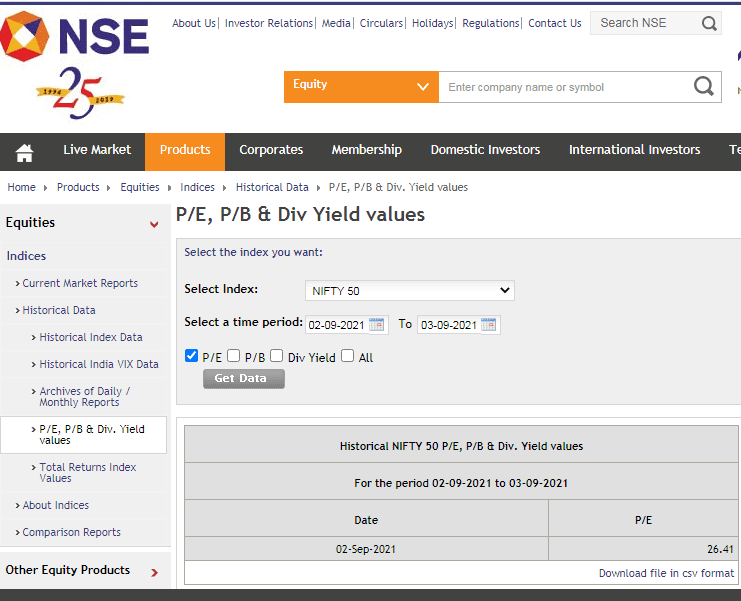
As I’m updating this post on September 3rd, 2021, I am presenting you the current nifty P/E ratio that you can use as a standard ratio to compare other companies’ present market situation. This will be very helpful if you specifically want to invest in Nifty stocks only by comparing their standard P/E ratios to your desirable companies. Especially those that you are intended to invest in.
Conclusion
Investors can compare companies on their price-to-earnings ratio to find the better stock to invest in. One should compare two same sectors i.e infrastructure and service sectors are completely different, so comparisons between these two are not possible. Hence investors prefer a company in the same industry with a lower PE to invest. But many times growth investors even do not mind paying for a higher PE too. Finally, the PE Ratio meaning and formula is quite a vital concept. Long-term investors should follow this.